Infusion data maturity: five stages from spreadsheets to prediction
A five-stage infusion data maturity guide, from spreadsheet pulls to prediction: what each stage gives you, what it needs first, and where most value sits.

Written by Linus Tse, founder of Greyfield Data
· 10 min read
On this page 12 sections
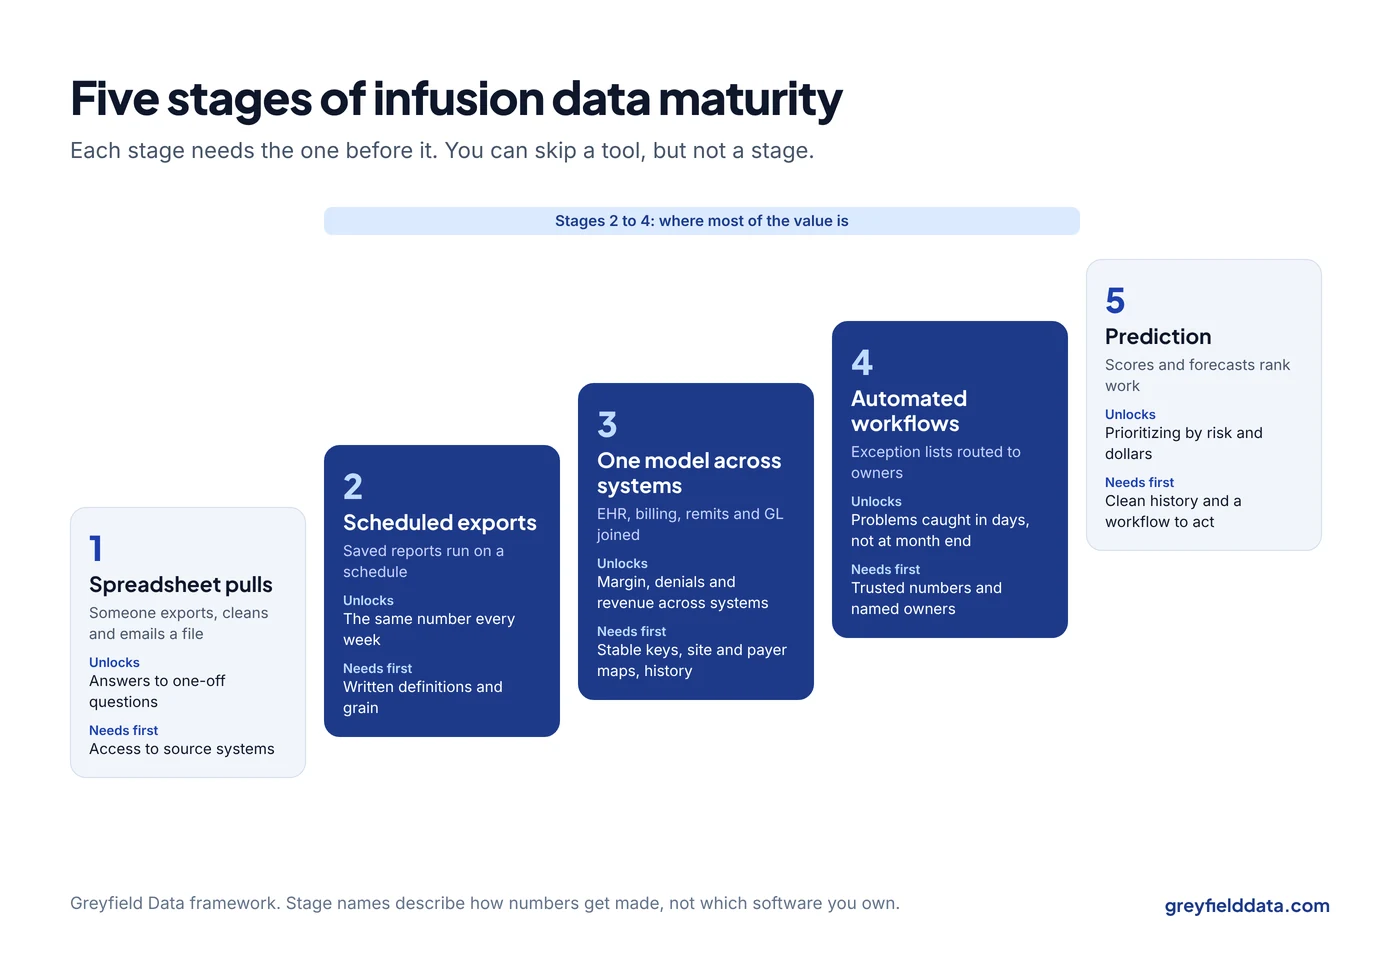
Infusion data maturity is how far your organization has moved from pulling numbers by hand to running on data it trusts without thinking about it. I use five stages: spreadsheet pulls, scheduled exports, one model across systems, automated workflows, and prediction. Each stage needs the one before it, and most of the money is made in stages two through four, not in the last one.
I wrote this from building reports, data feeds, and warehouse models for infusion providers and the companies that serve them. If you want to know where you sit and what to do next, that is the kind of infusion analytics work I do. The infusion center KPI glossary is a good place to check whether your definitions are ready for the next stage.
Key takeaways
- Infusion data maturity moves through five stages: spreadsheet pulls, scheduled exports, one model across systems, automated workflows, and prediction.
- Each stage depends on the one before it. A prediction built on numbers nobody agrees on is a guess with a confidence score.
- Most of the value sits in the middle: scheduled, trusted reports and exception lists that tell staff what to fix this week.
- The real prerequisites are written definitions, a known row grain, and an owner for each number, not a new tool.
- You can skip a tool, but you can't skip a stage. Buying a BI platform does not move you from stage one to stage three.
What are the five stages of infusion data maturity?
The five stages describe how numbers get made, not which software you own. A center with an expensive BI license can still be at stage one if every report starts with someone exporting a spreadsheet and fixing it by hand. The Excel or BI tool guide covers when a tool change actually helps.
| Stage | How numbers get made | What it gives you | What it needs first |
|---|---|---|---|
| 1. Spreadsheet pulls | Someone exports a report, cleans it in Excel, and emails it | Answers to one-off questions | Access to the source systems |
| 2. Scheduled exports | Saved reports run on a schedule with fixed filters | The same number every week, without a person rebuilding it | Written definitions and a known grain per report |
| 3. One model across systems | Operations, billing, remittance, and finance data joined on shared keys | Questions that cross systems: margin by drug, denials by referral source, revenue by site | Stable keys, a site and payer mapping, and history |
| 4. Automated workflows | Exception lists and alerts routed to the person who acts | Problems caught in days instead of at month end | Trusted stage 3 numbers and named owners |
| 5. Prediction | Scores and forecasts that rank work or plan capacity | Prioritizing by risk and dollars; staffing ahead of demand | Clean history at the right grain and a workflow to act on scores |
Stage 1: what does spreadsheet reporting look like?
At stage one, every number is a project. Someone exports orders or appointments, removes the rows that look wrong, adds a formula, and sends a file. The next month, a different person does it slightly differently.
This stage is normal for a new or single-site center, and it works for one-off questions. It breaks when two people bring two different "infusions last month" numbers to the same meeting. In infusion data that usually happens because one counted orders and the other counted appointments, which I explain in orders vs appointments in WeInfuse.
Signs you are here:
- Monthly numbers take days to assemble.
- Nobody can rebuild last quarter's figure exactly.
- The person who knows how the report works is a single point of failure.
Stage 2: what changes when reports run on a schedule?
Stage two is where the same question gets the same answer every week without a person rebuilding it. You save the report with fixed fields and filters, schedule it, and write down what one row means.
This is the cheapest jump with the biggest payoff. It needs no warehouse. It needs a definition per report (numerator, denominator, grain, and clock), a saved report, and a schedule. If you run WeInfuse, its embedded Looker can schedule saved reports to SFTP, email, or other destinations, and the WeInfuse reporting guide covers which Explore to start from.
What it gives you: weekly operating reports people stop arguing about. The 12 reports every infusion center should run weekly are mostly stage two work.
Prerequisites:
- A written definition for each number.
- A chosen grain: order, appointment, administration, claim line, or authorization.
- An owner who checks the report when it looks wrong.
Stage 3: why does one model across systems matter?
Stage three joins the systems that each hold part of the story into one data warehouse, a single source of truth. Joined on shared keys, they answer questions no single system can.
The usual systems are:
- the infusion EHR for orders and administrations
- the billing system or clearinghouse for claims
- 835 remittance files for payments and denials
- distributor invoices for drug cost
- the general ledger for expenses
Examples of stage three questions:
- What is drug margin by drug and payer, using actual acquisition cost and actual payments?
- Which referral sources bring patients whose claims get denied most?
- Is revenue per site growing because of volume, payer mix, or therapy mix?
- Where between order and bank deposit is revenue leaking? The revenue leakage guide walks through the stages.
Prerequisites:
- Keys that match across systems: patient, order, appointment or date of service, claim, and site.
- A mapping table for sites and payers, because each system names them differently. The multi-site KPI rollup guide covers this in detail.
- History. A current-state snapshot can't tell you what last quarter looked like.
This is where most of the build effort goes. It is also where most organizations stall, because the work is unglamorous: mapping, matching, and agreeing on definitions. The infusion data warehouse white paper explains how that build is usually done, and the CFO's guide to an infusion data warehouse covers what should tie to the books.
Stage 4: what do automated workflows add?
Stage four turns trusted numbers into action. Instead of a dashboard someone has to remember to check, an exception list lands in front of the person who can fix it.
Typical lists cover authorizations expiring with visits on the books, administered visits not yet billed, waste not documented, and orders with no appointment after two weeks.
These lists are simple logic on stage three data, and they are where I see the fastest return. Each row is a specific patient, order, or claim with a specific fix. The infusion red flag reports guide lists the ones I would build first, with the logic and grain for each.
Prerequisites:
- Stage three numbers that the team already trusts. An alert built on a number people doubt gets ignored within a month.
- A named owner per list and an agreed response time.
- A way to mark a row as handled, so the list shrinks.
Stage 5: when is prediction worth it?
Prediction ranks work by risk or forecasts demand. Common infusion examples are scoring claims for denial risk before submission, forecasting chair demand by week, and predicting which patients are likely to miss a dose.
Prediction is worth it when three things are true:
- You have clean history at the grain you want to predict.
- A person or process will act differently based on the score.
- The simple version, a rule or an exception list, has stopped finding new problems.
If you're asking whether you need it for denials, the denial prediction guide answers that directly.
Prediction is not worth it when stage three is unfinished. A model trained on claims you can't tie back to the authorization and administration will learn your data quality problems, not your payers' behavior. The AI in infusion operations guide covers how to vet a vendor at this stage.
Where does most of the value come from?
Most of the value comes from stages two to four. Getting the same trusted number every week, joining billing to operations, and putting exception lists in front of staff catch the expensive problems.
Those problems include a dose given after an authorization expired, a waste line never billed, and a denial that sat past its appeal window. The infusion revenue leakage calculator estimates what they cost you each month.
Prediction can add to that. It rarely replaces it. When I scope work with an infusion provider, I usually find more money in a list of administered-but-unbilled visits than in any model.
How do you find your current stage?
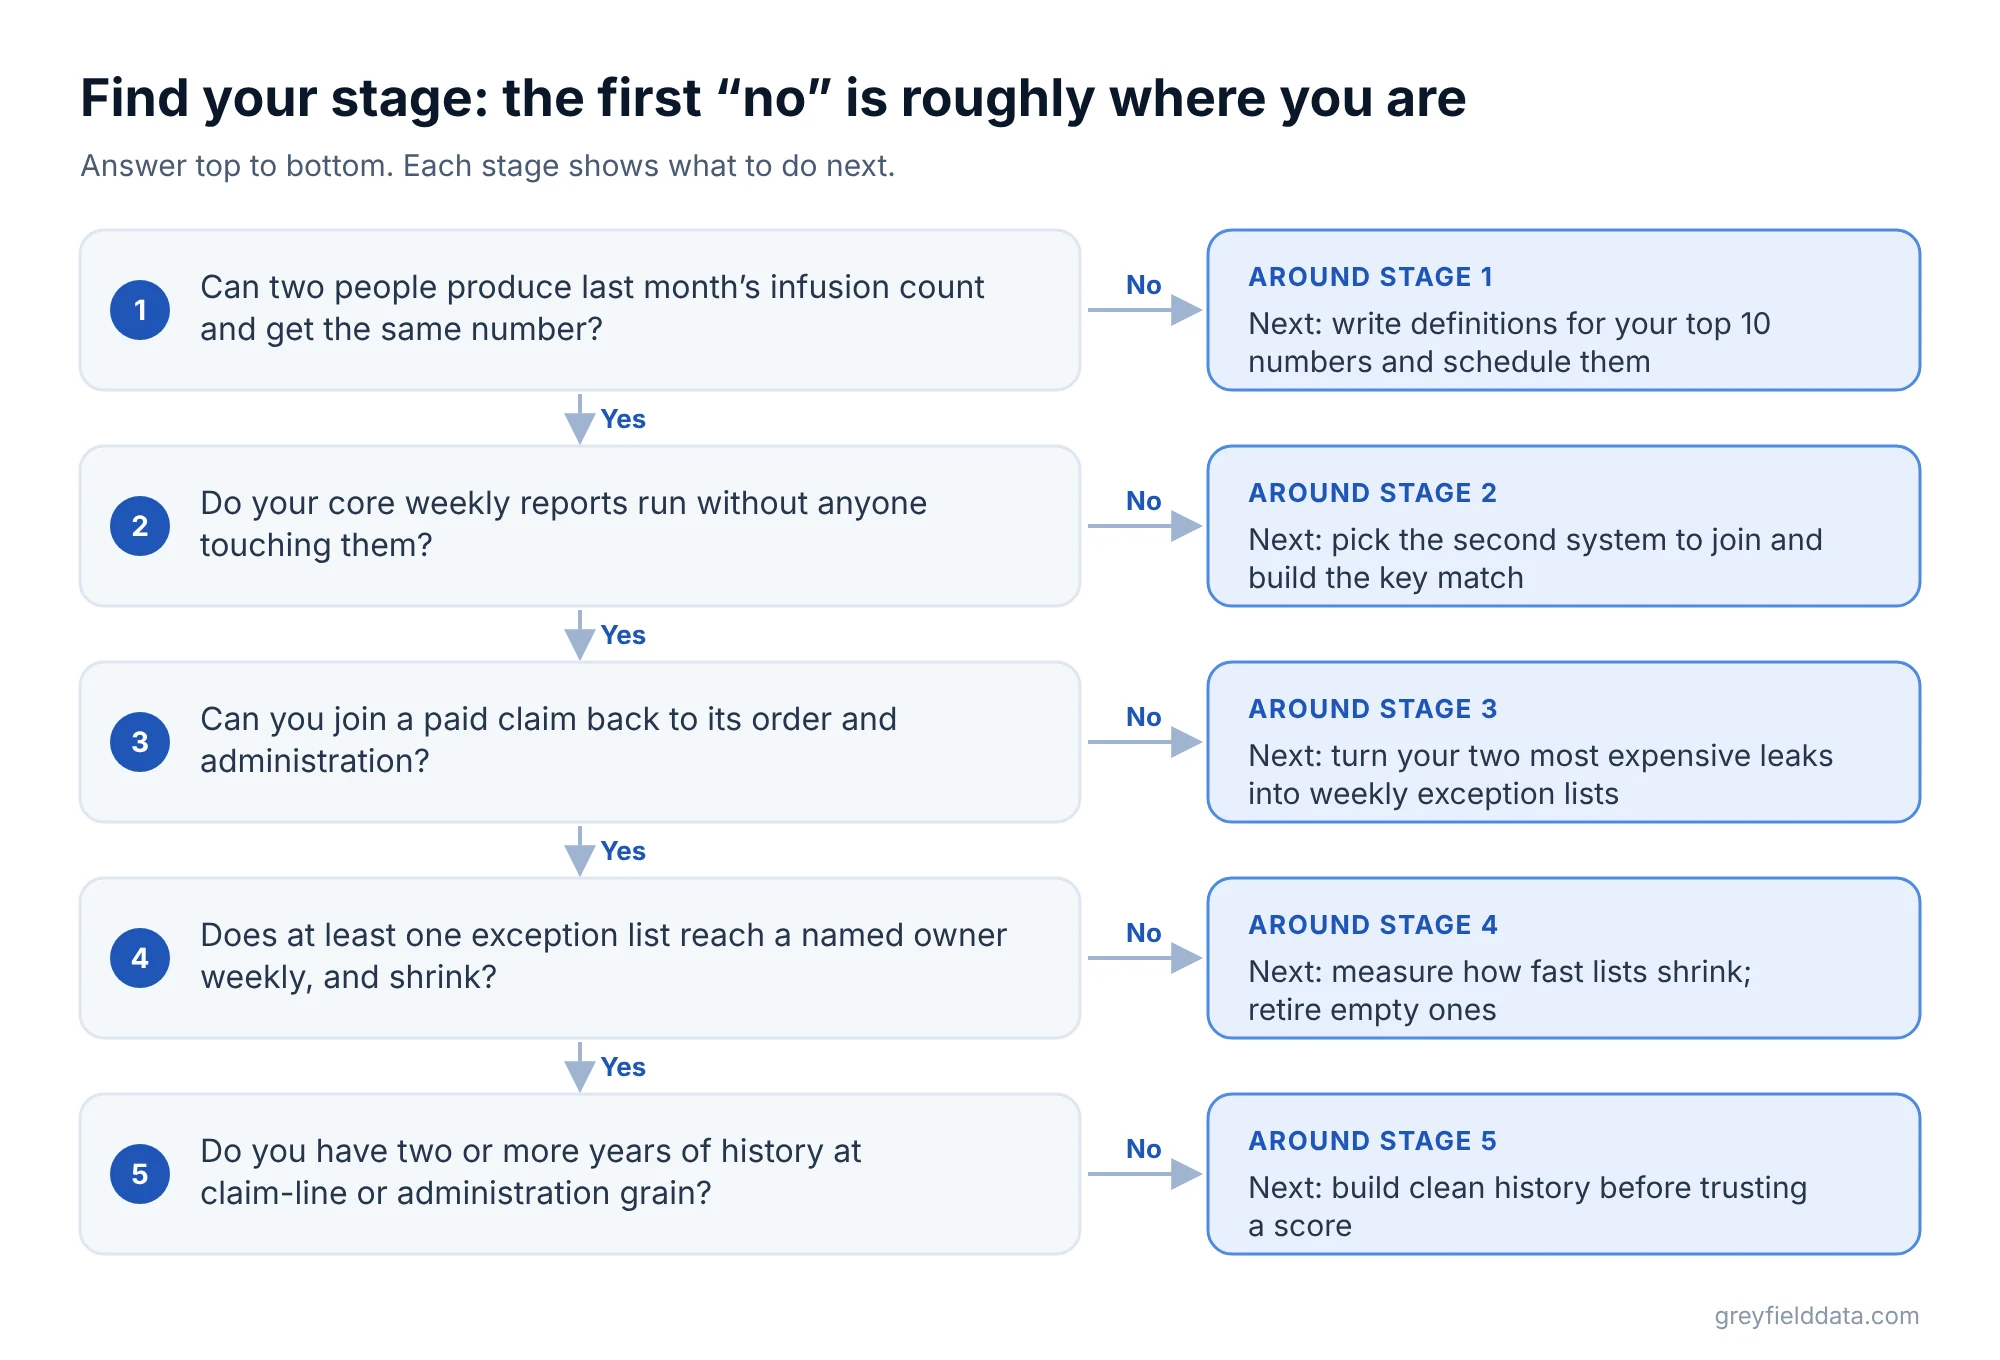
Answer these five questions honestly. The first "no" is roughly where you are.
- Can two people produce last month's infusion count independently and get the same number?
- Do your core weekly reports run without anyone touching them?
- Can you join a paid claim back to the order and the administration it came from?
- Does at least one exception list reach a named owner every week, and does it shrink?
- Do you have two or more years of history at claim-line or administration grain?
For a scored version, the free infusion data readiness check asks ten plain questions about your reports, billing, and sites.
What should you do next at each stage?
| If you are at | Do this next | Avoid |
|---|---|---|
| Stage 1 | Write definitions for your top 10 numbers and save them as scheduled reports | Buying a BI tool before you have definitions |
| Stage 2 | Pick the second system to join (usually remittance) and build the key match | Rebuilding every report in a new tool at once |
| Stage 3 | Turn your two most expensive leaks into weekly exception lists | Dashboards with 40 tiles and no owner |
| Stage 4 | Measure how fast lists shrink; retire lists that stay empty | Adding alerts faster than people can work them |
| Stage 5 | Pilot one score against a simple rule and compare | Models nobody acts on |
What to do next
Score yourself on the five questions above, then pick the one jump that would change a decision this quarter.
For a quick look at capacity, try the chair utilization calculator; for the front of your funnel, the referral leakage calculator. The infusion center metrics playbook collects the definitions in one place. If you want help moving from one stage to the next, book a call with me.
WeInfuse is a trademark of its owner. Greyfield Data is independent and not affiliated with WeInfuse.
Frequently asked questions
What is a data maturity model for an infusion center?
It is a way to describe how your numbers get made, from manual spreadsheet pulls to scheduled reports, joined data across systems, automated exception lists, and prediction. It helps you pick the next step instead of buying tools out of order.
Do we need a data warehouse to improve infusion reporting?
Not at first. Scheduled reports with written definitions (stage two) need no warehouse. You need one when your questions cross systems, such as margin by drug using actual payments and drug cost.
Can we skip straight to AI or prediction?
You can buy a predictive tool at any stage, but it will only be as good as the history and definitions under it. Most centers get more from trusted weekly reports and exception lists first.
How long does it take to move up a stage?
It depends on how many systems you have and how clean their keys are. Moving from spreadsheets to scheduled reports for a handful of core numbers is often weeks; joining operations to billing and remittance usually takes longer because of mapping and matching work.
Part of the Infusion analytics guides, a reading path through related articles.
Linus Tse
Founder of Greyfield Data. Built 400+ dashboards. Certified in Sigma, Snowflake, Tableau, and Power BI.
About Linus