What KPIs should infusion center executives track? The 12-metric playbook
The 12 infusion center metrics to review every week, from referral to first treatment to drug margin, with formulas, what to count, and where the data lives.

Written by Linus Tse, founder of Greyfield Data
· 10 min read
On this page 12 sections

Infusion center executives should track one number for each link in the patient journey: referral and intake, capacity, adherence, revenue, and a data check that says whether the rest can be trusted. I wrote down the 12 I would review every week in a 17-page playbook. For each one it gives the formula, what to count, the dates to use, the common mistake, and where the data lives.
You can get the Infusion Center Metrics Playbook (free PDF). If you want the scorecard built on your own data, that is the reporting work I do for ambulatory infusion centers, and you can book a call to talk it through.
Key takeaways
- The 12 infusion center KPIs worth a weekly look follow the patient journey: four for referral and intake, two for capacity, one for adherence, and five for revenue.
- Every metric needs a written formula, a clear rule for what to count, and which dates and time zone to use. When two reports disagree, one of those was usually left vague.
- Check your data first. A blank required field or a missing batch of data makes every other number wrong in ways you cannot see.
- Intake, capacity, and adherence metrics can usually come from your infusion software. Denial rate, days in AR, and net collection rate need data from the billing system.
- I found no public, well-sourced benchmarks for these metrics at infusion centers, so the playbook shows how to set your own baseline and decide when a number calls for action.
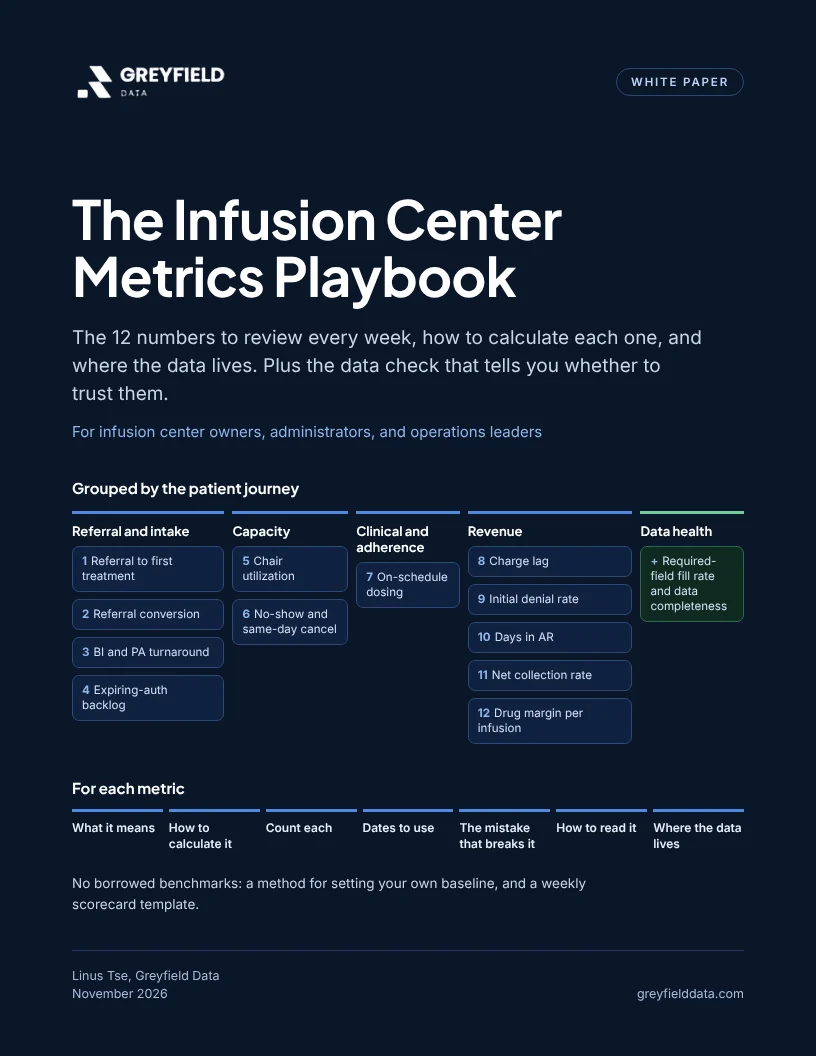
The Infusion Center Metrics Playbook: the 12 numbers to review every week, how to calculate each one, and where the data lives.
Quick answers
- How often to review: weekly, on a one-page scorecard.
- Smallest starting set: referral to first treatment, the expiring-auth backlog, chair utilization, charge lag, and the data check.
- Weekly work lists: authorizations expiring within 14 days, unbilled visits past your limit, missed doses, and the referrals waiting longest.
- Format: a free 17-page PDF with a synthetic worked example.
Who is the playbook for?
It is for owners, administrators, and operations leaders at infusion centers and in-office infusion practices, and for whoever builds their reports. It assumes you have infusion software and a billing system, and that their numbers do not always agree.
What are the 12 infusion center metrics?
They are the numbers that show where a patient, a chair, or a dollar is stuck. Each one gets a full page or half page in the paper.
| # | Metric | Formula | Count each |
|---|---|---|---|
| 1 | Referral to first treatment | Median and 90th percentile days, referral received to first completed administration | Order |
| 2 | Referral conversion | Referrals with a first treatment within your window ÷ referrals received | Order, by referral week |
| 3 | BI and PA turnaround | Median days from request to decision, each separately | Benefits check, authorization request |
| 4 | Expiring-auth backlog | Active treatment series whose authorization ends, or runs out of treatments, before the next dose | Treatment series |
| 5 | Chair utilization | Booked chair-minutes ÷ available chair-minutes | Chair, per day |
| 6 | No-show and same-day cancel | Each ÷ appointments due that day | Appointment |
| 7 | On-schedule dosing | Doses given inside the allowed window ÷ doses due | Dose that was due |
| 8 | Charge lag | Median days, date of service to claim submitted, plus unbilled visits by age | Dose given |
| 9 | Initial denial rate | Claims denied the first time the payer processed them ÷ claims processed for the first time | Claim or claim line |
| 10 | Days in AR | AR balance ÷ average daily charges over a fixed lookback | Billing entity, per snapshot |
| 11 | Net collection rate | Payments ÷ (charges − contractual adjustments), by month of service | Claim |
| 12 | Drug margin per infusion | (Drug payment including billed JW waste − acquisition cost) ÷ administrations | Dose given, per drug |
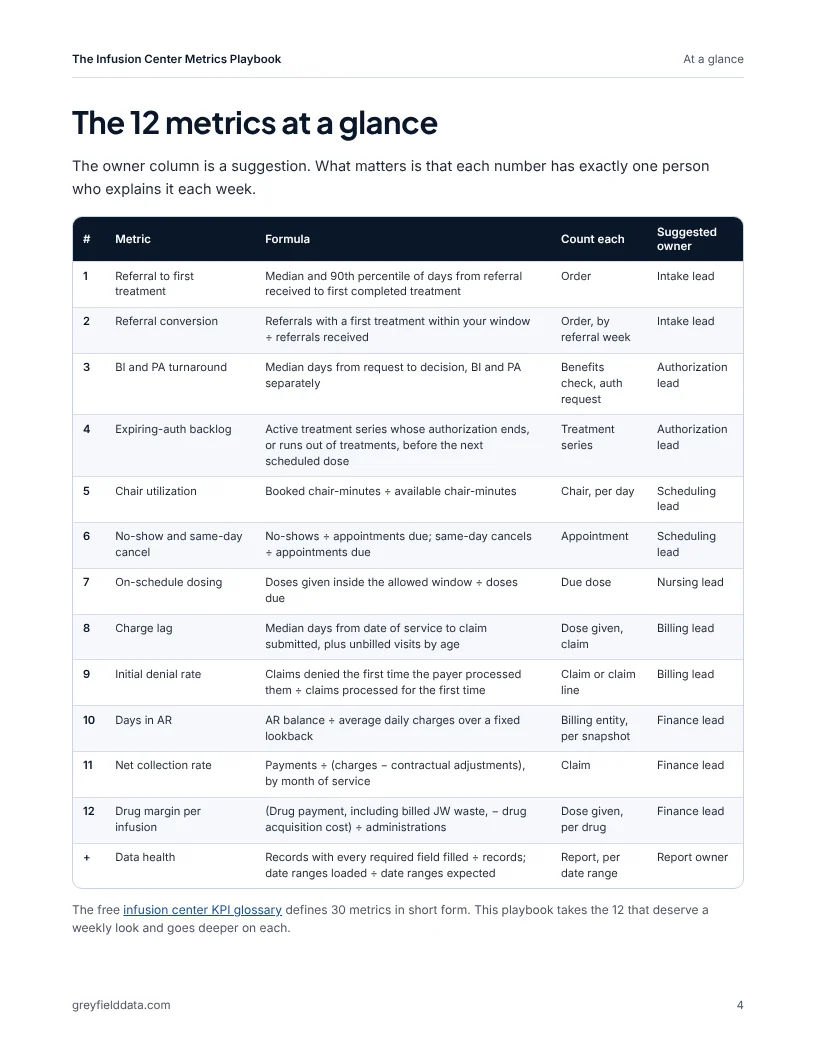
The infusion center KPI glossary defines 30 metrics in short form. The playbook picks the 12 that deserve a weekly review and goes deeper on each.
Which referral and intake numbers matter most?
Referral to first treatment matters most, because every stall on the front end adds to it.
Measure it from referral received to the first completed administration, and always show referrals still waiting by age. If you measure only patients who started, the slowest cases drop out and the number improves as the backlog grows. The referral-to-first-treatment guide shows where those stalls usually sit.
Read it with referral conversion, split by the reason each referral was lost. The free referral leakage calculator puts a value on the referrals that never start. Benefits investigation (BI) and prior authorization (PA) turnaround and the expiring-auth backlog complete the group. The backlog is a work list for the week, not a trend. The expiring authorizations report guide shows how to build it.
How do you measure chair utilization and no-shows?
Divide booked chair-minutes by available chair-minutes, per chair and day, and call it scheduled utilization.
Most platforms store scheduled start and duration, not when the patient left the chair, so "actual" utilization usually is not what the report shows. Use the site's local time, because a UTC timestamp can push late appointments into the next day. The chair utilization calculator runs the math for your site.
Keep no-shows and same-day cancellations as two rates, and leave out appointments cancelled in advance. Each has a different fix. The no-show cost calculator estimates what the gap costs.
Which revenue numbers should an infusion center review weekly?
Review charge lag, initial denial rate, days in AR, net collection rate, and drug margin per infusion. The mistakes that break them are specific:
- Charge lag: measuring only submitted claims hides the oldest unbilled visits. CMS requires Medicare fee-for-service claims to be filed within 12 months of the date of service (Medicare Claims Processing Manual, chapter 1, section 70), and commercial payers set their own limits in each contract.
- Initial denial rate: using final status after appeals makes the rate look better than the work it took. The infusion denial analysis guide shows how to sort payer refusals by root cause. To see what unrecovered denials cost next to missed visits and late billing, try the infusion revenue leakage calculator.
- Days in AR: changing the denominator or lookback without saying so moves the number with nothing collected faster.
- Net collection rate: booking denial and timely-filing write-offs as contractual adjustments hides them. Charges, claims, expected payment and collections explains which number goes where.
- Drug margin per infusion: leaving out discarded drug. CMS requires the JW modifier on a separate line for discarded amounts of single-dose container drugs separately payable under Part B, and the JZ modifier to attest that none was discarded (CMS discarded drugs page).
The paper's synthetic worked example shows a drug that earns a margin when the JW line is billed and loses money when it is missed. The JW and JZ modifier guide covers the billing side, and the buy-and-bill margin calculator runs margin per drug.
Where does the data for each metric live?
Intake, capacity, and adherence metrics usually come from the infusion platform. The revenue metrics need billing, remittance, or invoice data.
For WeInfuse users, the paper names the report area and fields wherever I verified them in its data dictionary. Examples are the appointments Explore for chair and cancellation fields, and the Latest_Authorization Explore for authorization expiry and approved treatments. I did not find claim denial or AR fields there, so those come from the billing system or clearinghouse. The WeInfuse reporting field guide explains how its Explores differ.
WeInfuse is a trademark of its owner. Greyfield Data is independent and not affiliated with WeInfuse.
| Metric group | Usual source |
|---|---|
| Referral and intake | Infusion platform, or a separate prior authorization tool |
| Capacity | Infusion platform, plus a table of chairs and open hours you maintain |
| Clinical and adherence | Infusion platform, with a due-dose schedule you build from the order |
| Revenue | Billing system, clearinghouse remittances, CMS ASP files, and distributor invoices |
| Data health | Report and feed logs |
When these sources live in different systems or sites, a single infusion data warehouse keeps each metric calculated the same way. The Excel or BI tool guide helps you decide where the scorecard should live.
Why are there no benchmarks in the playbook?
Because a benchmark is only useful if it was measured the way you measure, on centers like yours.
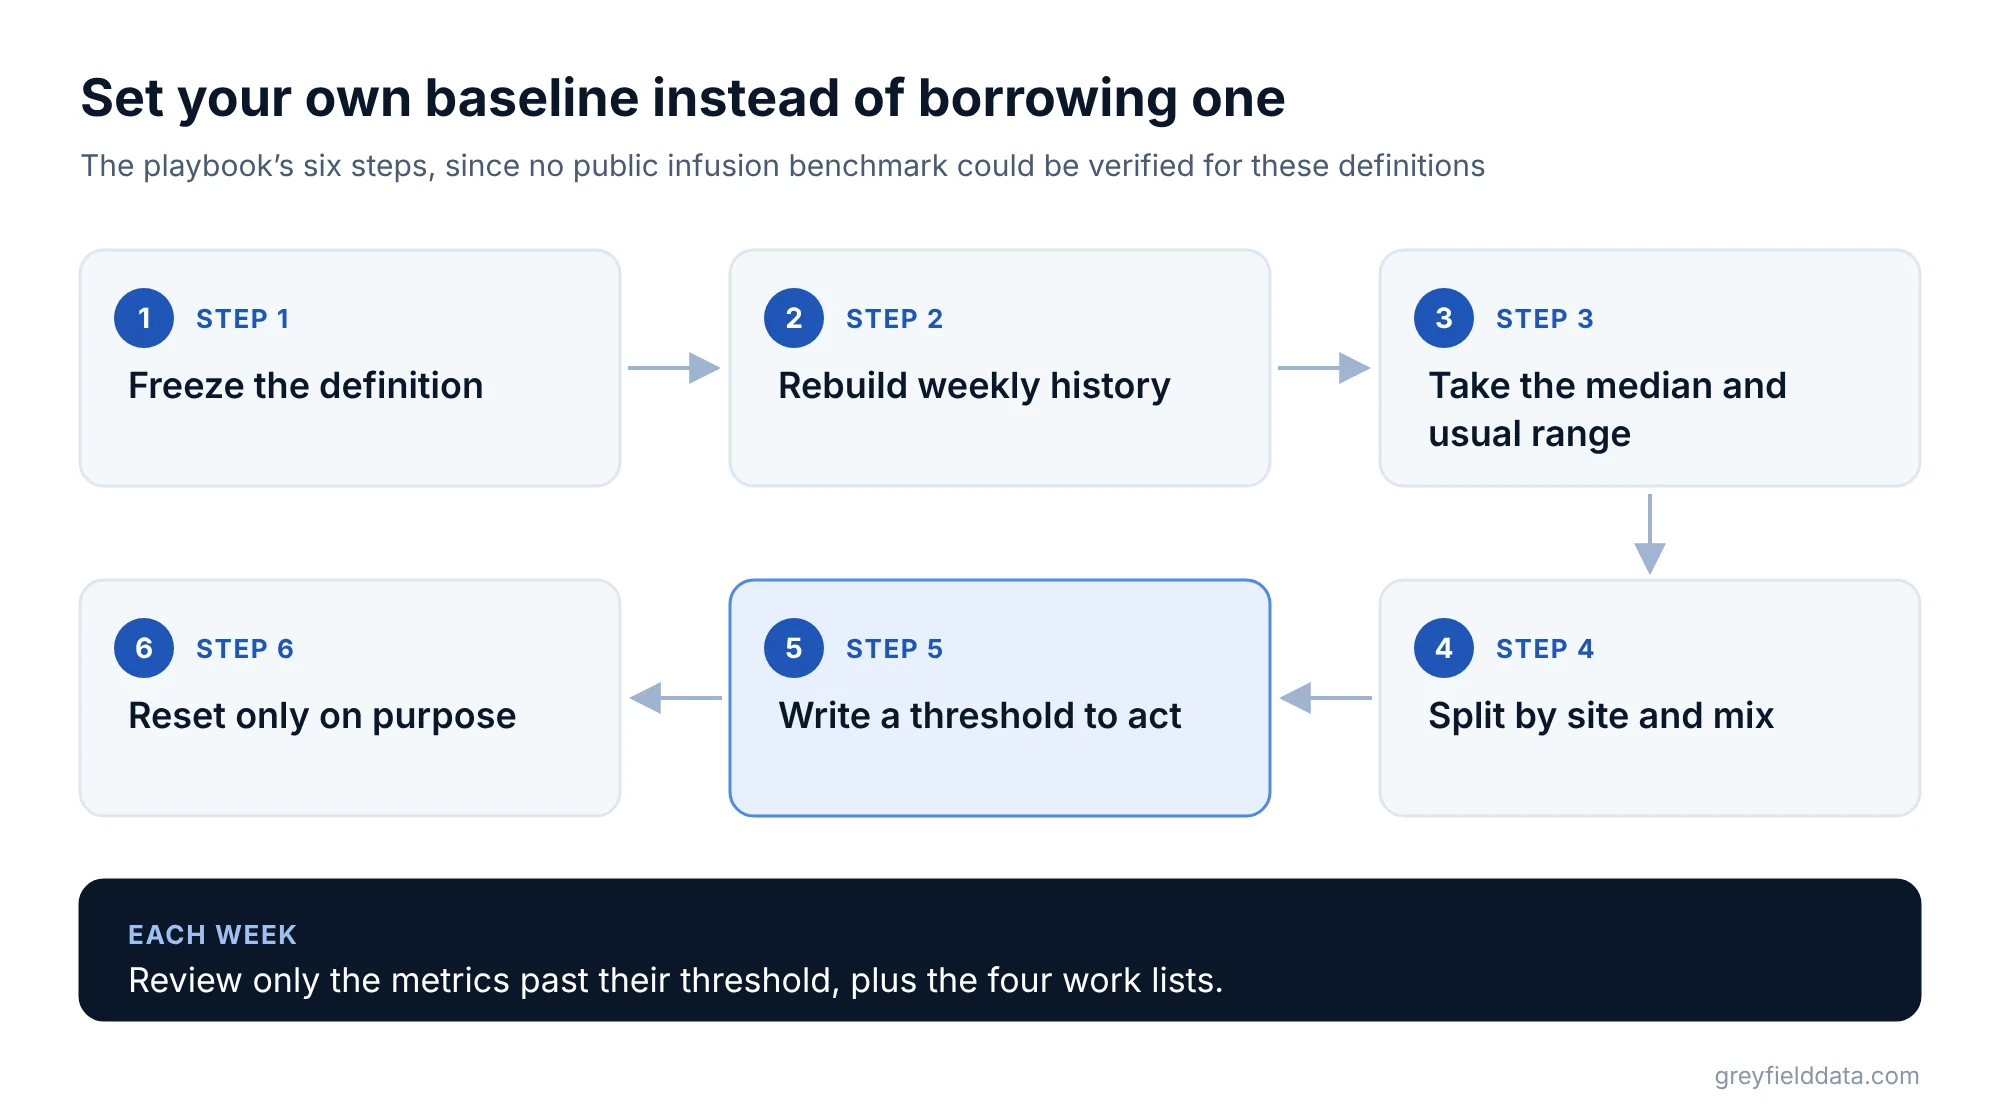
I looked for public primary sources, including CMS, MGMA public pages, peer-reviewed studies, and industry associations, that define these metrics for infusion centers and publish values, and found none I could verify for these definitions. The playbook gives a six-step method instead:
- Freeze the definition.
- Rebuild weekly history.
- Take the median and usual range.
- Split by site and mix.
- Write a threshold to act.
- Reset only on purpose.
What does the weekly scorecard look like?
It is a one-page table with a line for each metric and the data check. Its columns are this week, the four weeks before, baseline, threshold to act, owner, and action.
The review covers only metrics past their threshold, plus four work lists: authorizations expiring within 14 days, unbilled visits past your limit, missed doses, and the referrals waiting longest. If twelve is too many to start with, begin with metrics 1, 4, 5, 8, and the data check. The 12 weekly infusion reports guide shows the work lists in more detail, and multi-site groups can roll the scorecard up with the multi-site KPI rollup guide.
Frequently asked questions
What KPIs should infusion center executives track?
Track four intake numbers: referral to first treatment, referral conversion, BI and PA turnaround, and the expiring-auth backlog. Add chair utilization, no-show and same-day cancellation, on-schedule dosing, charge lag, initial denial rate, days in AR, net collection rate, and drug margin per infusion. Check that the data is complete before reviewing any of them.
What is a good chair utilization rate for an infusion center?
There is no public primary-source benchmark I could verify for infusion centers. Set your own baseline from your weekly history, label it scheduled utilization, and read it with the no-show rate to see whether empty chairs come from bookings or from patients not arriving.
How do you calculate referral-to-treatment time?
Count days from the referral received date to the first completed administration on that order, in local time, and report the median and 90th percentile by referral week. Show referrals still waiting by age next to it.
Can I get denial rate and days in AR from my infusion platform?
Usually not. Those need remittance and AR data from the billing system or clearinghouse. Infusion platforms often hold expected amounts, which are estimates, not collections.
Is the playbook free?
Yes. Enter your work email on the download page and the PDF downloads right away. The worked example uses synthetic figures.
What to do next
Get the playbook, fill in the scorecard for last week, and see which numbers you cannot produce yet.
If your center reports to a manufacturer or hub program, the companion guide, Manufacturer Programs Without the Manual Reporting, covers the checks to run before each program file goes out. The infusion analytics resource hub links every related guide. To have the scorecard built on your data, book a call and bring the reports you use today.
Part of the Infusion analytics guides, a reading path through related articles.
Linus Tse
Founder of Greyfield Data. Built 400+ dashboards. Certified in Sigma, Snowflake, Tableau, and Power BI.
About Linus