Infusion center KPI glossary: 30 metrics, defined
Thirty infusion center KPIs, each with a plain definition, formula, what one row counts, when the clock starts, and the mistake that breaks it.

Written by Linus Tse, founder of Greyfield Data
· 15 min read
On this page 12 sections

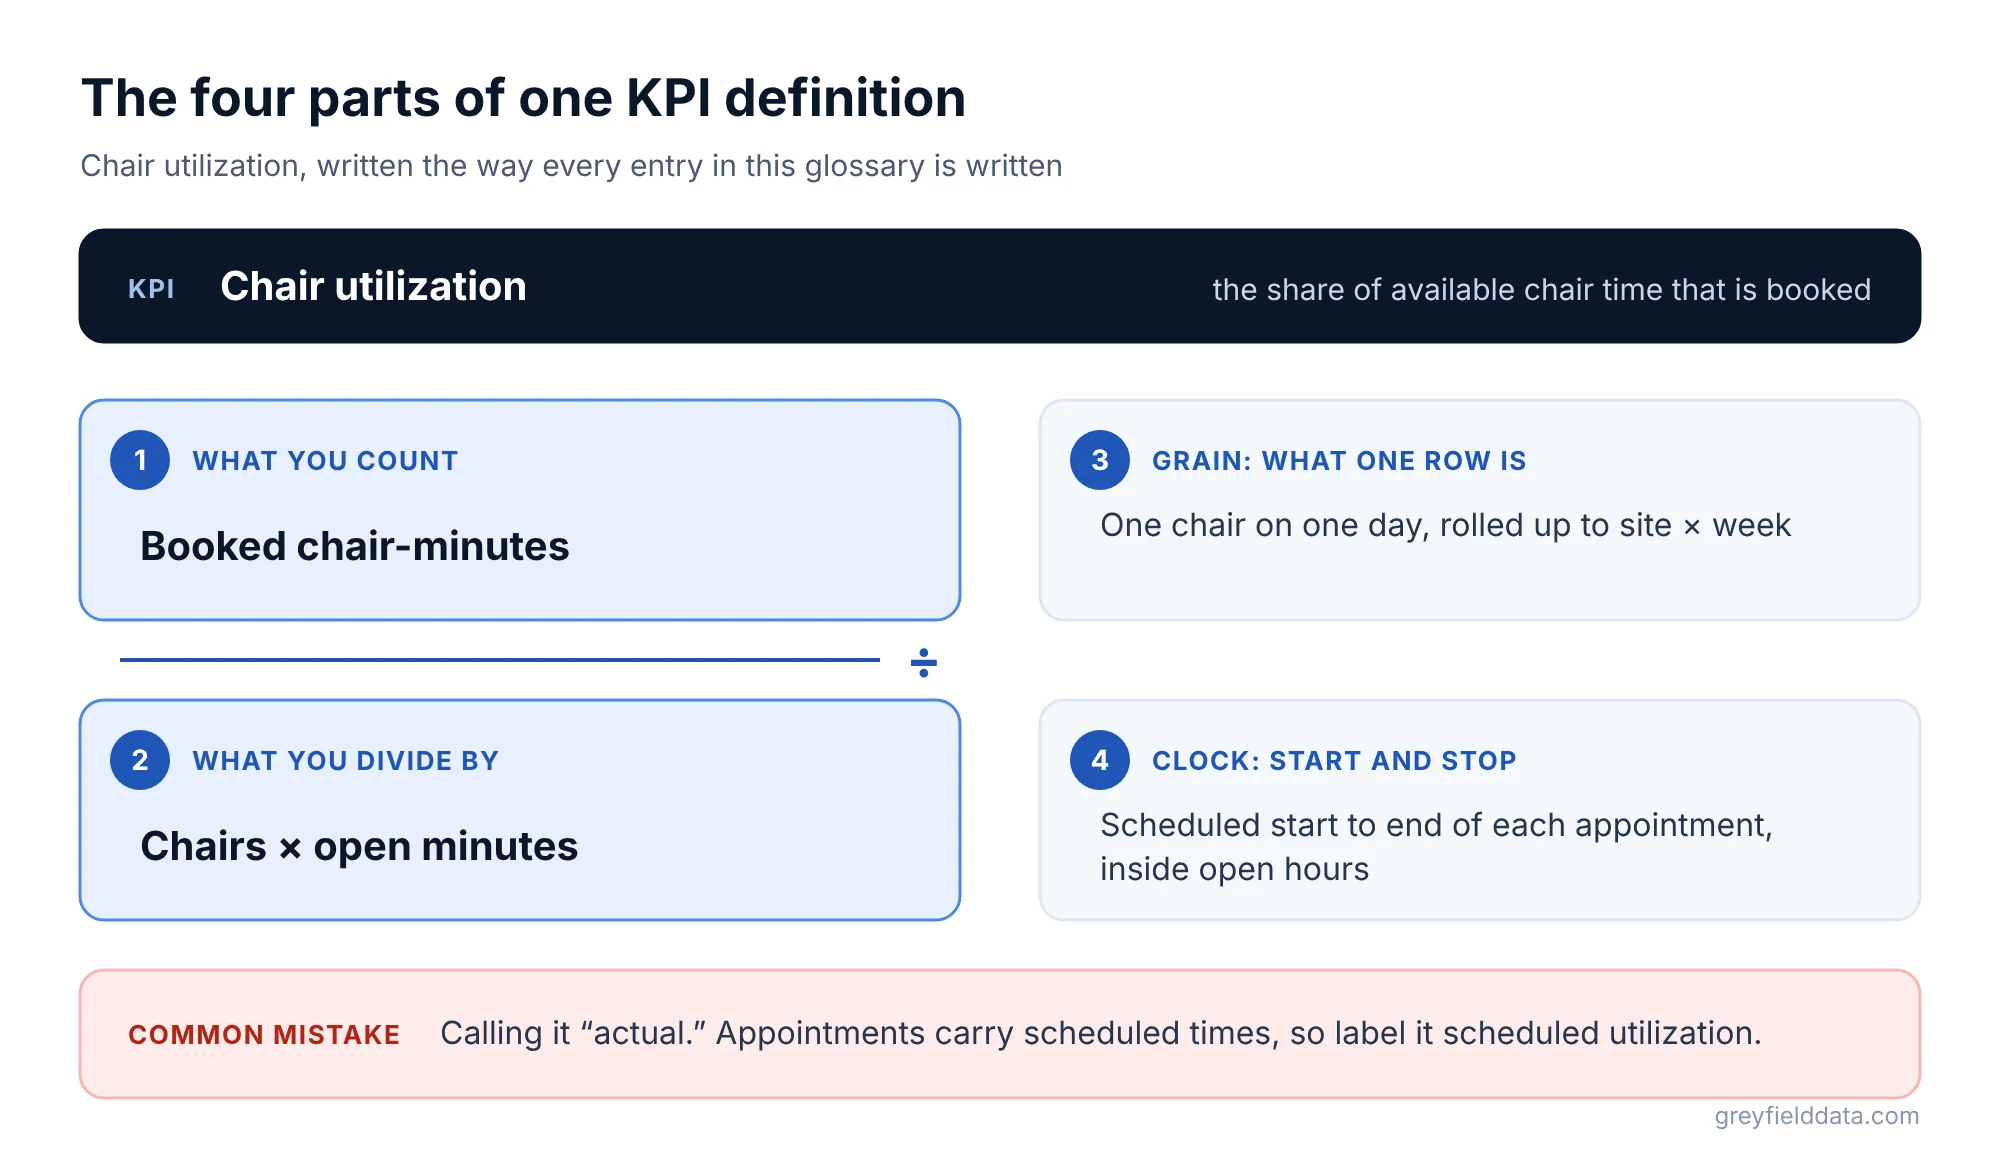
An infusion center KPI is only useful when four things are written down: what you count, what you divide by, the grain of a row, and the clock that starts and stops it. This glossary defines 30 KPIs that way, grouped by capacity, intake, adherence, revenue, inventory, and data-feed health.
I wrote it from building reports and data feeds on WeInfuse's embedded Looker for infusion providers and the companies that serve them, as part of WeInfuse reporting work. To start with one number, the infusion chair utilization calculator works it out from your chairs, hours, and visits.
Key takeaways
- Write every infusion KPI as numerator, denominator, grain, and clock. Two teams using one KPI name with different grains will never agree.
- In WeInfuse the order is the hub and one order has many appointments, so choose the grain (order, appointment, administration, claim line) before you choose a Looker Explore.
- Count a visit only when the appointment is completed and drug was given. A check-in with no drug isn't billable.
- Drug billing units include waste. Sum HCPCS (J-code) units, including JW lines, by code rather than by NDC, on primary insurance only.
- Data-feed health is a KPI group of its own. A successful export run doesn't prove every window loaded or every required field is filled.
How should you read each definition?
Each entry gives a definition, formula, grain (what one row is), clock (the dates that start and stop it), and common mistake.
There are no benchmarks: most published infusion benchmarks are single-center anecdotes, so measure your own baseline first.
What are the 30 infusion center KPIs?
The 30 KPIs fall into six groups: capacity, intake, adherence, revenue, inventory, and data-feed health. The table lists each formula and grain. The infusion center metrics playbook shows which of them to review weekly, monthly, and at board level.
| # | KPI | Formula | Grain |
|---|---|---|---|
| 1 | Chair utilization | Booked chair-minutes ÷ available chair-minutes | Chair × day |
| 2 | Infusions per chair per day | Completed administrations ÷ (chairs × days) | Site × day |
| 3 | No-show rate | No-shows ÷ scheduled appointments | Appointment |
| 4 | Same-day cancellation rate | Cancelled on the day ÷ scheduled appointments | Appointment |
| 5 | Scheduled vs completed | Completed administrations ÷ scheduled appointments | Appointment |
| 6 | Referral-to-first-treatment time | Median days, order to first administration | Order |
| 7 | Referral conversion rate | Orders reaching a first treatment ÷ orders received | Order cohort |
| 8 | Benefits investigation turnaround | Median hours, intake to verified | Order |
| 9 | Prior authorization turnaround | Median days, submitted to decided | Authorization |
| 10 | Prior authorization denial rate | Denied ÷ decided | Authorization |
| 11 | Expiring-auth backlog | Active patients with auth ending soon | Patient × auth |
| 12 | On-schedule dosing rate | Doses in window ÷ doses due | Order series × dose |
| 13 | Persistence | Still on therapy at N months ÷ started | Patient × therapy |
| 14 | Treatments remaining | Approved − received | Order series |
| 15 | Lost-treatment rate | Doses not given ÷ doses due | Order series × dose |
| 16 | Charge lag | Median days, service to claim | Claim |
| 17 | Unbilled completed visits | Administrations with no claim after N days | Administration |
| 18 | Clean claim rate | Accepted first time ÷ submitted | Claim |
| 19 | Initial denial rate | Denied first time ÷ adjudicated | Claim or line |
| 20 | Days in AR | Outstanding AR ÷ average daily charges | Billing entity × month |
| 21 | AR over 90 days | AR over 90 days ÷ total AR | Claim balance |
| 22 | Net collection rate | Payments ÷ (charges − contractual adjustments) | Claim by service month |
| 23 | Drug margin per infusion | (Reimbursement − acquisition cost) ÷ administrations | Administration × J-code |
| 24 | Waste units billed | JW units ÷ total billing units | Claim line × J-code |
| 25 | Days on hand | Inventory at cost ÷ daily drug cost used | Location × NDC × day |
| 26 | Inventory turns | Drug cost used ÷ average inventory | Location × drug × period |
| 27 | Purchase-to-bill reconciliation | Units billed ÷ (bought − rise in on-hand) | Location × drug × month |
| 28 | Feed completeness | Windows reconciled ÷ windows expected | Feed × window |
| 29 | Required-field fill rate | Filled required cells ÷ required cells | Feed × field |
| 30 | Status/dispense reconciliation | Active orders matched in dispense ÷ Active orders | Order vs administration |
Which capacity and scheduling KPIs should you track?
These five show whether empty chairs come from demand, booking, or patients not arriving.
1. Chair utilization
The share of available chair time that is booked.
- Formula: booked chair-minutes ÷ (chairs × open minutes).
- Grain: chair × day, rolled up to site × week.
- Clock: scheduled start to end of each appointment, inside open hours.
- Common mistake: calling it "actual." WeInfuse appointments carry scheduled times and a chair, but I haven't found check-in or check-out timestamps, so label it scheduled utilization.
- Try it: the infusion chair utilization calculator works it out from your chairs, hours, and visits.
2. Infusions per chair per day
Completed administrations each chair supports per operating day.
- Formula: completed administrations ÷ (chairs × operating days).
- Grain: site × day.
- Clock: date of service.
- Common mistake: counting check-ins where no drug was given. They inflate throughput without adding revenue. To see the nurse hours a given visit count needs, try the infusion staffing planner.
3. No-show rate
Patients who didn't arrive and didn't cancel.
- Formula: no-shows ÷ appointments scheduled for the day.
- Grain: appointment.
- Clock: appointment date.
- Common mistake: lumping no-shows with same-day and advance cancellations. Each has a different fix.
- Try it: the infusion no-show cost calculator turns the rate into lost revenue.
4. Same-day cancellation rate
Appointments cancelled on the day they were due.
- Formula: cancelled on the date of service ÷ appointments scheduled for that date.
- Grain: appointment.
- Clock: cancellation date against appointment date.
- Common mistake: reading a cancellation as the end of therapy. A cancelled appointment under an active order doesn't mean the order is discontinued.
5. Scheduled vs completed
The share of scheduled visits that end with drug given.
- Formula: completed administrations ÷ appointments scheduled.
- Grain: appointment.
- Clock: appointment date.
- Common mistake: counting a rescheduled visit twice in the denominator, in its old slot and its new one.
Which intake and access KPIs show where referrals stall?
These six measure the front end, where the patient waits and the center isn't paid yet.
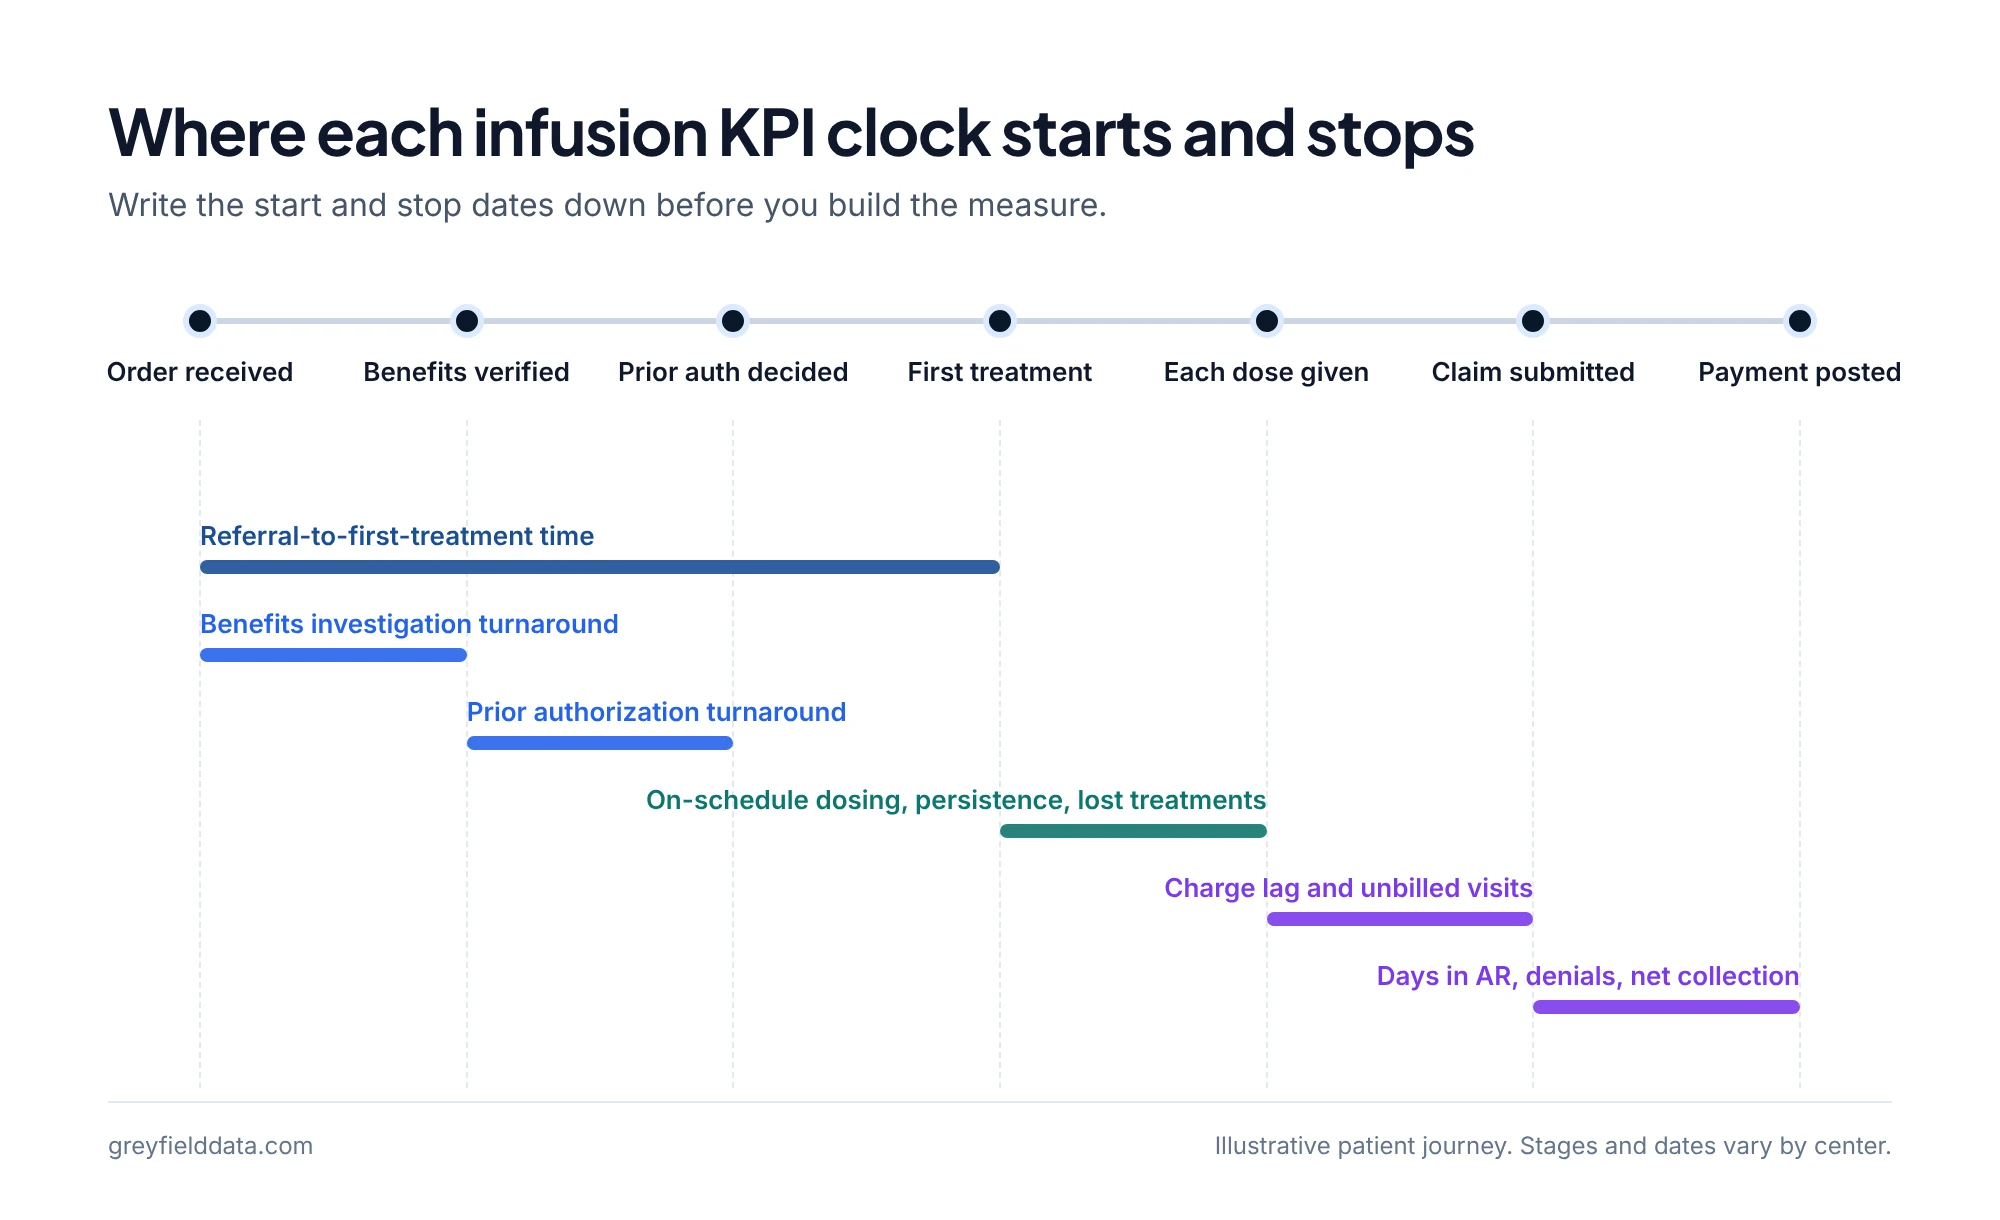
6. Referral-to-first-treatment time
How long a new order waits for its first infusion.
- Formula: median and 90th percentile days from order received to first completed administration.
- Grain: order.
- Clock: order received to first administration, split into benefits investigation, prior authorization, scheduling, and drug-ready stages.
- Common mistake: reporting the average. A few stuck orders drag a mean around. The referral to first treatment guide shows the stage-by-stage version.
7. Referral conversion rate
The share of orders that become a first treatment.
- Formula: orders reaching a first treatment ÷ orders received, by month received.
- Grain: order cohort.
- Clock: order received date, with a fixed follow-up window.
- Common mistake: dividing this month's first treatments by this month's orders. Use cohorts and record loss reasons. The referral leakage calculator estimates what lost referrals cost.
8. Benefits investigation turnaround
Time to confirm coverage and patient cost.
- Formula: median hours from intake complete to verification complete.
- Grain: order.
- Clock: intake complete to verified.
- Common mistake: starting the clock when someone opens the task, not when the order arrived.
9. Prior authorization turnaround
Time from submission to the payer's decision.
- Formula: median days from submitted to approved or denied.
- Grain: authorization.
- Clock: submitted date to decision date.
- Common mistake: computing it from warehouse change history. A pipeline that polls the source stamps a change when it noticed it, not when the payer decided.
10. Prior authorization denial rate
The share of decided authorizations that were denied.
- Formula: denied ÷ decided.
- Grain: authorization.
- Clock: decision date.
- Common mistake: putting pending requests in the denominator. A pending placeholder isn't a decision. The prior authorization denials by payer guide breaks the rate down by payer.
11. Expiring-auth backlog
Active patients about to lose authorization.
- Formula: count of active patients whose authorization ends within 7, 14, or 30 days with no renewal started.
- Grain: patient × authorization.
- Clock: today against the authorization end date.
- Common mistake: watching dates only. An authorization can run out of approved visits or units first. See the expiring authorizations report for WeInfuse.
Which clinical and adherence KPIs should an infusion center report?
A missed or early dose is both a clinical gap and a billing risk.
12. On-schedule dosing rate
Doses given inside the allowed window.
- Formula: doses given in window ÷ doses due.
- Grain: order series × dose.
- Clock: previous dose plus the ordered interval, with a window your clinical team sets.
- Common mistake: treating early doses as on time. A dose before the allowed interval can be denied, so count it as off schedule.
13. Persistence
Patients who stay on therapy.
- Formula: patients still on therapy N months after first treatment ÷ patients who started in that cohort.
- Grain: patient × therapy, by start month.
- Clock: first administration date, with "still on therapy" defined as no gap longer than a stated multiple of the dosing interval.
- Common mistake: counting a patient who switched drug or site of care as lost without a reason code.
14. Treatments remaining
Approved treatments not yet given on an order.
- Formula: treatments approved − treatments received on the order series.
- Grain: order series.
- Clock: as of the report date.
- Common mistake: reading it as refills, vials, or a patient-wide total. Medication supply and inventory used are separate facts.
15. Lost-treatment rate
Doses that were due and never given.
- Formula: doses not given by the time the window closed ÷ doses due.
- Grain: order series × dose.
- Clock: due date plus the allowed window.
- Common mistake: counting every no-show as lost. A no-show rebooked inside the window isn't lost.
Which revenue cycle KPIs matter for buy-and-bill?
Several of these nine need remittance or practice-management data that often lives outside the infusion EHR.
16. Charge lag
How long a completed visit waits for a claim.
- Formula: median days from date of service to claim submitted.
- Grain: claim.
- Clock: date of service to submission.
- Common mistake: measuring only submitted claims. The slowest visits have no claim yet; track them as KPI 17.
17. Unbilled completed visits
Administrations that should have a claim and don't.
- Formula: count and estimated value of completed administrations with no claim after N days.
- Grain: administration.
- Clock: date of service to today.
- Common mistake: filtering on expected payment above zero. Specialty-pharmacy visits have no expected drug payment, so they silently drop out. The infusion revenue leakage calculator prices this gap alongside the others.
18. Clean claim rate
Claims that go through on the first try.
- Formula: claims accepted on first submission with no rejections ÷ claims submitted.
- Grain: claim.
- Clock: submission to acceptance.
- Common mistake: counting a corrected resubmission as a new clean claim. Keep the original claim ID and a submission count.
19. Initial denial rate
Claims denied the first time a payer adjudicates them.
- Formula: claims (or dollars) denied on first adjudication ÷ claims adjudicated, by reason code, payer, drug, and site.
- Grain: claim, or claim line for drug denials.
- Clock: remittance date.
- Common mistake: using final status. Appeals turn some denials into payments. The infusion denial analysis guide shows how to group rejected claims by root cause.
20. Days in AR
Days of charges waiting to be collected.
- Formula: outstanding AR ÷ average daily charges over the last 90 days. Some teams divide by net revenue; pick one and write it down.
- Grain: billing entity × month-end.
- Clock: month-end snapshot.
- Common mistake: missing a billing-entity change. A new entity can make each site appear twice, so map old and new sites together. The multi-site KPI rollup guide covers this.
21. AR over 90 days
The share of AR that is getting old.
- Formula: AR older than 90 days ÷ total AR.
- Grain: claim balance at a snapshot.
- Clock: date of service to snapshot.
- Common mistake: aging from the last resubmission, which resets the clock.
22. Net collection rate
How much of what you were owed you collected.
- Formula: payments ÷ (charges − contractual adjustments).
- Grain: claim, grouped by month of service.
- Clock: month of service, measured after a fixed collection lag.
- Common mistake: dividing this month's payments by this month's charges, or booking timely-filing write-offs as contractual adjustments. See charges, claims, expected payment and collections for how the four numbers differ.
23. Drug margin per infusion
What the drug earns per administered visit.
- Formula: (drug reimbursement − net acquisition cost) ÷ administrations, also as a percent of cost.
- Grain: administration × primary drug (J-code).
- Clock: date of service.
- Common mistake: treating expected reimbursement as collected. In WeInfuse, contract values appear only once a claim is generated, so margin vanishes from reporting if billing moves elsewhere. For a stable yardstick, some teams price billing units at the public CMS ASP file. The buy-and-bill margin calculator does this for one drug.
24. Waste units billed
The share of billed drug units that were discarded.
- Formula: JW-modifier units ÷ total billing units, per drug.
- Grain: claim line × HCPCS code.
- Clock: date of service.
- Common mistake: grouping by NDC. One drug in two vial sizes has two NDCs and two rows per visit. Sum billing units by HCPCS code and keep JW lines. The JW and JZ modifier guide explains the rules. Medicare requires JW for discarded amounts and JZ when nothing was discarded from a single-dose container (CMS FAQ).
Which inventory KPIs catch drug losses?
Drug is usually the largest cost line, so a small gap between bought and billed matters.
25. Days on hand
Days of drug sitting on the shelf.
- Formula: inventory at cost ÷ average daily cost of drug used.
- Grain: location × NDC × snapshot date.
- Clock: daily snapshot.
- Common mistake: keeping lot number in the grain, which splits one product into many rows.
26. Inventory turns
How often inventory is used and replaced.
- Formula: cost of drug used in the period ÷ average inventory at cost.
- Grain: location × drug × period.
- Clock: month or year.
- Common mistake: including specialty-pharmacy doses in drug cost. You didn't buy them.
27. Purchase-to-bill reconciliation
Whether what you bought matches what you billed.
- Formula: units billed ÷ (units purchased − increase in on-hand), per drug.
- Grain: location × drug × month.
- Clock: calendar month.
- Common mistake: comparing invoice NDC units to HCPCS billing units without converting. They are rarely the same size. The infusion drug inventory shrink guide has a worked example.
How do you measure data-feed health?
If you send data to a manufacturer, hub, or CRM, these three numbers tell you whether it's safe to send.
28. Feed completeness
Whether every expected window of data arrived.
- Formula: extraction windows loaded and reconciled ÷ windows expected, with row counts per window.
- Grain: feed × window.
- Clock: window start and end dates.
- Common mistake: treating a successful run as complete. A failed batch can be skipped while the checkpoint moves on, and failed Looker schedules don't retry. Plan a periodic full reload, as the full file vs changes-only guide explains.
29. Required-field fill rate
How many required fields are actually filled.
- Formula: filled required cells ÷ (rows × required fields), per field.
- Grain: feed × field × delivery.
- Clock: each delivery.
- Common mistake: filling blanks with guesses. Keep source nulls and fix them upstream.
30. Status/dispense reconciliation
Whether the status feed and the administration feed agree.
- Formula: Active orders found in dispense with a matching latest dispense date ÷ Active orders. Pending or denied orders in dispense should be zero.
- Grain: order for status, administration for dispense.
- Clock: the delivery window.
- Common mistake: expecting row counts to match. And reconciling two feeds doesn't prove either one meets the contract. The infusion data feeds white paper covers the contract side.
How do you pick the right grain in WeInfuse?
Decide the business grain first, then pick the Looker model whose base table matches it.
The orders model includes orders with no appointment yet, and the appointments model doesn't. The WeInfuse reporting guide covers models and fan-out in detail. Three rules from building these reports:
- Join patients on the user-facing patient identifier, not an internal row ID. Duplicate patient rows can share one identifier.
- Say "ordering provider" (on the order) or "rendering provider" (on the appointment), never just "provider."
- Keep primary insurance only when summing drug units, or secondary claims double them.
WeInfuse is a trademark of its owner. Greyfield Data is independent and not affiliated with WeInfuse.
What to do next
Write down the five KPIs your team argues about most in this format before anyone builds a dashboard.
Start with the chair utilization calculator, then read the WeInfuse reporting guide and the 12 weekly infusion reports built on these definitions. If you want help defining these in WeInfuse's Looker or building a feed you can trust, book a call with me.
Frequently asked questions
What is a good chair utilization rate for an infusion center?
It depends on your infusion lengths, staffing, and hours. Measure your own scheduled utilization for a quarter, then set the target.
How do you calculate referral-to-treatment time?
Count the days from order received to first completed administration for each order, then report the median and 90th percentile. Split it into stages to see where orders wait.
Do billed drug units include waste?
Yes. Discarded drug from a single-dose container is billed on its own line with the JW modifier. Sum billing units by HCPCS code, including JW lines.
Can I get days in AR and denial rate from WeInfuse?
Only if claims are generated in WeInfuse's claims module. If billing runs elsewhere, join that system's data to WeInfuse.
What is the difference between a status feed and a dispense feed?
A status feed reports where each order stands, such as active, pending, or denied. A dispense feed reports each completed administration, so it has more rows, and only active orders should appear in it.
Part of the Infusion analytics guides, a reading path through related articles.
Linus Tse
Founder of Greyfield Data. Built 400+ dashboards. Certified in Sigma, Snowflake, Tableau, and Power BI.
About Linus