9 places referrals stall before the first infusion, and how to measure each
Nine points where infusion referrals stall between order and first dose, with the clock to measure at each, so you can cut time from referral to first infusion.

Written by Linus Tse, founder of Greyfield Data
· 11 min read
On this page 16 sections
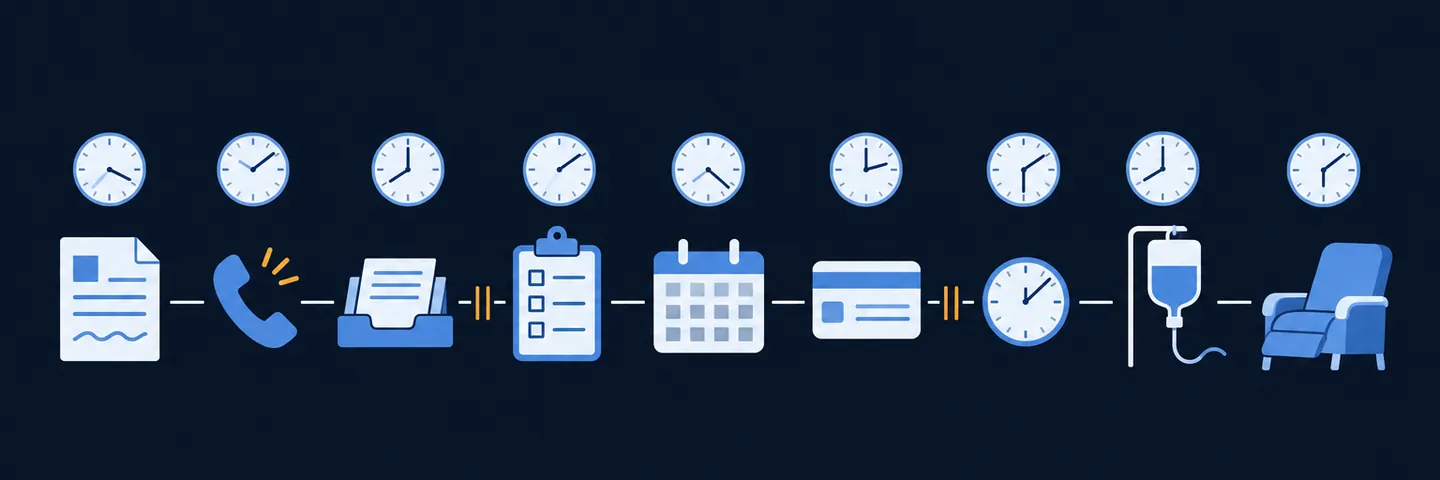
Referrals stall at handoffs. An incomplete order waits for records, a benefits check waits for a call back, and an authorization waits for a payer. A patient waits for a call, or the drug waits on a specialty pharmacy. To reduce the time from referral to first infusion, put a start and stop timestamp on each of those handoffs and measure the time between them, so you can see which one is slow.
I build intake reporting for ambulatory infusion centers that follows each order from receipt to first completed administration, as part of my WeInfuse reporting service. To see how many referrals and treatments you lose before the first dose, try the referral leakage calculator.
Key takeaways
- Measure referral-to-first-treatment from order received to first completed administration, as a median and a 90th percentile, for a cohort of orders received in the same week or month.
- Split the total into stages with their own clocks. A single total tells you there is a delay, not where it is.
- Stage medians don't add up to the total median. Report each stage on its own and the total separately.
- Count referrals that never convert, by reason. A center can have a fast median and still lose a large share of referrals.
- Build the report from orders, not appointments. Orders with no appointment are the ones that are stuck.
How do you measure referral-to-first-treatment time?
Measure it per order: the date the order was received to the date of the first completed administration. Group orders into cohorts by the week or month they arrived, and report the median and the 90th percentile in days. The infusion center KPI glossary has the full definition and the referral conversion rate that goes with it.
Two rules keep the number honest:
- Use event dates, not snapshot dates. If your data only stores the current status of an order, you can't reconstruct when it moved between stages. You need a timestamp for each stage change, or a history table that records them.
- Keep open orders in the cohort. If you only measure orders that reached treatment, slow and lost referrals drop out and the median looks better than it is.
Where do infusion referrals stall before the first dose?
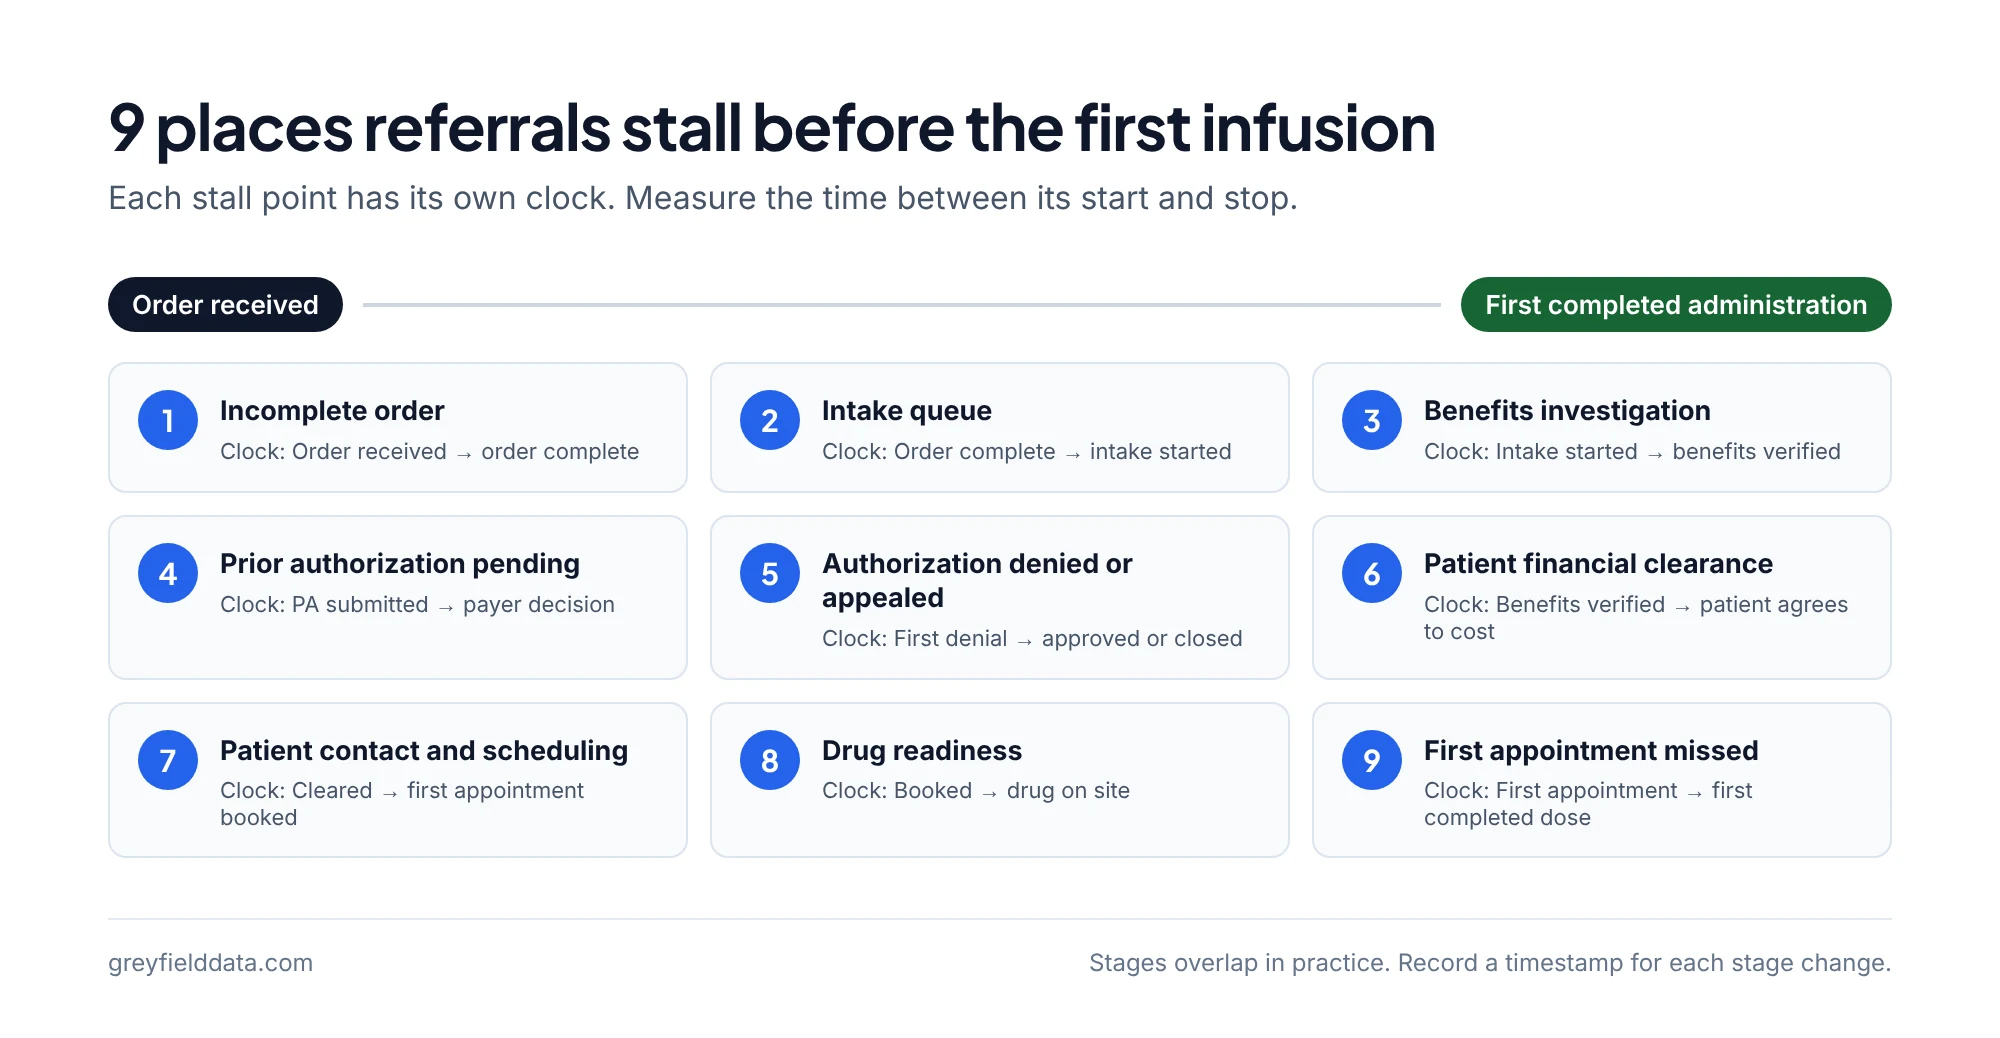
Referrals stall at nine points between order received and first completed administration. Each has its own clock start, clock stop, and metric.
| # | Stall point | Clock starts | Clock stops | Metric |
|---|---|---|---|---|
| 1 | Incomplete order | Order received | Order complete | Days to complete; % complete on arrival |
| 2 | Intake queue | Order complete | Intake started | Days waiting; queue size by age |
| 3 | Benefits investigation | Intake started | Benefits verified | Hours to verified |
| 4 | Prior authorization pending | PA submitted | Payer decision | Days to decision, by payer |
| 5 | Authorization denied or appealed | First denial | Final approval or close | Days to resolve; share closed lost |
| 6 | Patient financial clearance | Benefits verified | Patient agrees to cost | Days to clearance; share lost to cost |
| 7 | Patient contact and scheduling | Cleared to schedule | First appointment booked | Days to book; contact attempts |
| 8 | Drug readiness | Appointment booked | Drug on site | Share of first visits with drug ready |
| 9 | First appointment missed | First appointment date | First completed administration | Share of first visits completed |
1. Why do incomplete orders slow down the first infusion?
An incomplete order sends intake back to the referring office before any other work can start. It arrives without everything intake needs: a diagnosis code, clinical notes, labs the payer will ask for, insurance details, or a signature.
- How to measure: days from order received to order complete, and the share of orders complete on arrival, by referring practice.
- What it shows: which referring offices send incomplete orders. That is a conversation with those offices, or a better order form, not more intake staff.
2. How long do complete orders wait in the intake queue?
A complete order can sit in a queue before anyone starts work on it. This stall is invisible unless you record when intake starts.
- How to measure: days from order complete to intake started, and the count of orders waiting by age (0 to 2 days, 3 to 5, 6 or more).
- What it shows: whether the queue is a staffing problem (it grows every week) or a prioritization problem (some orders wait while newer ones move).
3. How long does benefits investigation take, and which payers slow it?
Benefits investigation (BI) time depends on the payer, so measure it by payer. It confirms coverage, network status, patient cost share, and whether prior authorization is required.
- How to measure: hours from intake started to benefits verified, by payer.
- What it shows: which payers take longest to verify. Use it to staff for the payers that need phone calls rather than portal checks.
4. How long do prior authorization decisions take?
Prior authorization (PA) decision time varies by payer and drug, so measure it for each pair. This stall starts when the request goes to the payer and ends with a decision.
- How to measure: days from PA submitted to decision, by payer and drug, as a median and a 90th percentile.
- What it shows: whether a delay is in your submission (time from benefits verified to PA submitted) or with the payer (time from submitted to decision). Measure both. CMS's interoperability and prior authorization final rule sets 72-hour and 7-day decision timeframes for some payers starting in 2026, but CMS says the rule "does not apply to prior authorization decisions for drugs." Don't assume it shortens drug authorizations. The prior authorization denials by payer guide shows how to compare payers.
5. How do authorization denials and appeals delay treatment?
A denied or appealed authorization adds a second wait, and some of those referrals end with no treatment. The payer refuses the request, asks for more information, requires a peer-to-peer review, or requires another drug first (step therapy).
- How to measure: days from first denial to final approval or closure, and the share of denied requests that end with no treatment.
- What it shows: which payer and drug combinations need a different first submission. If the same denial reason keeps coming back, change what you send the first time.
6. Why do patients stall at financial clearance?
Patients stall here when the cost to them is still unresolved. Benefits are verified, but the patient hasn't agreed to their share of the cost, or is waiting on copay assistance or a foundation grant. The copay accumulator guide explains why assistance can run out mid-year.
- How to measure: days from benefits verified to financial clearance, and the share of referrals lost to cost.
- What it shows: whether financial counseling and assistance enrollment happen in parallel with authorization or only after it. Running them in parallel takes days off the total.
7. Is the delay reaching the patient or finding a chair?
Measure both, because either can hold up a cleared patient. The patient is cleared, but nobody has reached them, they haven't called back, or the first available chair is weeks away.
- How to measure: days from cleared to schedule to first appointment booked, the number of contact attempts, and days from booking to the appointment date.
- What it shows: whether the delay is reaching the patient or finding a chair. If chairs are the constraint, the chair utilization calculator shows how much capacity you have by hour.
8. How often is the drug not ready for the first visit?
Count it directly: the share of first visits where the drug was not on site in time. The appointment is booked, but the drug isn't there: a buy-and-bill order hasn't arrived, or a specialty pharmacy shipment (white bagging) is late.
- How to measure: the share of first visits where the drug was on site at least one or two days before the appointment, and the count of first visits rescheduled because the drug wasn't ready.
- What it shows: whether specialty pharmacy coordination is a hidden cause of rescheduled first visits. The white bagging revenue guide covers the cost side.
9. How many first appointments end without a treatment?
Track the share of first appointments that end in a completed administration. Sometimes the appointment is booked but the patient doesn't come, cancels, or can't be treated that day because a pre-treatment requirement on the order isn't met.
- How to measure: the share of first appointments that end in a completed administration, and days from the first booked date to the first completed administration.
- What it shows: whether reminders, pre-visit calls, or pre-treatment checks need to start earlier. First visits are often longer and more anxious than later ones. The no-show cost calculator puts a value on each missed chair.
How do the stages add up?
Not neatly: stage medians don't add up to the total median.
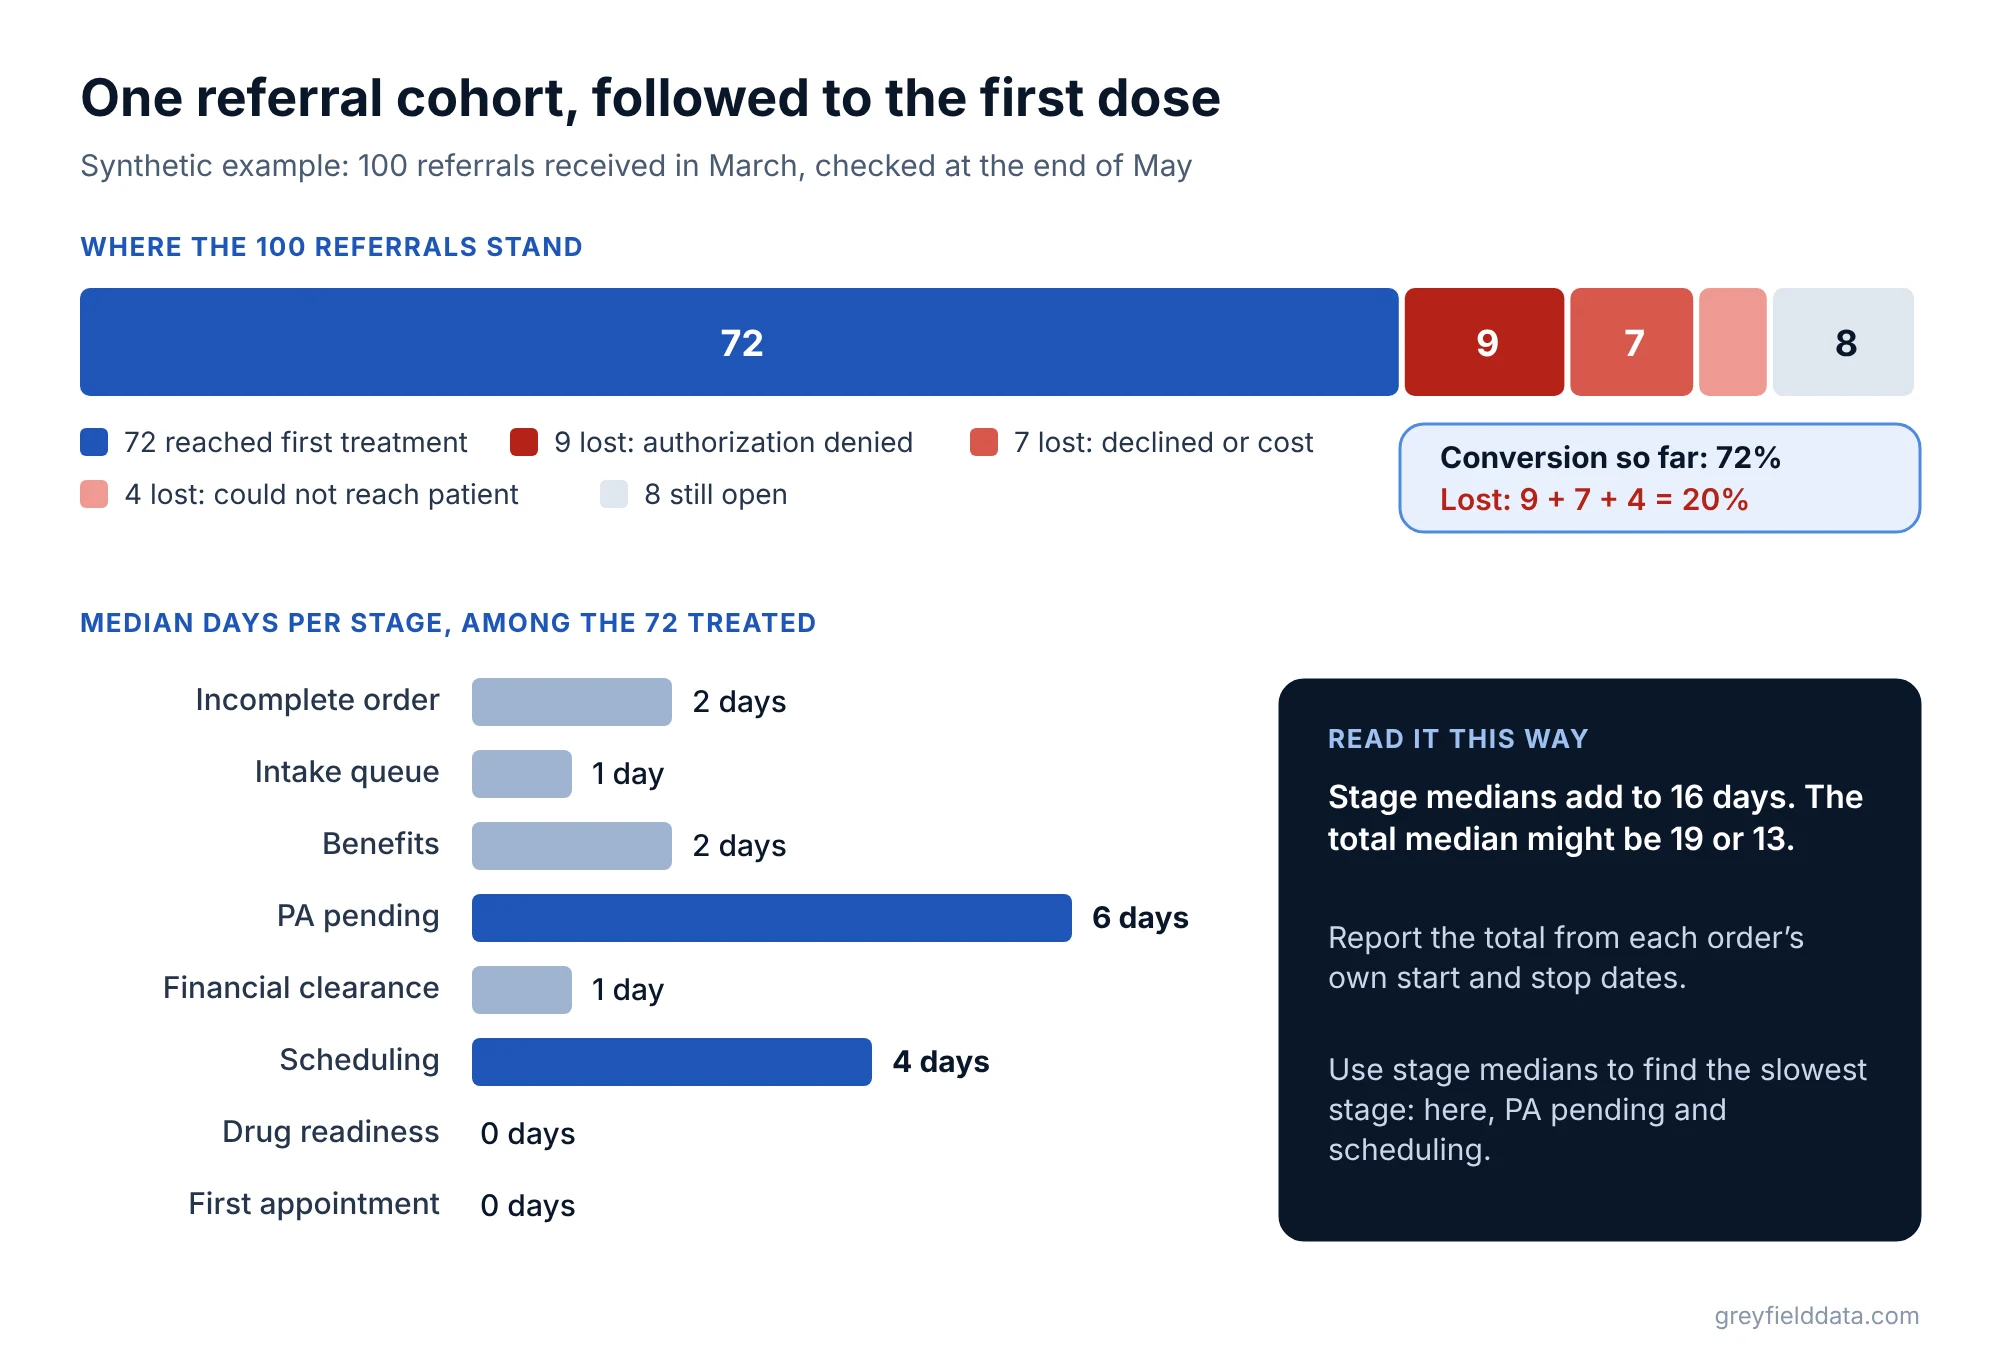
Synthetic example. A center receives 100 referrals in March. By the end of May:
| Outcome | Referrals |
|---|---|
| Reached first completed administration | 72 |
| Lost: authorization denied, not resolved | 9 |
| Lost: patient declined or cost | 7 |
| Lost: could not reach patient | 4 |
| Still open | 8 |
| Total | 100 |
Referral conversion so far is 72 ÷ 100 = 72%. Lost referrals are 9 + 7 + 4 = 20, or 20%. Eight are still open, so the cohort isn't finished; report it again next month.
Now suppose these are the median days for each stage among the 72 who were treated:
| Stage | Median days |
|---|---|
| Incomplete order | 2 |
| Intake queue | 1 |
| Benefits | 2 |
| PA pending | 6 |
| Financial clearance | 1 |
| Scheduling | 4 |
| Drug readiness | 0 |
| First appointment | 0 |
Those add to 16. The median total time for the same 72 patients might still be 19 days or 13 days. That's because the patient with the median PA time is rarely the patient with the median scheduling time.
Report the total median from each order's own start and stop dates. Use the stage medians only to see which stage is slowest. In this example, PA pending (6 days) and scheduling (4 days) are where to look first.
What data do you need to measure referral-to-first-treatment time?
You need a timestamp for each stage change on each order:
- Orders: received date, complete date, referring provider, drug, and payer.
- Workflow tasks or statuses: intake started, benefits verified, PA submitted, PA decided, financially cleared, with the date each was reached.
- Authorizations: submitted, decided, approved or denied, start and end dates.
- Appointments and administrations: booked date, appointment date, status, and completed administration date.
The common gap is history. Many systems store the current status of a task but overwrite the date it changed. If that is true for you, start recording stage changes now, even in a simple log; you can't measure a clock you never started.
In WeInfuse, the orders model includes orders with no appointment yet, while the appointments model doesn't. The orders vs appointments guide shows the difference, and the WeInfuse reporting guide explains which to use. To catch stuck orders every week, add the "order with no appointment" list from the red flag reports guide.
WeInfuse is a trademark of its owner. Greyfield Data is independent and not affiliated with WeInfuse.
What to do next
Put a number on the front of your funnel with the referral leakage calculator. Then build the referral pipeline report described in the 12 weekly reports guide.
Once the stall points are visible, the next question is usually what happens after the first dose: where infusion centers lose revenue between order and deposit follows the same order through billing. The infusion center metrics white paper defines the intake measures in one place. If you want help timestamping your intake stages and building the pipeline report on your data, book a call with me.
Frequently asked questions
How do I reduce the time from referral to first infusion?
Measure each stage separately, find the one with the longest median and 90th percentile, and fix that one first. Common fixes are better order forms, running financial counseling in parallel with authorization, and starting patient contact as soon as benefits are verified.
What is a good referral-to-treatment time for an infusion center?
It depends on your payer mix and drugs, because authorization times vary widely. I don't know of a reliable public benchmark, so measure your own median and 90th percentile by cohort and track the trend.
How many referrals are we losing before treatment starts?
Divide referrals that reached a first completed administration by all referrals received in the same cohort, and count the rest by loss reason. The referral leakage calculator gives a quick estimate.
What is causing bottlenecks in our infusion intake process?
The stage with the longest wait is the bottleneck. Without stage timestamps you can only guess, so start by recording when each order enters and leaves intake, benefits, authorization, and scheduling.
Does the CMS prior authorization rule apply to infusion drugs?
CMS says the 2024 interoperability and prior authorization final rule does not apply to prior authorization decisions for drugs. Check each payer's own policy for drug authorization timelines.
Part of the Infusion analytics guides, a reading path through related articles.
Linus Tse
Founder of Greyfield Data. Built 400+ dashboards. Certified in Sigma, Snowflake, Tableau, and Power BI.
About Linus