Where infusion centers lose revenue between order and deposit
Infusion revenue leaks at ten handoffs from order to bank deposit. Here is what to measure at each stage, the grain to count at, and a worked synthetic example.

Written by Linus Tse, founder of Greyfield Data
· 14 min read
On this page 11 sections
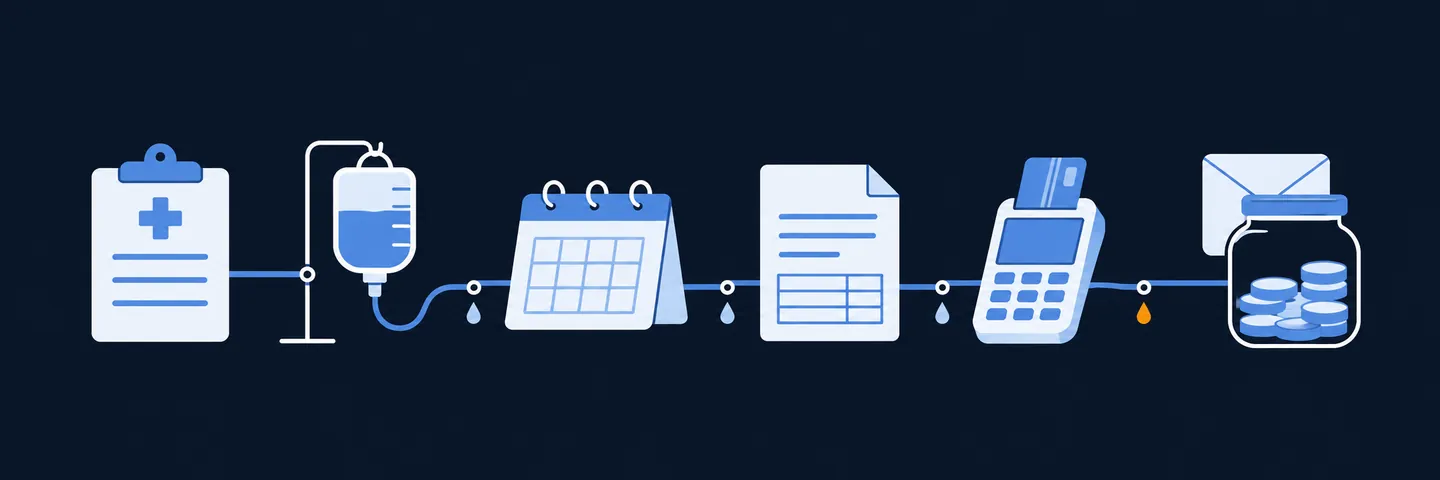
Infusion revenue leaks at handoffs: from intake to benefits, from the chair to the chart, from the chart to the claim, and from the remit to the bank. Most of it doesn't show up as one big loss. It shows up as small misses:
- a dose given without a valid authorization
- a waste line nobody billed
- a denial that sat past its appeal window
- a payment that was posted but never matched to a deposit
I build reporting for ambulatory infusion centers that follows each order through those handoffs. A leak then shows up as a number on a weekly list instead of a surprise at month end. To size the total, try the infusion revenue leakage calculator. If you want a first estimate of how many referrals you lose before treatment even starts, try the referral leakage calculator.
Key takeaways
- Infusion revenue leakage is the gap between the value of the drug and services you delivered and the cash that reached your bank. Measure it at every handoff, not just at the end.
- Ten stages matter: order, intake and benefits investigation, prior authorization, scheduling, administration and documentation, charge capture, claim submission, denial handling, payment posting, and deposit reconciliation.
- Each stage needs its own grain. Orders, appointments, administrations, claim lines, and deposits are different rows, and mixing them double counts.
- Small losses compound. If three stages each keep 99% of value, you keep 0.99 × 0.99 × 0.99 = 97.0%, a 3% leak with no single stage looking broken.
- Billed charges and expected reimbursement are not collected revenue. Only a payment matched to a deposit closes the loop.
Quick answers
- Where it leaks: ten handoffs, from order received to bank deposit.
- Build first: completed visits not yet billed, authorizations expiring in 30 days, and denied dollars by reason and payer.
- Review weekly: unbilled visits, expiring authorizations, and open denials.
- Review monthly: underpayments, deposit reconciliation, and purchased versus billed vials.
- Hardest to see: orders that never become appointments, and underpayments hidden in contractual adjustments.
What is infusion revenue leakage?
Infusion revenue leakage is revenue you earned, or should have earned, that never arrives as cash.
In a buy-and-bill center it has a sharper edge than in most practices, because you have already paid for the drug. A lost claim costs you the acquisition cost of the drug as well as the margin. The buy-and-bill margin calculator shows both for a single drug.
It helps to separate three kinds of loss:
- Lost before treatment. A referral never converts, so there is no visit to bill. This is lost opportunity, not lost cash, but it is often the largest number.
- Lost between treatment and claim. The visit happened, the drug was used, but a charge, a unit, or a waste line never made it onto a claim.
- Lost after the claim. The claim was denied and not worked, paid below contract, written off past a filing limit, or paid but never reconciled to the bank.
This post covers all three, in the order a patient moves through the center.
What are the stages from order to deposit?
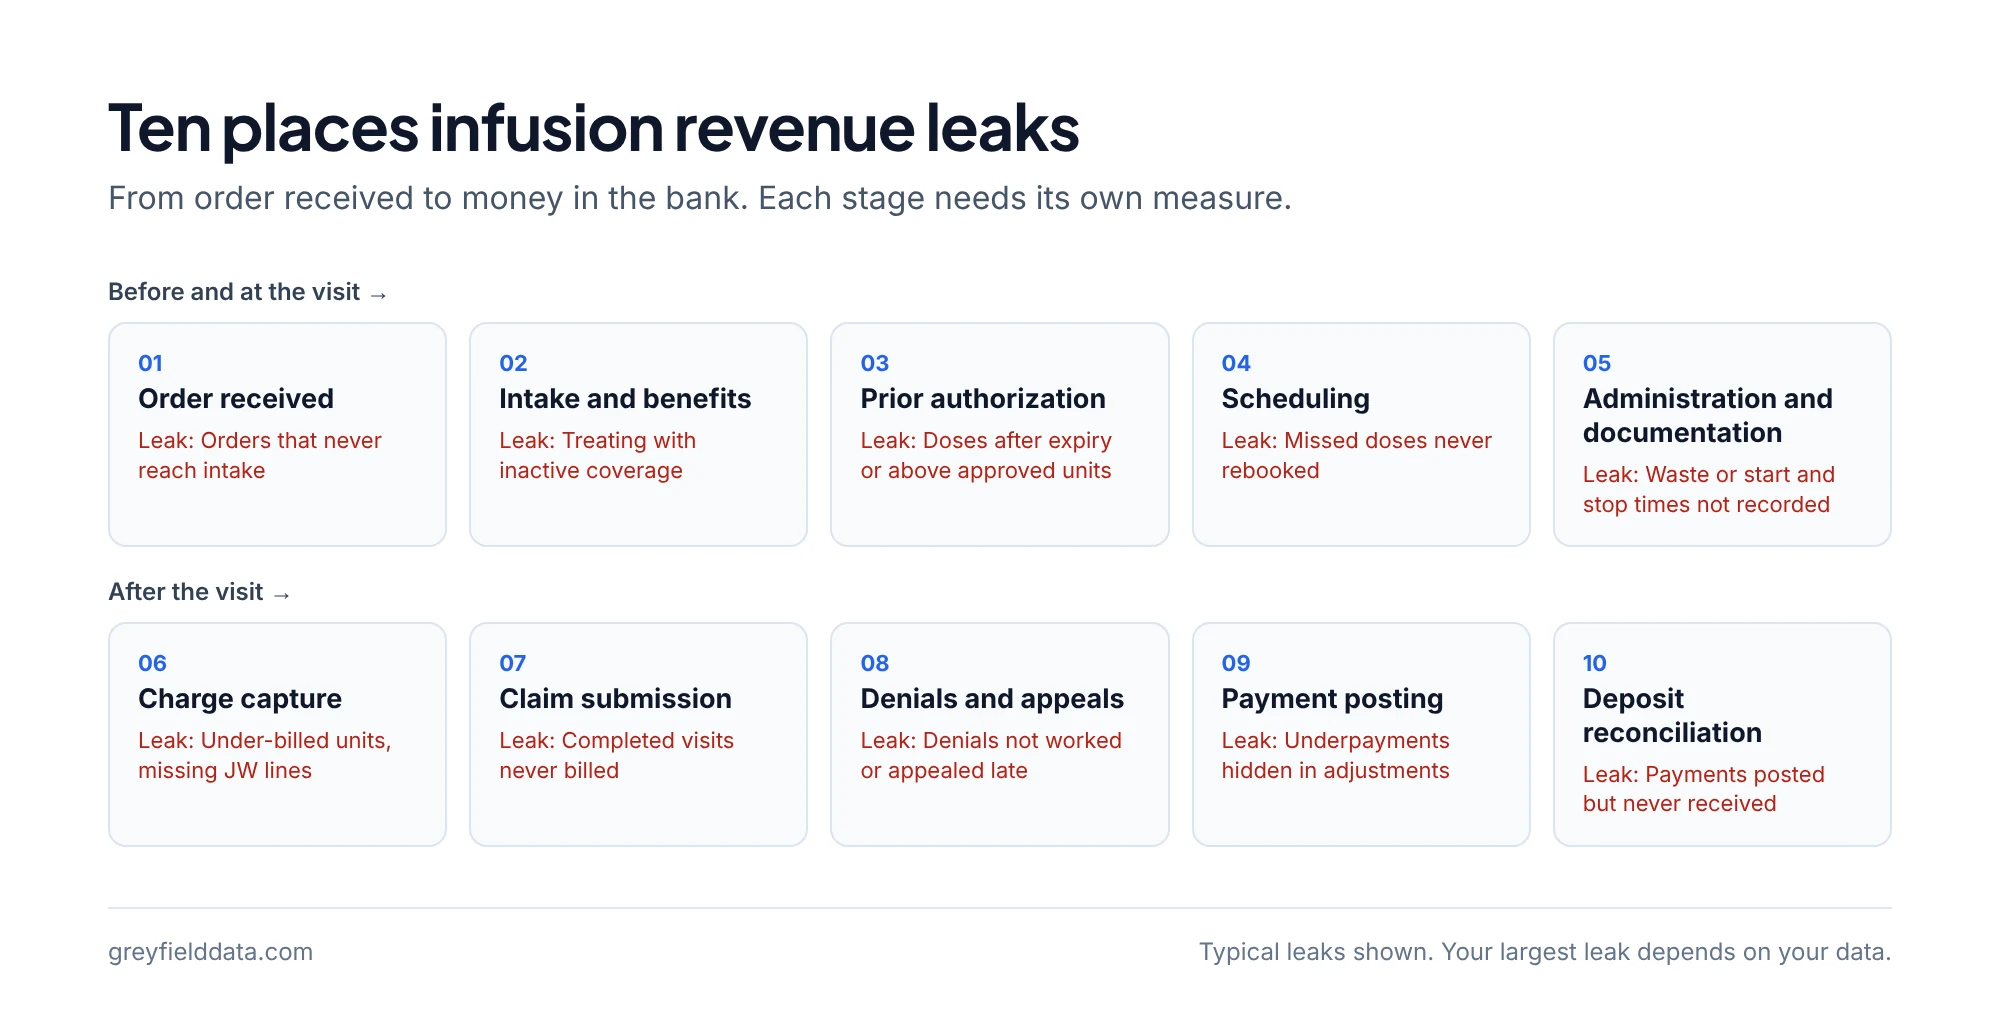
There are ten stages where value can drop out. The diagram shows the path and the typical leak at each.
1. Order received
The order (referral) is where the patient, drug, dose, frequency, diagnosis, and prescriber first appear. A missing diagnosis code or an unsigned order doesn't lose money directly, but it starts the clock on every delay that follows.
- Measure: orders received per week, and the share that are complete on arrival.
- Grain: one row per order.
- Leak to watch: orders that never move to intake. They are invisible on any report that starts from appointments.
2. Intake and benefits investigation
Benefits investigation (BI) confirms that the patient has active coverage, whether the center is in network, what the patient will owe, and whether the payer needs prior authorization.
- Measure: median hours from order received to BI complete, and the share of orders where coverage was re-checked before the first visit.
- Grain: one row per order (or per order and payer, if you verify secondary coverage separately).
- Leak to watch: treating with inactive coverage. That is a whole-claim loss, drug included.
3. Prior authorization
Prior authorization (PA) is the payer's advance approval for the drug, the units, and often the site of care for a date range.
- Measure: days from PA submitted to decision, approval rate, and the count of active patients whose authorization expires in the next 14 and 30 days.
- Grain: one row per authorization. An order can have several over its life.
- Leak to watch: doses given after an authorization expired, or units given above the approved quantity. The expiring authorizations report guide shows how to catch them before the visit. Both tend to come back as authorization denials (for example, CARC 197 or 198 on the X12 claim adjustment reason code list).
4. Scheduling
Scheduling turns an approved order into chair time. Doses must fall inside the dosing interval on the order and inside the authorization window.
- Measure: days from authorization approved to first scheduled visit, no-show and same-day cancellation rates, and patients due for a dose with nothing on the calendar.
- Grain: one row per appointment.
- Leak to watch: missed doses that are never rebooked. Each one is a visit you will not bill, and the empty chair still costs nurse time. The chair utilization calculator shows how much capacity those gaps add up to. The infusion no-show cost calculator puts a yearly dollar figure on no-shows and same-day cancels.
5. Administration and documentation
The nurse records what was given: drug, NDC, lot, dose, start and stop times, and the amount discarded from each single-dose vial. That record is what billing works from, and what an auditor will check.
- Measure: documentation completeness (start and stop times, NDC, waste recorded), and administrations completed versus appointments scheduled.
- Grain: one row per administration (one drug given at one visit).
- Leak to watch: start and stop times missing or rounded, which affects the administration codes you can bill, and waste not recorded, which means the waste line can't be billed.
6. Charge capture: units, NDC, and waste
Charge capture turns the documented administration into claim lines: administration CPT codes, the drug's HCPCS code and billing units, NDC data where the payer requires it, and a separate waste line.
- Measure: billed units divided by documented units for each drug, and the share of single-dose container drug lines carrying a JW or JZ modifier.
- Grain: one row per claim line.
- Leak to watch: under-billed units from a wrong unit conversion, and missing JW lines. For Medicare Part B, CMS requires the JW modifier on discarded amounts from single-dose containers and the JZ modifier when nothing was discarded; claims without them may be returned as unprocessable (CMS JW and JZ FAQ). The JW and JZ modifier guide covers the rules and the checks.
7. Claim submission
The claim goes to the clearinghouse, which can reject it before the payer ever sees it.
- Measure: charge lag (days from date of service to claim submitted), completed visits not yet billed, and clearinghouse rejection rate.
- Grain: one row per claim, with a link back to each administration it covers.
- Leak to watch: completed visits with no claim at all. This is the simplest leak to find and one of the most common, because nothing downstream will ever flag a claim that was never created.
8. Denials and appeals
A denial is a payer decision not to pay a line or a claim, reported on the remittance with a claim adjustment reason code (CARC) and often a remark code (RARC).
- Measure: initial denial rate by count and by dollars, split by payer, drug, site, and reason group; and the share of denied dollars that were appealed and recovered.
- Grain: one row per claim line with its adjustment codes.
- Leak to watch: denials that are never worked, and appeals filed after the payer's deadline. The denial analysis guide shows how to group reason codes and find the root cause.
9. Payment posting
Posting applies the 835 remittance (the electronic remittance advice) to each claim line: allowed amount, paid amount, adjustments, and patient responsibility.
- Measure: underpayment rate (lines where allowed is below your contracted rate), and patient responsibility collected versus billed.
- Grain: one row per claim line per remittance.
- Leak to watch: contractual adjustments that hide underpayments. A CARC 45 adjustment ("charge exceeds fee schedule") is normal, but it can also mask a payer paying below contract if you never compare allowed amounts to an expected rate. For Medicare Part B drugs, CMS publishes the quarterly ASP pricing files you can use to build that expected rate. The ASP quarterly updates guide explains how those rates move. Starting in 2028, selected Part B drugs are paid at 106% of a negotiated price instead, and the Medicare negotiated price exposure calculator estimates the margin at risk drug by drug.
10. Deposit reconciliation
The last step is checking that each posted payment matches money that actually arrived in the bank, and that every deposit has been posted.
- Measure: days from deposit to posting, and unmatched deposits and unmatched postings by week.
- Grain: one row per deposit, matched to one or more remittances.
- Leak to watch: payments posted from paper EOBs that never cleared, and deposits that sit unposted so the claim stays open and gets worked again.
How do the stages compare?
This table puts the ten stages side by side. The grain column matters most: if you count leakage at the wrong grain, you double count or miss rows.
| # | Stage | What to measure | Grain | Typical leak |
|---|---|---|---|---|
| 1 | Order received | Orders per week; complete on arrival | Order | Orders that never reach intake |
| 2 | Intake and BI | Hours to BI complete; re-verification rate | Order | Treating with inactive coverage |
| 3 | Prior authorization | Days to decision; auths expiring in 14 or 30 days | Authorization | Doses after expiry or above approved units |
| 4 | Scheduling | Days to first visit; no-shows; due but unscheduled | Appointment | Missed doses never rebooked |
| 5 | Administration and documentation | Completeness of times, NDC, waste | Administration | Waste or times not recorded |
| 6 | Charge capture | Billed ÷ documented units; JW or JZ present | Claim line | Under-billed units, missing JW lines |
| 7 | Claim submission | Charge lag; unbilled visits; rejections | Claim | Completed visits never billed |
| 8 | Denials and appeals | Denial rate by reason; recovery rate | Claim line | Unworked or late appeals |
| 9 | Payment posting | Allowed vs expected; patient collections | Claim line × remit | Hidden underpayments |
| 10 | Deposit reconciliation | Deposit-to-post days; unmatched items | Deposit | Payments posted but never received |
Definitions for each of these metrics, with formulas and clocks, are in the infusion center KPI glossary.
How much does a small leak at each stage cost?
Small percentages at several stages add up to a meaningful share of revenue. Here is a worked example. All numbers are synthetic: they show the method, not a benchmark for any real center.
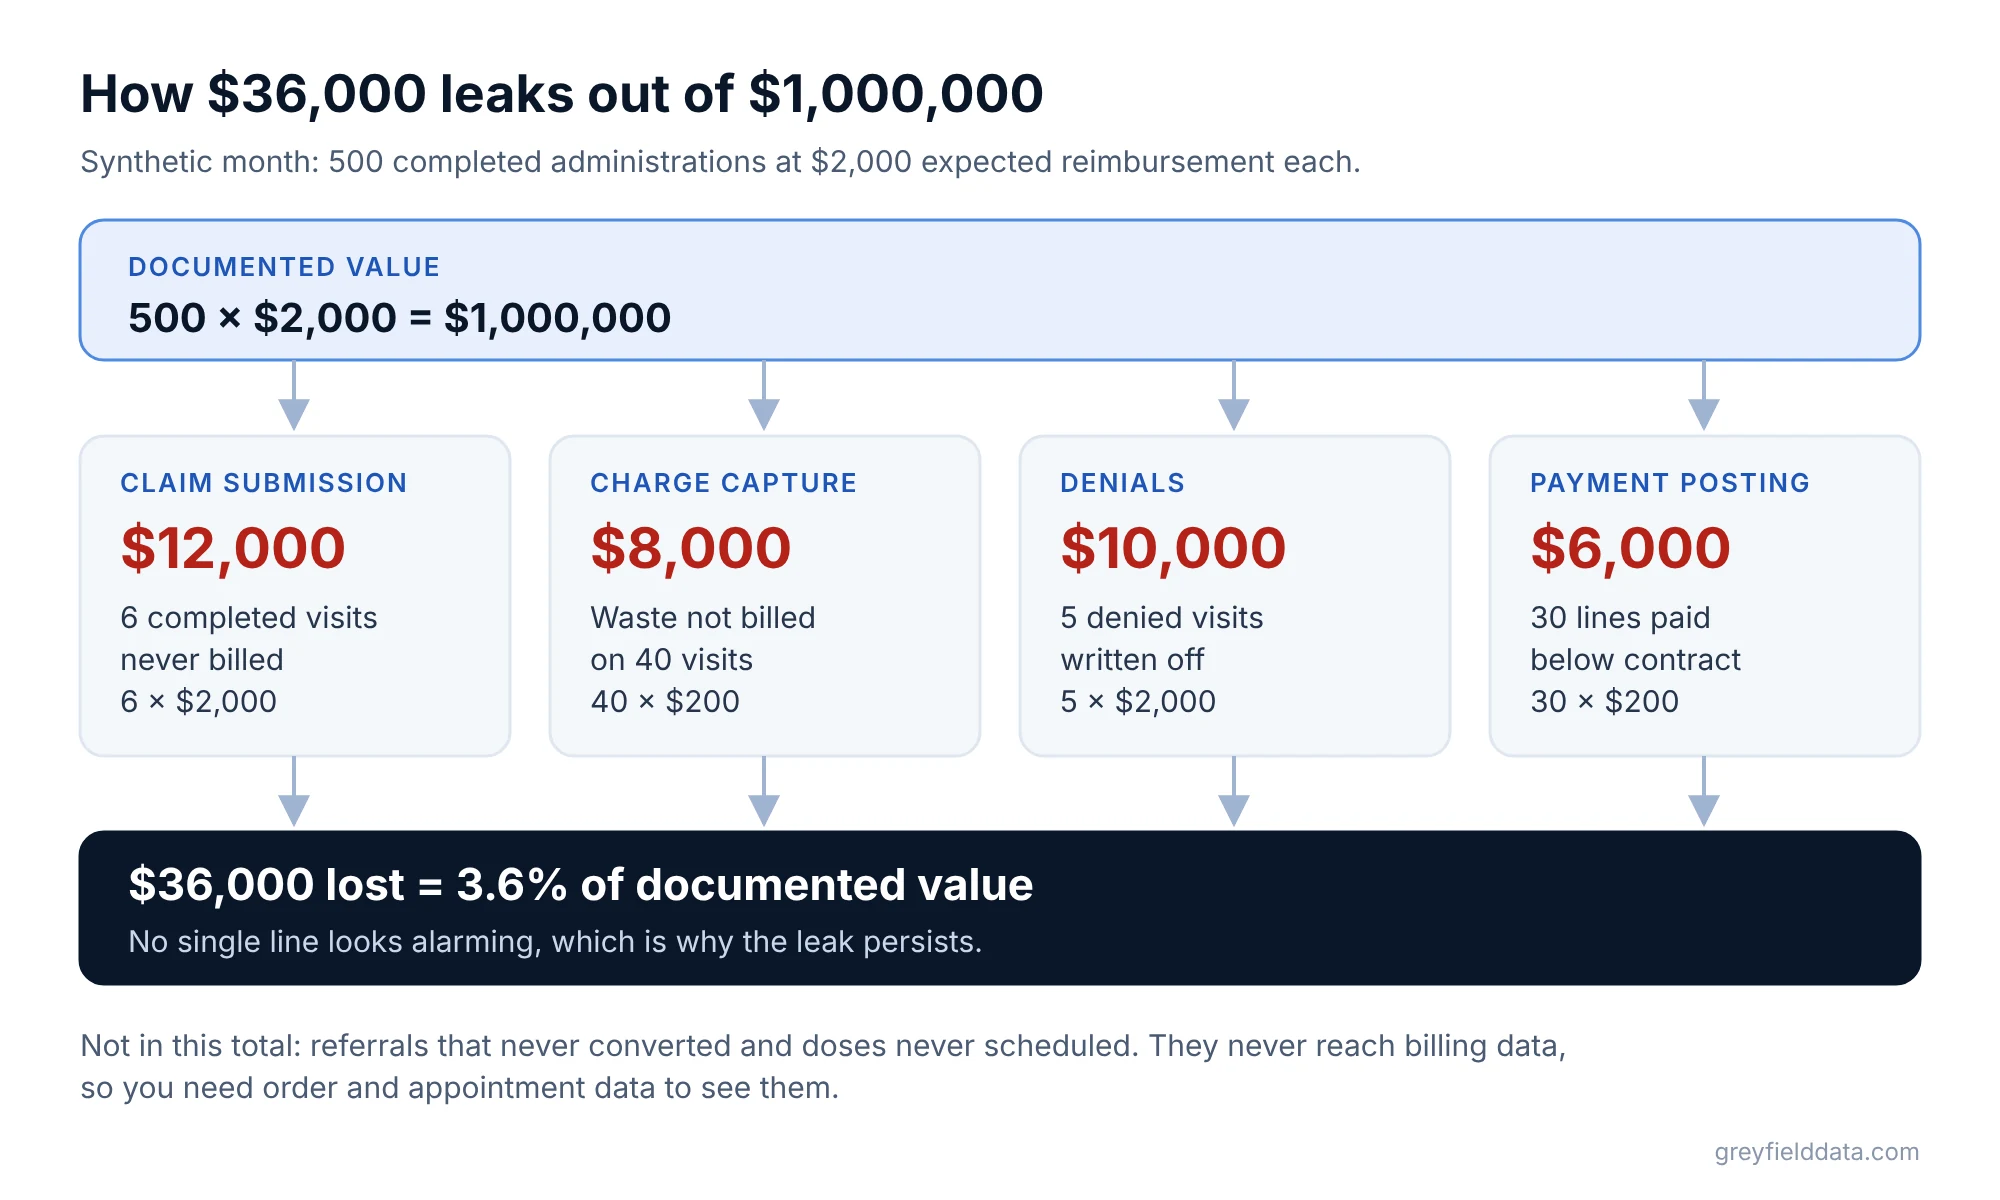
A center documents 500 completed administrations in a month. To keep the math readable, assume each has an expected payer reimbursement of $2,000 for drug and administration together, so documented value is 500 × $2,000 = $1,000,000.
| Stage | What happened (synthetic) | Value lost |
|---|---|---|
| Claim submission | 6 completed visits never billed: 6 × $2,000 | $12,000 |
| Charge capture | Waste not billed on 40 visits, average $200 each: 40 × $200 | $8,000 |
| Denials | 15 visits denied for $30,000; 10 recovered on appeal; 5 written off: 5 × $2,000 | $10,000 |
| Payment posting | Allowed below contract on 30 lines, average $200 each: 30 × $200 | $6,000 |
| Total | $36,000 |
Total leakage is $36,000 ÷ $1,000,000 = 3.6% of documented value. No single line looks alarming, which is exactly why it persists. Notice also what the example leaves out: referrals that never converted, and doses that were due but never scheduled. Those don't appear in billing data at all, so you need order and appointment data to see them.
The compounding point from the takeaways works the same way. If documentation, billing, and collection each keep 99%, you keep 0.99³ = 0.9703 of value, a 2.97% leak. If your drug margin is thin, a leak that size can be a large share of profit, because the drug cost was spent either way.
Which leaks are hardest to see?
Some leaks hide because the data that would show them sits in a different system from the data you report on.
Orders that never become appointments
If your reports start from appointments, an order with no appointment does not exist. You need a report built on orders, so stalled referrals show up. The referral-to-first-treatment guide lists the nine places they stall.
Waste that was given but not documented
You can't bill a JW line for waste nobody wrote down, and nothing on the claim will tell you it is missing. Compare billed units, including JW units, with vials removed from inventory for the same drug and week. The drug inventory shrink guide covers that comparison.
Payments that were posted but not deposited
Posting software can show a claim as paid while the bank never received the money, especially with paper checks and lockbox files. Reconcile deposits to remittances weekly, not at month end.
Underpayments inside contractual adjustments
A payer can pay less than your contract and the remit will still balance, because the difference lands in a contractual adjustment. Only a comparison of allowed amounts with an expected rate table finds it.
What data do you need to measure leakage end to end?
You need data from at least four places, joined on keys that survive each handoff.
- Operational system (often the infusion EHR): orders, authorizations, appointments, administrations, and documented units and waste.
- Billing or practice management system: claims, claim lines, units, modifiers, and charge dates.
- Remittances (835 files): allowed, paid, adjustments, CARC and RARC codes, and patient responsibility.
- Bank and finance: deposits, plus drug purchase invoices if you want to reconcile purchased vials to billed vials.
The hard part is the keys, the shared IDs that link one record to the next:
- An order can have many appointments.
- An appointment can have several administrations.
- A claim can cover several administrations.
- A remittance can pay many claims.
Decide the grain of each report before you join anything, then check row counts at every join. If you work in WeInfuse, the WeInfuse reporting guide explains which Looker models start from orders and which start from appointments. The CFO guide to an infusion data warehouse explains how one single source of truth ties these sources to the books.
Which metrics should you start with?
If you can only build three reports this month, start with the leaks that are cheapest to find and fix.
- Completed visits not yet billed, older than your normal charge lag. Each one is a full claim at risk.
- Authorizations expiring in the next 30 days for patients with future appointments. Each one is a future authorization denial you can still prevent.
- Denied dollars by reason group and payer, for the last 90 days. This tells you whether the problem is at the front (eligibility and authorization) or the back (coding and billing).
The 12 weekly reports guide covers these three and nine more, with the grain and the common mistake for each. To turn them into weekly to-do lists, see the red flag reports guide.
What to do next
Start by putting one number on the front of the funnel. The referral leakage calculator estimates how many referrals and treatments you lose before the first infusion.
Then build the unbilled visits report, because it is the quickest win. The claims, charges and collections guide explains why billed is not collected.
Joining your infusion EHR, billing, and remittance data into one view of leakage is what my WeInfuse reporting service does. If you want help with it, book a call with me.
WeInfuse is a trademark of its owner. Greyfield Data is independent and not affiliated with WeInfuse.
Frequently asked questions
What is a good revenue leakage rate for an infusion center?
There is no reliable public benchmark for infusion revenue leakage, because centers define it differently. Measure your own baseline by stage for one quarter, then set targets for the stages you can control.
What causes the most revenue leakage in infusion centers?
It varies by center, which is why you measure each stage. Common sources are completed visits never billed, doses given without a valid authorization, unbilled waste, and denials that are never worked.
Is revenue leakage the same as a high denial rate?
No. Denials are one stage. A center can have a low denial rate and still leak revenue through unbilled visits, missing waste lines, underpayments, or deposits that never reconcile.
Can I measure revenue leakage from my EHR reports alone?
Only partly. The EHR usually holds orders, appointments, and documentation, but denials, allowed amounts, and deposits live in remittance and bank data. You need to join them to see the whole path.
How often should an infusion center review revenue leakage?
Weekly for the operational leaks (unbilled visits, expiring authorizations, open denials) and monthly for the financial ones (underpayments, deposit reconciliation, purchased versus billed vials).
Part of the Infusion analytics guides, a reading path through related articles.
Linus Tse
Founder of Greyfield Data. Built 400+ dashboards. Certified in Sigma, Snowflake, Tableau, and Power BI.
About Linus