How quarterly ASP updates change your infusion drug margin
Medicare resets Part B drug payment every quarter from sales two quarters old. Here is how that moves your drug margin and a quarterly check to catch it.

Written by Linus Tse, founder of Greyfield Data
· 10 min read
On this page 11 sections
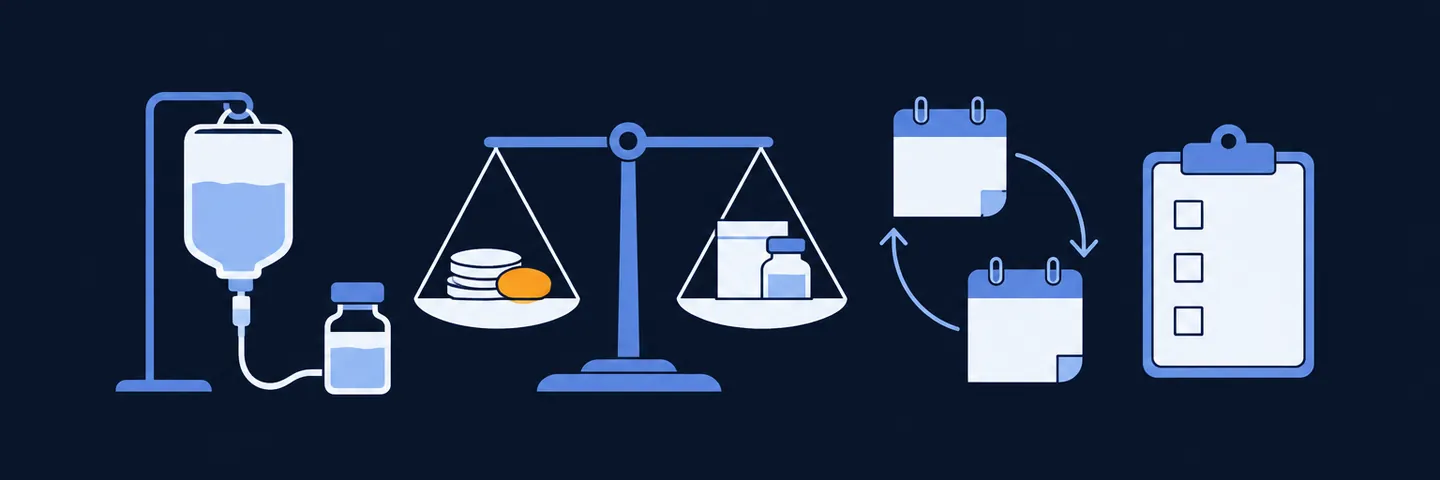
Medicare resets what it pays for most infused drugs four times a year, and each new rate is built from manufacturer sales that are about two quarters old. Your purchase price does not wait for that calendar. So when a drug's price moves, your margin on that drug can shrink or grow for months before the payment catches up, and nobody notices until the month-end numbers look off.
I build reporting for infusion providers that compares each quarter's new Medicare rates with what they actually pay for their top drugs. A margin squeeze then shows up on a list the week the file is published. If you want to see your margin on one drug right now, the buy-and-bill margin calculator does it in a minute.
Key takeaways
- Medicare Part B pays most separately payable drugs at the average sales price (ASP) plus 6 percent, and CMS publishes new payment limits every quarter (CMS ASP overview).
- Each quarter's rate is built from sales two quarters earlier. Sales from January to March set the rate that takes effect July 1 (CMS payment limit file fact sheet).
- Your purchase cost can change any day. When cost rises before the rate does, your margin on that drug shrinks until the rate catches up.
- Any commercial contract written as a percentage of ASP moves on the same schedule, so one quarterly file can change your margin across several payers at once.
- A short quarterly check on your top drugs (new rate, old rate, current cost) catches most surprises before the first claim at the new rate.
What is ASP, and how does Medicare use it?
ASP is the average price manufacturers report selling a drug for in a quarter, after most discounts and rebates. CMS uses it to set the Medicare Part B payment limit for each drug's billing code (its HCPCS code, often called a J-code).
For most separately payable drugs and biologicals, the payment limit is ASP plus 6 percent (CMS). The statute behind it says payment amounts "shall be updated by the Secretary on a quarterly basis" (42 U.S.C. 1395w-3a).
The payment limit is a ceiling per billing unit, not what lands in your bank. Patient coinsurance, secondary payers, and other adjustments sit between the file and the deposit. That's why charges, claims, expected payment and collections are four different numbers. The infusion center KPI glossary defines each one in plain terms.
When does each quarterly rate take effect?
Each rate takes effect on the first day of a quarter and comes from the sales quarter two quarters earlier. CMS calls this the two-quarter lag. Manufacturers must report each quarter's ASP within 30 days of the quarter's close (CMS ASP reporting), and CMS then calculates and publishes the new limits.
| Sales quarter | Sales dates | Manufacturer reporting window | New Medicare rate takes effect |
|---|---|---|---|
| 1 | January 1 to March 31 | April 1 to April 30 | July 1 |
| 2 | April 1 to June 30 | July 1 to July 30 | October 1 |
| 3 | July 1 to September 30 | October 1 to October 30 | January 1 |
| 4 | October 1 to December 31 | January 1 to January 30 | April 1 |
Source: Table 1 of the CMS fact sheet on the Medicare Part B drug payment limit file.
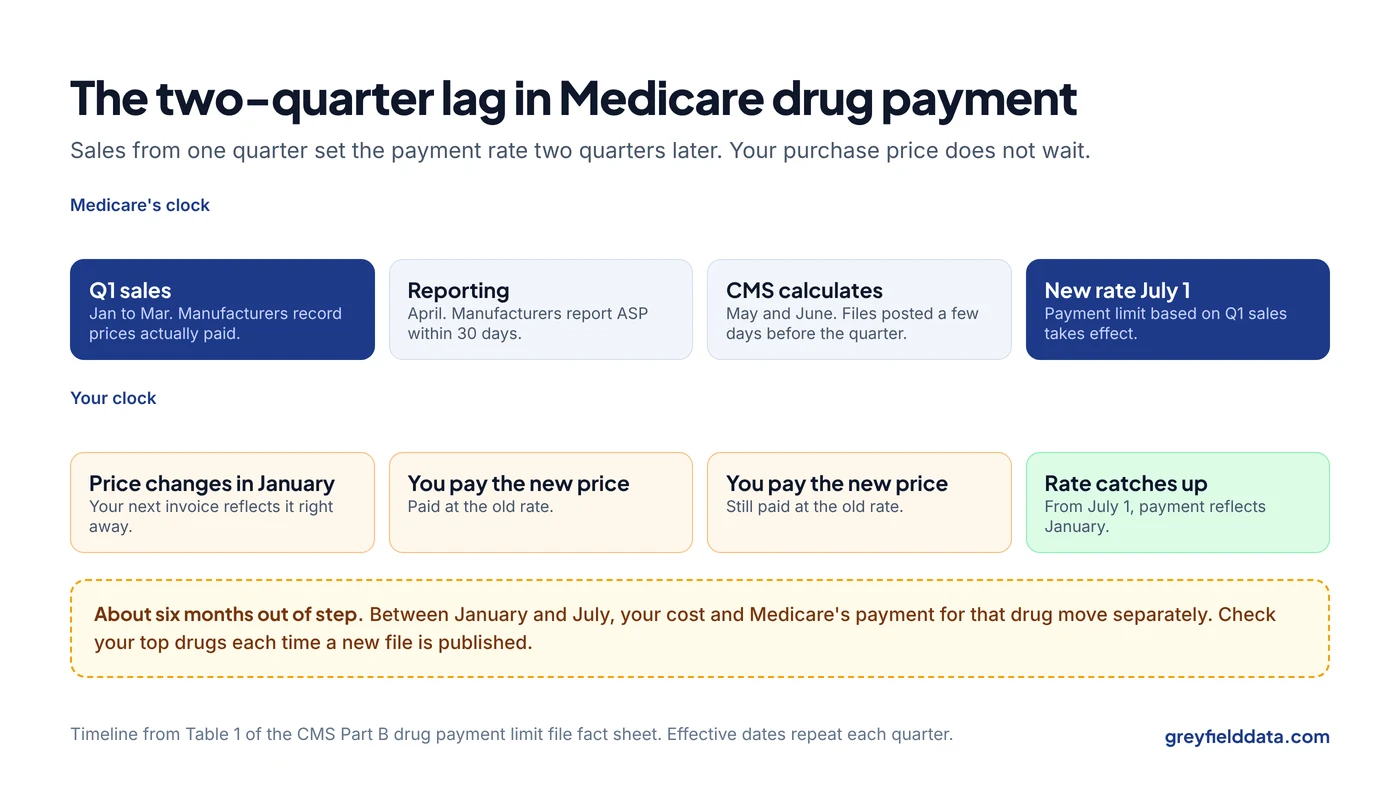
The same fact sheet says CMS generally releases files a few days before the effective date, posts preliminary files before the final ones, and may restate earlier payment limits when a manufacturer corrects its data. Restated limits are marked with a date in the updated file. The ASP pricing files page lists every quarter's files, including revisions.
Why does the lag squeeze your margin?
The lag squeezes your margin because your cost moves now and Medicare's payment moves later. If a manufacturer raises a drug's price in January, your next invoice reflects it. Medicare's rate won't reflect January sales until July.
The reverse also happens. A drug's ASP can fall, for example when a competing product enters and discounts deepen, while your contract price with your distributor stays where it was. Then the new quarter's rate drops below what you paid for the vials on your shelf.
The second case is the one that hurts quietly. You bought the drug at last month's price, you give it next month, and you are paid at the new, lower rate.
What does a quarterly change look like in dollars?
Here is a worked example. All numbers are synthetic: they show the method, not the price of any real drug.
A center gives a drug billed at 100 units per dose. It pays its distributor $10.20 per unit, so each dose costs 100 × $10.20 = $1,020. It gives 60 Medicare doses a quarter.
| Last quarter | This quarter | |
|---|---|---|
| ASP per unit (synthetic) | $10.00 | $9.80 |
| Payment limit per unit (ASP × 1.06) | $10.60 | $10.388 |
| Payment limit per dose (100 units) | $1,060.00 | $1,038.80 |
| Your cost per dose | $1,020.00 | $1,020.00 |
| Margin per dose | $40.00 | $18.80 |
| Margin for 60 doses | $2,400.00 | $1,128.00 |
A 2 percent drop in ASP ($10.00 to $9.80) cut the margin on this drug by $1,272 a quarter, or 53 percent ($21.20 ÷ $40.00). That's the core problem with thin drug margins: a small move in the rate is a large move in what you keep.
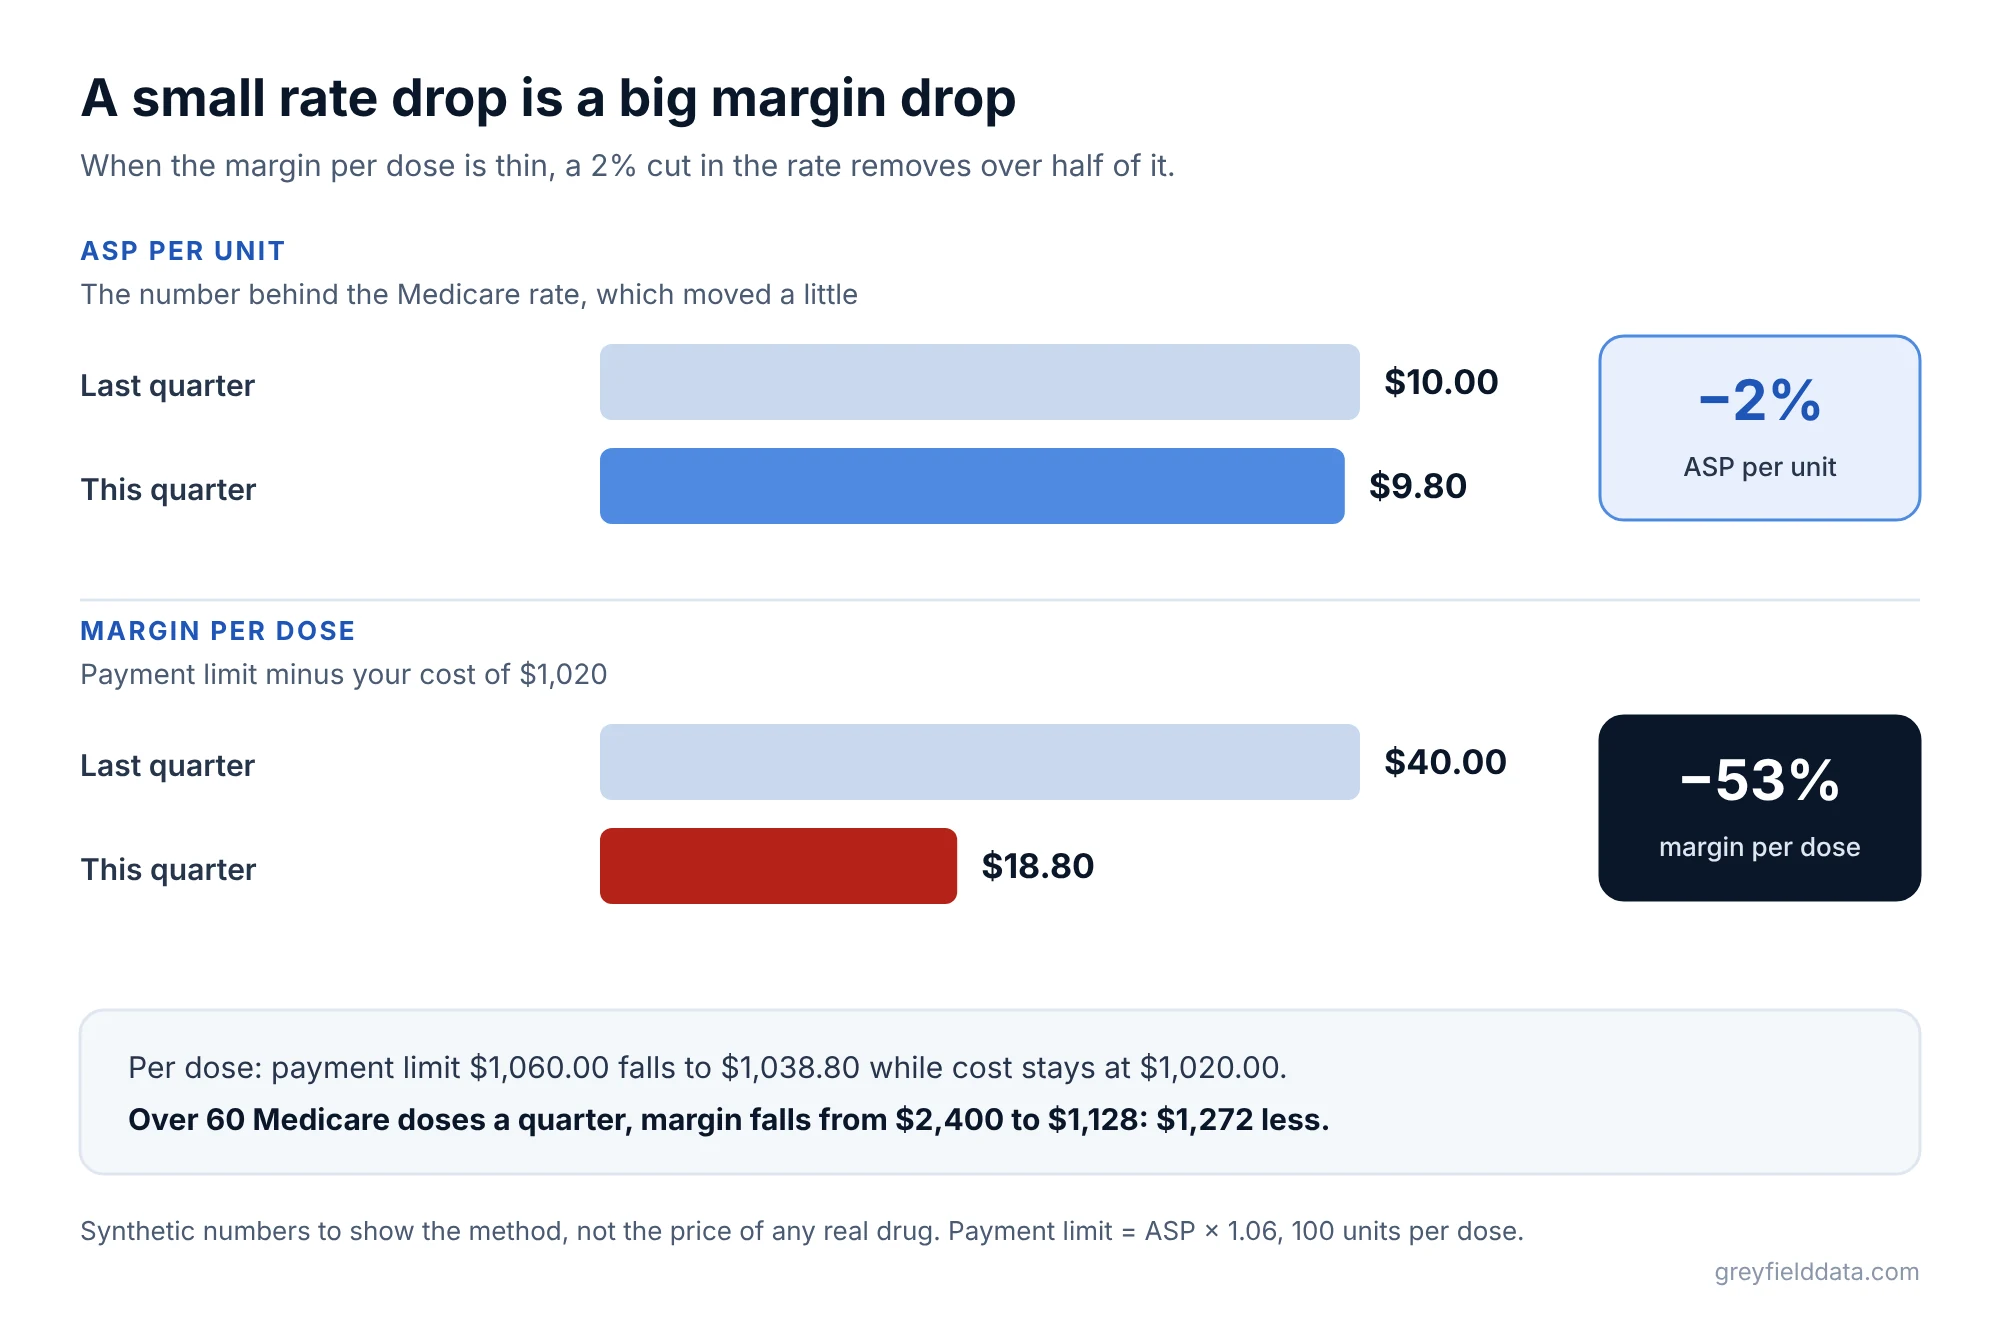
Two things the example leaves out make it worse in real life. The payment limit is before coinsurance and any other reductions, so the cash you collect is lower. And if a commercial payer pays this drug at a percentage of ASP, the same drop hits those claims too.
How should you watch for ASP changes each quarter?
Run the same short check every quarter, the week the new file is published. It takes one person an afternoon once it is set up, and most of that is gathering your current costs.
- Pick your top drugs. Start with the 10 to 20 drugs that make up most of your drug spend. They carry most of the risk.
- Pull the new and old payment limits. Download the new quarter's file from the CMS ASP pricing files page and look up each drug's billing code. Keep last quarter's file next to it.
- Put your current cost next to both. Use your latest invoice price per billing unit, not the price from when you set up the drug.
- Flag the drugs where margin per dose drops below your floor. Pick a floor that covers your nurse time and handling, not just zero.
- Check your commercial contracts. For each flagged drug, list the payers whose contract pays it as a percentage of ASP. Those payers' expected payments change on the same date.
- Update the expected payment amounts in your billing system. If the billing team still expects last quarter's rate, every underpayment check you run will be wrong.
- Decide what to do about each flagged drug. Options include asking your distributor or group purchasing organization about pricing, buying smaller quantities until the rate recovers, or reviewing whether a specialty pharmacy route makes sense for that payer.
The table below is what the finished check looks like for one quarter.
| Drug (synthetic) | Old limit per dose | New limit per dose | Current cost per dose | New margin per dose | Payers tied to ASP | Flag |
|---|---|---|---|---|---|---|
| Drug A | $1,060.00 | $1,038.80 | $1,020.00 | $18.80 | 3 | Below floor |
| Drug B | $4,240.00 | $4,282.40 | $4,050.00 | $232.40 | 2 | OK |
| Drug C | $612.00 | $599.76 | $604.00 | −$4.24 | 1 | Loses money |
Drug C now loses $4.24 per dose before coinsurance or any labor. On a report that only shows revenue, it would look fine.
What else can change when a new file comes out?
More than the rate can change. The CMS fact sheet lists several kinds of quarterly changes to the payment limit file.
- New drugs and new codes are added once a full quarter of sales data exists. During a drug's first months, payment can follow different rules.
- Removed drugs drop off when they are discontinued, recalled, or no longer payable under Part B.
- Restated limits replace earlier ones after a manufacturer corrects its data.
The ASP pricing files page also notes that a drug missing from a quarter's file can still be processed by your Medicare Administrative Contractor. A missing row means you need to look up how the claim will be priced, not that it won't be paid.
Where does this fit in your other reports?
The quarterly ASP check is one of several drug margin checks. It pairs naturally with:
- Purchased versus billed by drug, from the 12 weekly reports guide, which catches vials bought but never billed.
- Waste units billed versus documented, covered in the JW and JZ modifier guide, because unbilled waste makes a thin margin thinner.
- Underpayment checks, which compare what payers allowed with what you expected. See where infusion centers lose revenue between order and deposit.
- A monthly margin page for owners and lenders, as laid out in the infusion board finance pack guide.
The infusion center metrics playbook shows how these drug margin checks sit alongside chair, referral and collections measures. The infusion analytics resource hub links every related guide.
This post is educational and isn't billing or legal advice. Payment rules change, so confirm current CMS policy and your payer contracts before acting.
What is coming with negotiated Medicare drug prices?
Medicare's negotiated drug prices are a second force on the same margin, and they cut what providers recover on many Part B drugs.
Milliman prepared a September 2026 white paper for NICA using 2023 Medicare claims. It estimated that negotiated prices would reduce what providers recover on non-oncology Part B drugs by $9.2 billion over 10 years, or 16.1% of net cost recoveries. Net cost recovery is what the claim pays after sequestration, minus what the drug and its handling cost you. In other words, it is close to your drug margin. Read the Milliman analysis.
You do not need to forecast the national number. Check which of your top drugs by margin are on the negotiation lists, and model your own exposure drug by drug, the same way you watch quarterly ASP changes. The Medicare negotiated price exposure calculator estimates that exposure for one drug at a time.
What to do next
Start with your top five drugs and this quarter's file. Put the new payment limit, last quarter's limit, and your current cost side by side, and see which ones moved.
To test what a change does to one drug's margin, use the buy-and-bill margin calculator. More on this work is on the infusion analytics page and the ambulatory infusion center page. If you want the quarterly check built into your reporting so it runs itself, book a call with me.
Frequently asked questions
How often does Medicare's ASP payment rate change?
Every quarter. New payment limits take effect January 1, April 1, July 1, and October 1, and each is based on manufacturer sales from two quarters earlier (CMS fact sheet).
Why did my Medicare payment for an infused drug go down?
The most common reason is that the drug's reported ASP fell in the sales quarter behind the new rate. Compare this quarter's payment limit file with last quarter's for that billing code before assuming a billing error.
Is ASP the same as what I pay for the drug?
No. ASP is an average across a manufacturer's sales after most discounts, and your price depends on your distributor, purchasing group, and volume. Your cost can sit above or below ASP.
Do quarterly ASP changes affect commercial payers?
They do if your contract pays the drug as a percentage of ASP. Check each contract's drug payment terms so you know which payers move when the file changes.
What if a drug isn't on this quarter's ASP file?
CMS notes that your Medicare Administrative Contractor may still process the claim even if the drug isn't on the file (ASP pricing files). Ask your contractor how it will be priced before you treat.
Part of the Infusion analytics guides, a reading path through related articles.
Linus Tse
Founder of Greyfield Data. Built 400+ dashboards. Certified in Sigma, Snowflake, Tableau, and Power BI.
About Linus