What should an infusion group's board see each month?
A one-page monthly board pack for a multi-site infusion group: ten numbers that tie to the books, one site table, and the rules that keep every site comparable.

Written by Linus Tse, founder of Greyfield Data
· 8 min read
On this page 9 sections

A multi-site infusion group's board should see one page each month: about ten numbers covering volume, capacity, drug margin, cash, and risk, plus a table with one row per site. Every number should tie to the general ledger or to a stated source, use the same definition at every site, and show the trend over 13 months. The page works when the board stops asking "is this number right?" and starts asking "why did it move?"
I build reporting for multi-site infusion groups that comes from one data warehouse. The board pack, the lender package, and the site reports then all show the same numbers. For groups running WeInfuse, WeInfuse reporting and data services covers how that data gets into one place. WeInfuse is a trademark of its owner; Greyfield Data is independent.
Key takeaways
- One page, about ten numbers, 13 months of trend. Detail goes in an appendix the board can ask for.
- Five areas: volume, capacity, drug margin, cash, and risk.
- Every number ties to something: the general ledger, bank deposits, or a named report. Say which on the page.
- Group ratios are weighted, not averaged. Average three sites' chair use and you get the wrong answer.
- Show restatements. If last month's number changed, say so and why, or the board stops trusting the page.
Why do infusion board packs lose the board's trust?
They lose trust when numbers don't match each other.
The visit count on the board page differs from the one in the site report. Revenue doesn't match the books. A site's chair use looks great because it counts hours differently. Once that happens, the meeting turns into reconciling numbers instead of making decisions.
The fix is less about design and more about rules: one definition per number across every site, one source for each, and a stated tie-out. Those rules are the subject of how to roll up multi-site infusion KPIs so the board trusts one number. This post is about what goes on the page.
Which numbers belong on the page?
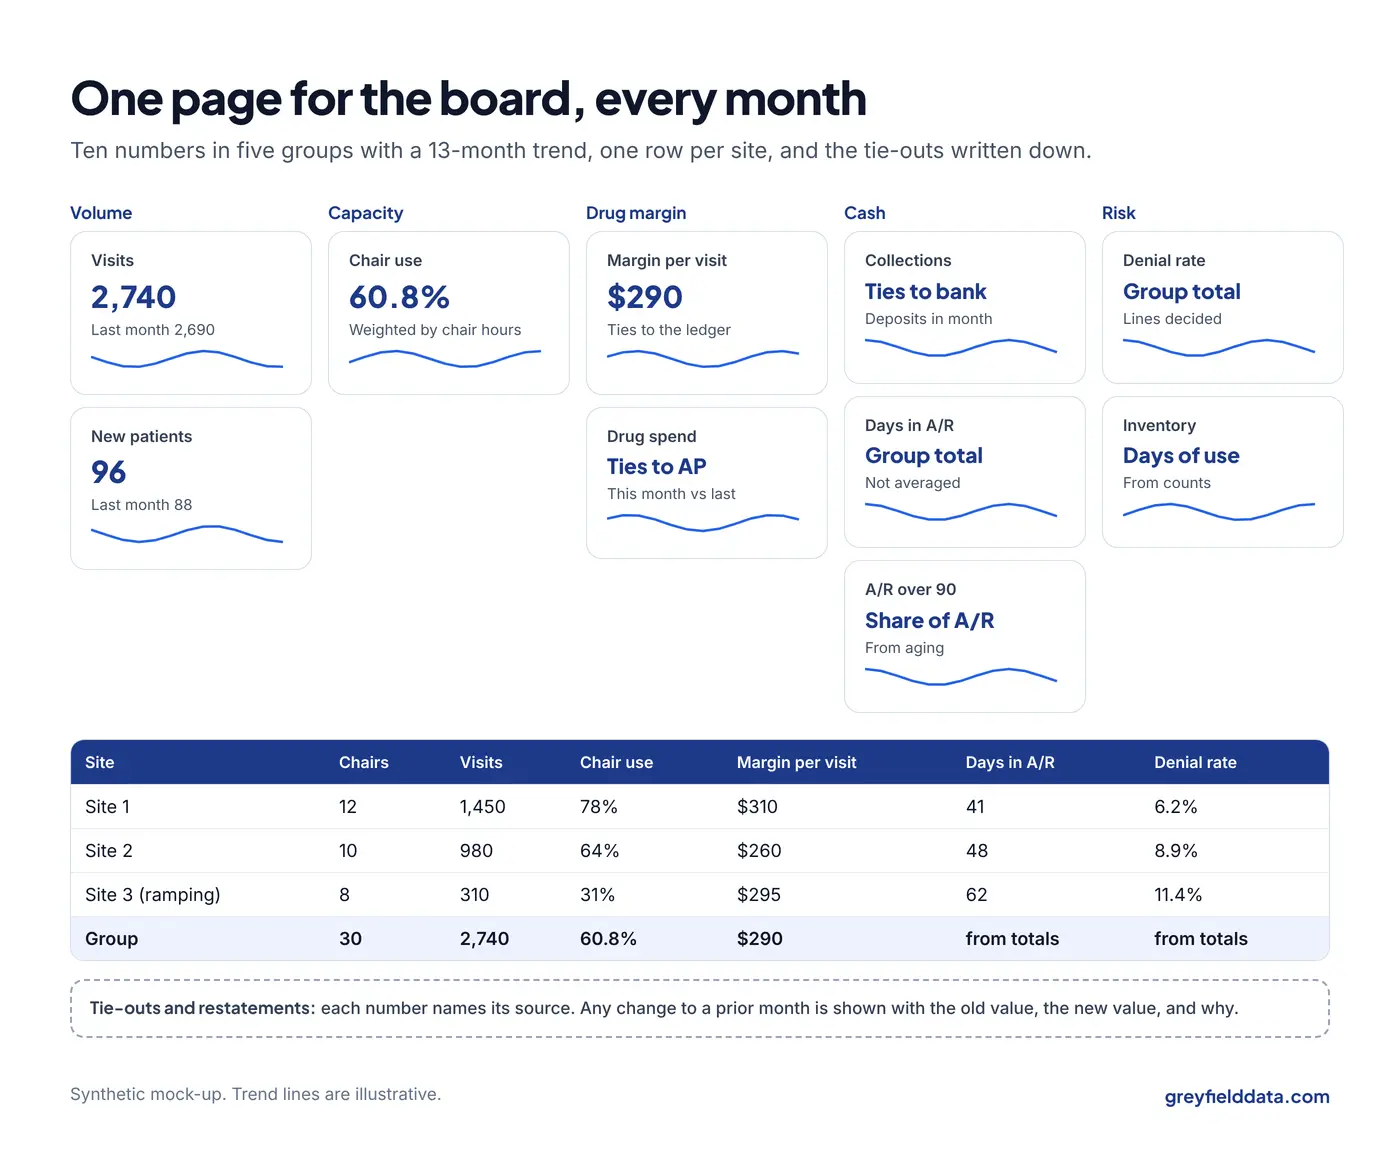
About ten, in five areas. Each one has a plain definition and something it ties to.
| Area | Number | Definition | Ties to |
|---|---|---|---|
| Volume | Visits | Completed infusion visits | Billed visits, with the gap explained |
| Volume | New patients started | First infusion in the month | Referral report |
| Capacity | Chair use | Chair hours used ÷ chair hours available, weighted across sites | Schedule |
| Drug margin | Drug margin per visit | Drug payment minus drug cost, per buy-and-bill visit | General ledger drug revenue and cost |
| Drug margin | Drug spend | Drug purchases in the month | Accounts payable |
| Cash | Collections | Cash received in the month | Bank deposits |
| Cash | Days in A/R | Open A/R ÷ average daily net revenue | General ledger A/R |
| Cash | A/R over 90 days | Share of A/R older than 90 days | A/R aging |
| Risk | Denial rate | Denied claim lines ÷ claim lines decided | Billing system |
| Risk | Drug inventory on hand | Value of buy-and-bill stock, in days of use | Inventory count |
Keep charges off the page. Charges mostly reflect your list prices, not what you're paid, as charges, claims, expected payment, and collections explains. Collections and drug margin tell the board far more.
Why does drug margin get its own section?
Drug margin gets its own section because drugs are most of the business and the most exposed to policy.
An infusion company CEO, writing on the National Infusion Center Association (NICA) blog in 2020, put drug acquisition and reimbursement at 70% to 95% of an infusion business, in his post on value-creation plans. That's an operator's estimate, not a study, but most infusion finance leaders will recognize it.
The margin on that revenue is thin. Milliman published a September 2026 study commissioned by NICA, its white paper on Part B provider reimbursement. It estimated that providers net about 4.3% of the drug's average sales price from Medicare's add-on today after sequestration, not the 6% on paper. The same study projects that Medicare's negotiated prices, starting in 2028, will cut non-oncology Part B provider reimbursement by $9.2 billion over 10 years.
A board should see drug margin per visit by site every month, and a note on which drugs face price changes. The quarterly ASP update guide shows how to spot those changes each quarter. The buy-and-bill margin calculator and the Medicare negotiated price exposure calculator size the effect on one drug at a time.
How should the site table work?
One row per site, the same columns as the headline numbers, and a group row that's calculated correctly. Here's one month for a three-site group. All numbers are synthetic: replace them with your own.
| Site | Chairs | Visits | Chair use | Drug margin per visit | Days in A/R | Denial rate |
|---|---|---|---|---|---|---|
| Site 1 | 12 | 1,450 | 78% | $310 | 41 | 6.2% |
| Site 2 | 10 | 980 | 64% | $260 | 48 | 8.9% |
| Site 3 (opened this year) | 8 | 310 | 31% | $295 | 62 | 11.4% |
| Group | 30 | 2,740 | 60.8% | $290 |
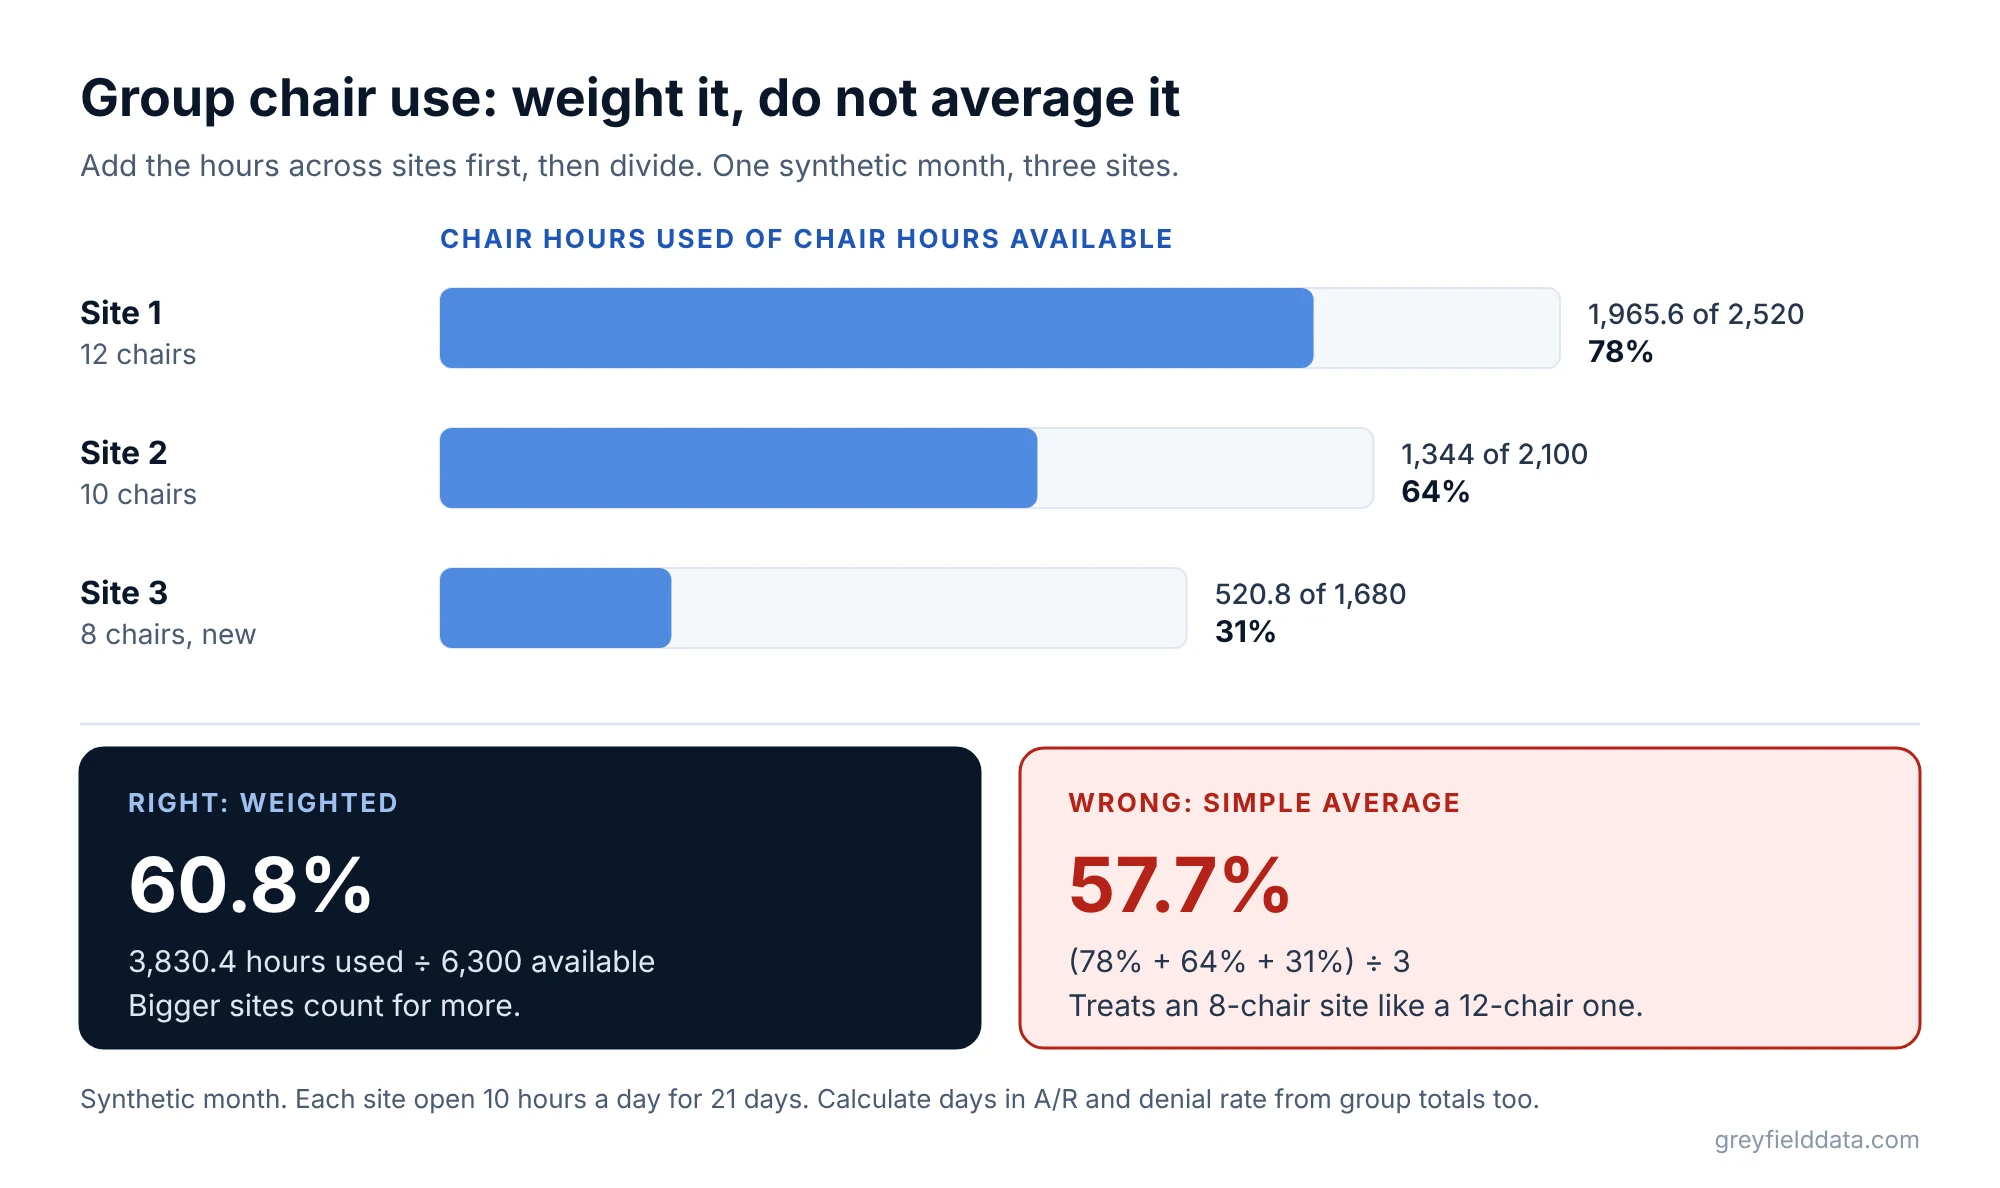
The group row is weighted, not averaged:
- Chair use. Each site is open 10 hours a day for 21 days, so available chair hours are 2,520, 2,100, and 1,680, or 6,300 in all. Hours used are 1,965.6, 1,344, and 520.8, or 3,830.4. Group chair use is 3,830.4 ÷ 6,300 = 60.8%. A simple average of 78%, 64%, and 31% gives 57.7%, which is wrong. The infusion chair utilization calculator does the site-level math for you.
- Drug margin per visit. (1,450 × $310 + 980 × $260 + 310 × $295) ÷ 2,740 = $795,750 ÷ 2,740 = $290.
- Days in A/R and denial rate. Calculate them from group totals, not by averaging sites. They're left blank here because the example doesn't include the totals.
Mark new sites. Site 3's numbers are normal for a site still ramping, and the board should judge it against its ramp plan, not against Site 1. See how long a new infusion site takes to fill its chairs for building that plan.
What rules keep the page trusted?
Five rules keep it trusted. Write them on the page itself or in a one-paragraph note under it.
- Same definitions at every site. If one site counts injections as visits and another doesn't, fix it before it reaches the board.
- State the tie-out. "Collections tie to bank deposits within a stated amount" or "Drug margin ties to the general ledger after month-end close."
- Close first, then publish. Publish after the books close, so revenue and cost numbers don't move afterward.
- Show restatements. If a prior month changed, show the old and new number and why.
- Keep 13 months. One month is noise. Thirteen shows the trend and the same month last year.
These are the same things a buyer or lender will check, so a pack built this way also shortens diligence. See the data a buyer or lender will ask for.
Where does the data come from?
The data comes from four or five systems that don't agree on their own:
- your infusion EHR for visits and drug given
- your billing system for claims and denials
- your accounting system for revenue, cost, and A/R
- the bank for deposits
- inventory counts
Pulling those into one data warehouse each night, with the definitions applied once, is what makes every report match. The CFO's guide to an infusion data warehouse explains how that's built and what should tie to the books. The companion CFO white paper on the infusion data warehouse covers partner selection and lender reporting in more depth.
What to do next
Draft the page for last month by hand, with the ten numbers and the site table, and note where each number came from. Wherever two sources disagree, you've found the first thing to fix.
The infusion center KPI glossary has plain definitions for every number on the page. The infusion analytics resource hub links every related guide. If you'd like the pack built from a single source of truth so it's ready the day after close, book a call with me. More on this work is on the infusion analytics page.
Frequently asked questions
What KPIs should a multi-site infusion board see?
About ten: visits, new patients started, chair use, drug margin per visit, drug spend, collections, days in A/R, A/R over 90 days, denial rate, and inventory on hand, plus a table by site.
How do you combine chair utilization across sites?
Add chair hours used across sites and divide by total chair hours available. Don't average the sites' percentages, because sites with more chairs should count more.
Should the board pack show charges or collections?
Collections. Charges mostly reflect your list prices. Collections, tied to bank deposits, and drug margin show how the business is actually doing.
How do you make board numbers match the financial statements?
Publish after month-end close, take revenue, cost, and A/R from the general ledger, and state each tie-out on the page. Show any restatement with its reason.
Part of the Infusion analytics guides, a reading path through related articles.
Linus Tse
Founder of Greyfield Data. Built 400+ dashboards. Certified in Sigma, Snowflake, Tableau, and Power BI.
About Linus