10 numbers every multi-site infusion CFO should see each month
Ten monthly numbers for a multi-site infusion CFO, from cash against expected payment to next quarter's ASP exposure, and what to do when each moves.

Written by Linus Tse, founder of Greyfield Data
· 11 min read
On this page 16 sections

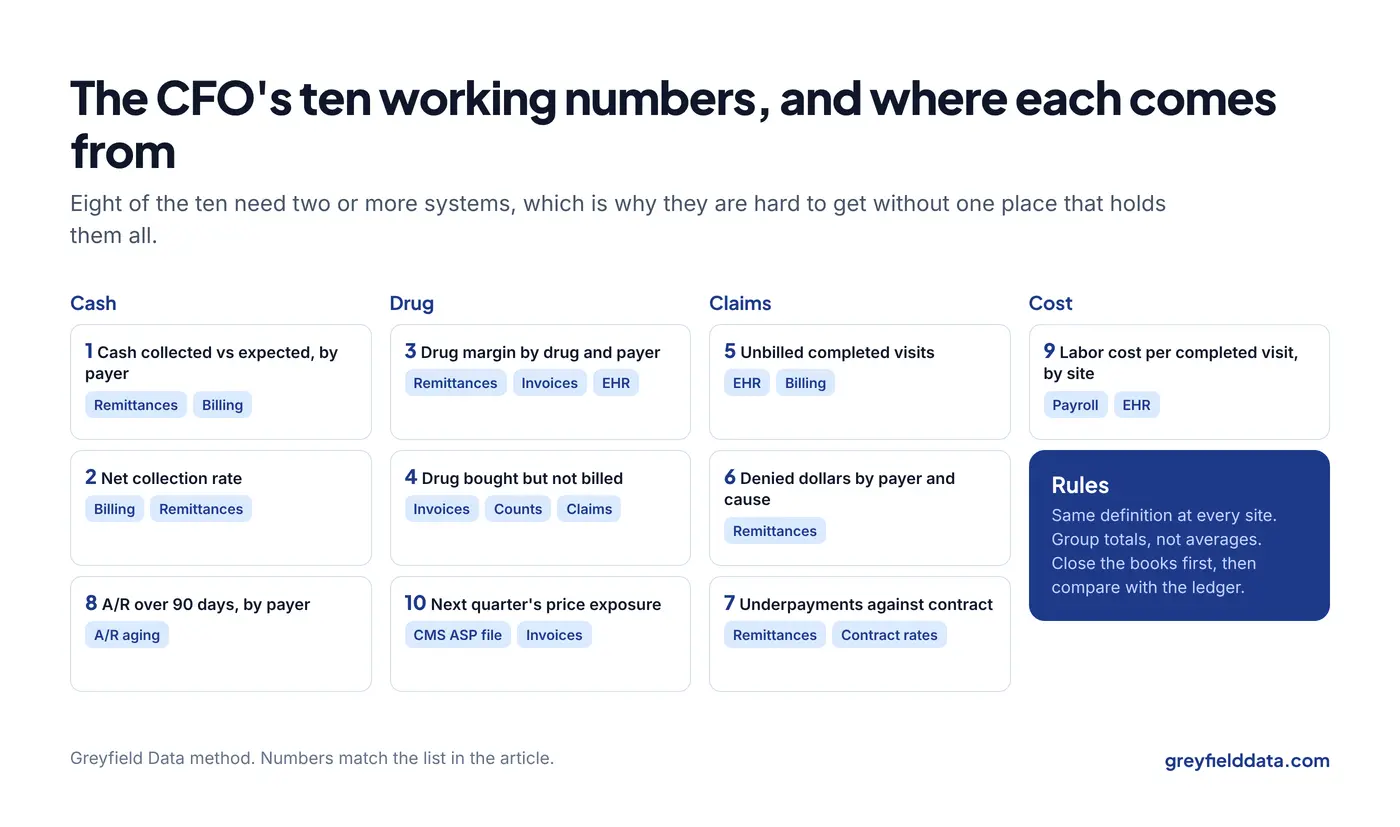
A multi-site infusion CFO should see ten working numbers each month. They are cash collected against expected payment, net collection rate, drug margin by drug and payer, and drug bought but never billed. The rest are unbilled visits, denied dollars, underpayments, aged A/R by payer, labor cost per visit, and next quarter's drug price exposure. Each one points to a decision you can make that month.
I build monthly finance reporting for multi-site infusion groups from one data warehouse, so these numbers tie to the books and every site is counted the same way. The free CFO's guide to an infusion data warehouse explains how. To check one drug's margin today, try the buy-and-bill margin calculator.
Key takeaways
- This is the CFO's own working list, one level below the board page. The monthly board pack shows ten headline numbers; these ten explain why they moved.
- Most of the ten need data from more than one system, such as remittances, distributor invoices, payroll, and the EHR. That is why they are hard to get without a single source of truth.
- Work out group numbers from group totals, never by averaging site percentages.
- No public benchmarks exist for most of these at infusion centers. Track your own 13-month trend and compare sites with each other.
- Every number below names its source and the action to take when it moves. If a number has no action, drop it.
Quick answers
- How often: monthly, after the books close, so the numbers don't change afterward.
- Biggest single number: drug margin by drug and payer, because drugs are most of the revenue.
- Quickest cash: unbilled completed visits, because each one is a claim you can still send.
- Most often missing: underpayments, because it needs contract rates in a usable form.
- Where they come from: EHR, billing system, remittances, general ledger, payroll, and distributor invoices.
What are the 10 numbers, and where does each come from?
The table lists each number, what it shows, and the systems it needs. Most need two or more.
| # | Number | What it shows | Comes from |
|---|---|---|---|
| 1 | Cash collected vs expected | Whether payers pay what you expected, by payer | Remittances, billing |
| 2 | Net collection rate | Share of collectible money you actually collect | Billing, remittances |
| 3 | Drug margin by drug and payer | What you keep on each drug, by who pays | Remittances, distributor invoices |
| 4 | Drug bought but not billed | Units purchased that never reached a claim | Distributor invoices, EHR, billing |
| 5 | Unbilled completed visits | Visits given with no claim yet, in dollars | EHR, billing |
| 6 | Denied dollars by payer and cause | Money held up, and which step caused it | Remittances |
| 7 | Underpayments against contract | Payments below the contracted rate | Remittances, contract rates |
| 8 | A/R over 90 days by payer | Money getting old, payer and patient split | Billing A/R aging |
| 9 | Labor cost per completed visit | Staff cost behind each visit, by site | Payroll, EHR |
| 10 | Next quarter's drug price exposure | Margin change from the new Medicare rates | CMS ASP file, distributor invoices |
1. Cash collected against expected: are payers paying what you expected?
This number compares what each payer paid with what you expected them to pay, for claims paid that month. A gap that grows month after month is the earliest sign of a contract or payer problem.
- How it's worked out: total paid by the payer and patient, divided by the total expected for the same claims, by payer.
- Where it comes from: remittance files for what was paid, and your billing system's expected amount.
- When it moves: sort the gap by payer and drug. One payer and one drug usually explain most of it. Then check whether the cause is a rate change, a denial, or patient balances.
Charges, claims, expected payment, and collections explains why these are four different numbers.
2. Net collection rate: how much of what you could collect do you collect?
Net collection rate is the share of collectible money you actually collect after contractual adjustments. It tells you how much is lost to denials written off, timely-filing misses, and unpaid patient balances.
- How it's worked out: payments divided by charges minus contractual adjustments, for claims from the same service month.
- Where it comes from: your billing system and remittances.
- When it moves: wait until a service month is old enough to be mostly paid, then compare. If it drops, split the loss into write-offs by reason and patient balances not collected.
The infusion center KPI glossary gives the full definition and the common mistake of mixing service months with payment months.
3. Drug margin by drug and payer: what do you keep on each drug?
This is the single most important number for a buy-and-bill group, because drugs are most of the revenue. It shows what you keep on each drug, by payer, after what you paid for it.
- How it's worked out: drug payment received minus drug cost, per administration, for each drug and payer pair. Use real payments, not expected amounts.
- Where it comes from: remittance files for payment, distributor invoices for cost, and the EHR for units given and wasted.
- When it moves: check whether cost rose, payment fell, or waste grew. A drug that loses money with one payer may need a contract conversation, not a change in treatment.
The buy-and-bill margin calculator shows the math for one drug.
4. Drug bought but not billed: did every unit you bought reach a claim?
This number compares units purchased with units billed, units wasted and billed, units still on the shelf, and units written off. Whatever is left over is drug you paid for and cannot account for.
- How it's worked out: units purchased plus opening stock, minus units billed, billed waste, closing stock, and documented write-offs. Convert everything to billing units first.
- Where it comes from: distributor invoices, inventory counts, the EHR, and claims.
- When it moves: rank the gap by dollars and check the top drug first. Common causes are undocumented waste and visits that were given but never billed.
The drug inventory shrink guide has a worked example.
5. Unbilled completed visits: which visits have no claim yet?
This number shows completed administrations that still have no claim, older than your normal billing lag, in dollars. Every one is money you can still collect.
- How it's worked out: completed administrations with no matching claim line, older than your billing lag, multiplied by expected payment.
- Where it comes from: the EHR for completed visits, and the billing system for claims.
- When it moves: look at the oldest first, by site. A jump at one site usually means a staffing gap or a stuck charge.
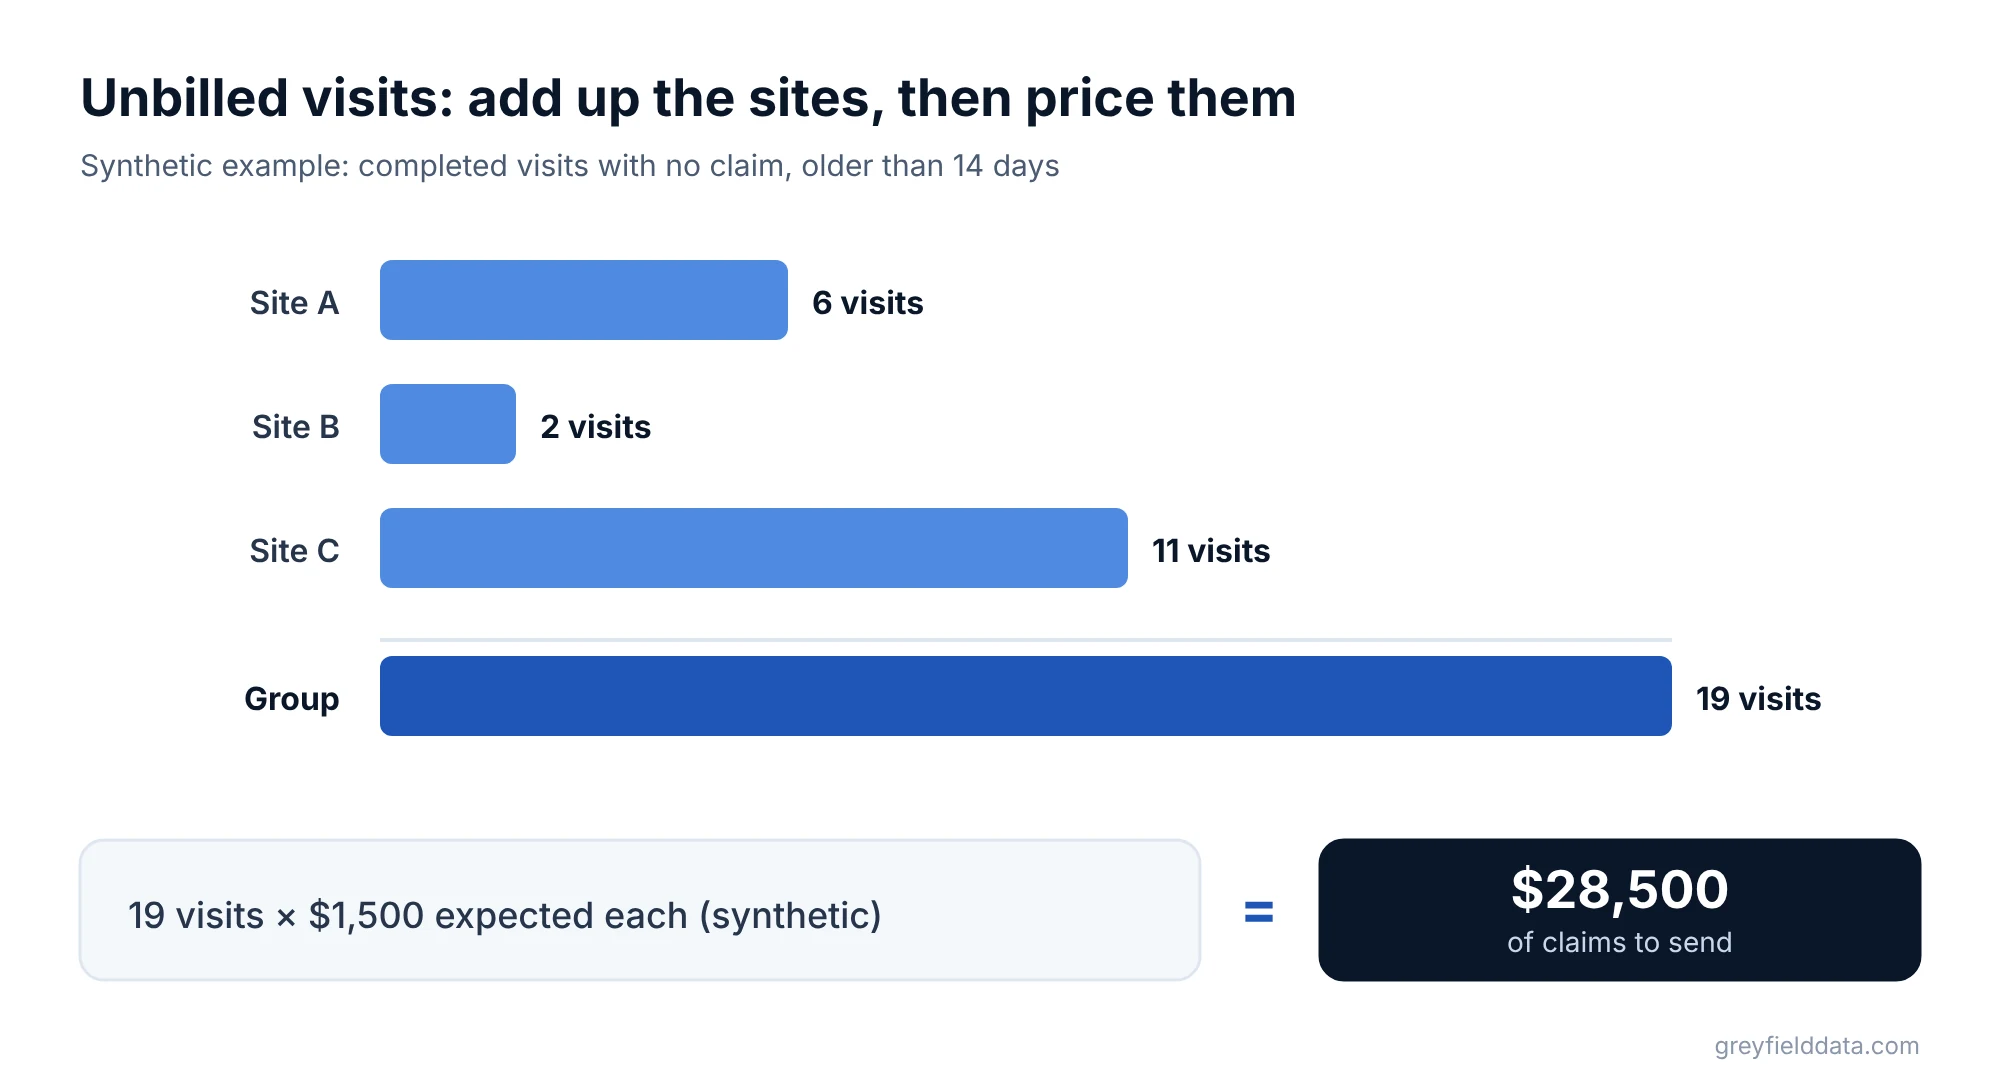
Synthetic example. One month, three sites report 6, 2, and 11 unbilled visits older than 14 days. At an expected $1,500 each (synthetic), that is 19 × $1,500 = $28,500 of claims to send. The revenue leakage calculator shows what each gap like this costs a year.
6. Denied dollars by payer and cause: which step of your workflow is costing money?
This number shows denied dollars for the month, grouped by payer and by the workflow step that caused them. Group causes into eligibility, authorization, coding, medical necessity, and process.
- How it's worked out: the sum of denied line amounts, using the reason codes on your remittances, excluding normal contractual adjustments.
- Where it comes from: remittance files.
- When it moves: find the largest cause and payer pair, then take it to the team that owns that step. Authorization denials go to intake, coding denials to billing.
The denial analysis guide shows how to group reason codes.
7. Underpayments against contract: are payers paying the agreed rate?
This number shows claims paid below the rate in your contract. Underpayments are easy to miss, because the claim looks paid.
- How it's worked out: the contracted rate for each drug and administration code, minus the amount paid, summed for lines paid below the rate.
- Where it comes from: remittances, plus your contract rates in a table. Many groups keep contract rates only in PDFs, which is why this number is often missing.
- When it moves: list underpaid claims by payer and code, and send them back for reprocessing. A pattern across many claims usually means the payer loaded the contract wrong.
For contracts written as a percentage of ASP, the rate changes every quarter with the Medicare file.
8. A/R over 90 days by payer: which balances are getting old?
This number shows open balances older than 90 days, split by payer and by payer versus patient. Old balances get harder to collect each month.
- How it's worked out: open balances older than 90 days from date of service, divided by total open A/R, for the group and each site.
- Where it comes from: your billing system's A/R aging.
- When it moves: check whether the growth is one payer, one site, or patient balances. Patient balances need a different team and approach than payer balances.
9. Labor cost per completed visit: what does each visit cost in staff time?
This number shows the staff cost behind each completed visit, by site. It shows whether a site is staffed for the visits it actually does.
- How it's worked out: clinical and front-office payroll for the site and month, divided by completed visits.
- Where it comes from: payroll, and the EHR for completed visits.
- When it moves: compare it with chair use at the same site. A high cost with low chair use usually means more staff than visits. The infusion staffing planner shows the hours each site needs for its volume.
10. Next quarter's drug price exposure: how will new Medicare rates change your margin?
This number shows how much your drug margin will change when the next quarterly Medicare payment limits take effect. CMS publishes the files ahead of each quarter (CMS ASP pricing files).
- How it's worked out: for your top 20 drugs, the new payment limit minus the current one, times your expected units next quarter.
- Where it comes from: the CMS ASP file and your expected volume by drug.
- When it moves: compare the new rate with your current cost. If a drug's margin falls, talk to your distributor or group purchasing organization before the first claim at the new rate.
The quarterly ASP update guide walks through the check. For the negotiated Medicare prices due to start in 2028, the Medicare negotiated price exposure calculator sizes the effect drug by drug.
How do you keep these numbers trusted?
Three rules keep them trusted across sites.
- Same definition at every site. Write each definition once and apply it to every site's records. The multi-site KPI rollup guide shows how.
- Group totals, not averages. Add up the parts, then divide. Averaging three sites' percentages gives the wrong answer when sites differ in size.
- Close first, then report. Run the numbers after the books close, and compare them with the general ledger. List any differences.
These rules are easiest with a data warehouse that copies every system into one place each night. The infusion data warehouse guide covers how it works and when it is worth it.
What to do next
Pick the three numbers you can't produce today and find out which systems they need. Most groups find that numbers 3, 4, and 7 need data they hold but have never joined.
The CFO's guide to an infusion data warehouse covers how to get these numbers from one place, and the infusion analytics resources cover each in more depth. For groups on WeInfuse, WeInfuse reporting services covers getting its data out; the WeInfuse reporting guide explains its reports. WeInfuse is a trademark of its owner. Greyfield Data is independent and not affiliated with WeInfuse. If you want these ten built for your group, book a call with me.
Frequently asked questions
What financial numbers should an infusion CFO track monthly?
Cash collected against expected, net collection rate, drug margin by drug and payer, and drug bought but not billed. Add unbilled visits, denied dollars by cause, underpayments, A/R over 90 days by payer, labor cost per visit, and next quarter's drug price exposure.
How is this list different from a board pack?
A board pack shows about ten headline numbers the board reviews. This list is the CFO's working set beneath it, used to explain why the headline numbers moved and what to do about it.
What is a good net collection rate for an infusion center?
I don't know of a reliable public benchmark for infusion centers. Track your own rate by service month over 13 months and compare sites with each other.
Why is drug margin by payer hard to get?
It needs three sources joined: distributor invoices for cost, remittance files for payer payments, and patient payments. They usually sit in different systems, so the number is often estimated from expected amounts instead.
How do you calculate group numbers across sites?
Add up each site's totals first, then divide. Never average site percentages, because a small site then counts as much as a large one.
Part of the Infusion analytics guides, a reading path through related articles.
Linus Tse
Founder of Greyfield Data. Built 400+ dashboards. Certified in Sigma, Snowflake, Tableau, and Power BI.
About Linus