The Infusion Center Metrics Playbook
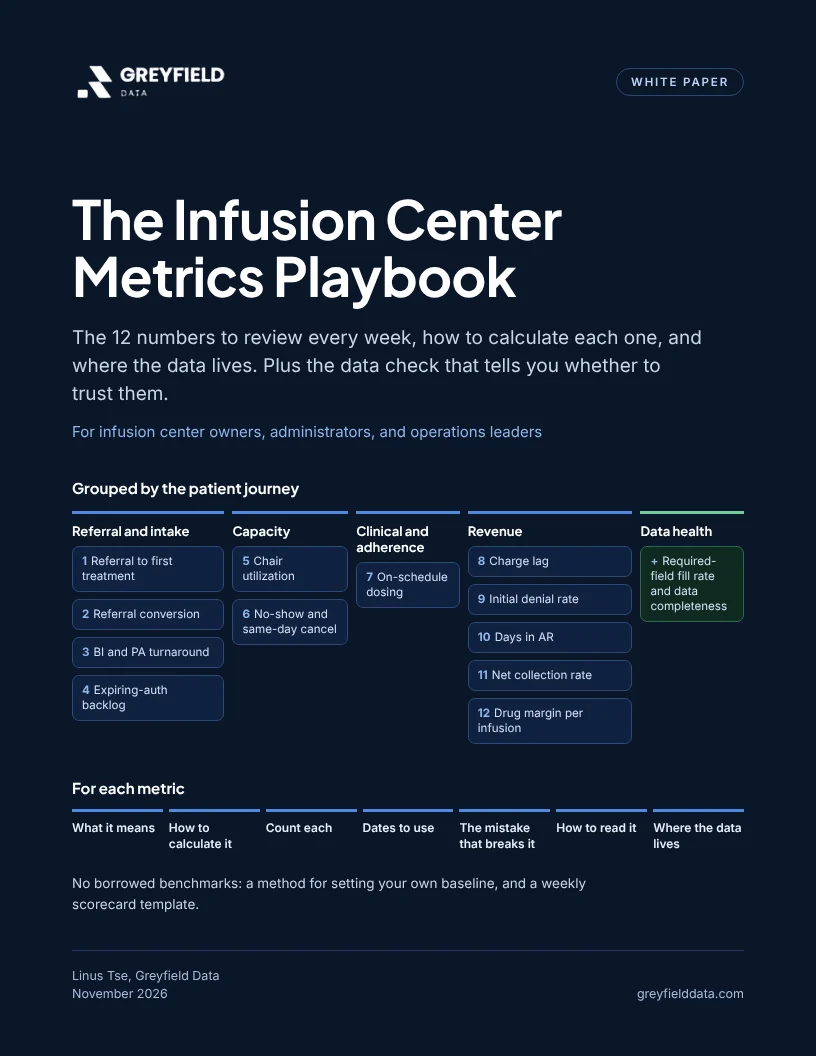
The 12 numbers to review every week, how to calculate each one, and where the data lives. Written for infusion center owners, administrators, and operations leaders, and the people who build their reports. No borrowed benchmarks: a method to set your own baseline instead.
Get the white paper
PDF, 17 pages, 190 KB
What's inside
Twelve metrics along the patient journey
Referral to first treatment, conversion, BI and PA turnaround, expiring authorizations, chair utilization, no-shows, on-schedule dosing, and five revenue metrics.
Definitions with no room for two answers
The formula in plain words, what to count, which dates and time zone to use, the mistake that breaks each metric, and how to read a change.
Where the data lives
Which numbers the infusion platform can answer and which need billing, remittance, or invoice data, with WeInfuse Explore and field names where verified.
Baseline and weekly scorecard
How to set your own baseline and decide when a number calls for action, a data check to run first, and a one-page weekly scorecard template.
Contents
- How to use this playbookpage 3
- The 12 metrics at a glancepage 4
- Referral and intake: metrics 1 to 4page 5
- Capacity: metrics 5 and 6page 7
- Clinical and adherence: metric 7page 8
- Revenue: metrics 8 to 12page 9
- Data health: the check that comes firstpage 12
- How to set a baselinepage 13
- Where the data usually livespage 14
- Running the weekly reviewpage 15
- Appendix: weekly scorecard templatepage 16