Why is our infusion denial rate so high? How to find the root cause
Group infusion denials by reason code, then cut by payer, drug, and site to see if the cause is eligibility, authorization, or coding, and what to fix first.

Written by Linus Tse, founder of Greyfield Data
· 10 min read
On this page 10 sections

Your infusion denial rate is high for a small number of reasons, and the remittance data already tells you which ones. Each denied line carries a claim adjustment reason code (CARC) and often a remark code (RARC). Group those codes into a few root-cause buckets, cut them by payer, drug, and site, and the pattern usually points to one stage of the workflow: eligibility, authorization, or coding.
I build denial reporting for ambulatory infusion centers from their remittance and operational data. The team then sees denied dollars by cause every week instead of a single rate once a quarter. If you want to see where denials sit among the other leaks, start with where infusion centers lose revenue between order and deposit.
Key takeaways
- A denial rate is meaningless until you say what you count: claims or lines, count or dollars, initial or final. Pick one definition and keep it.
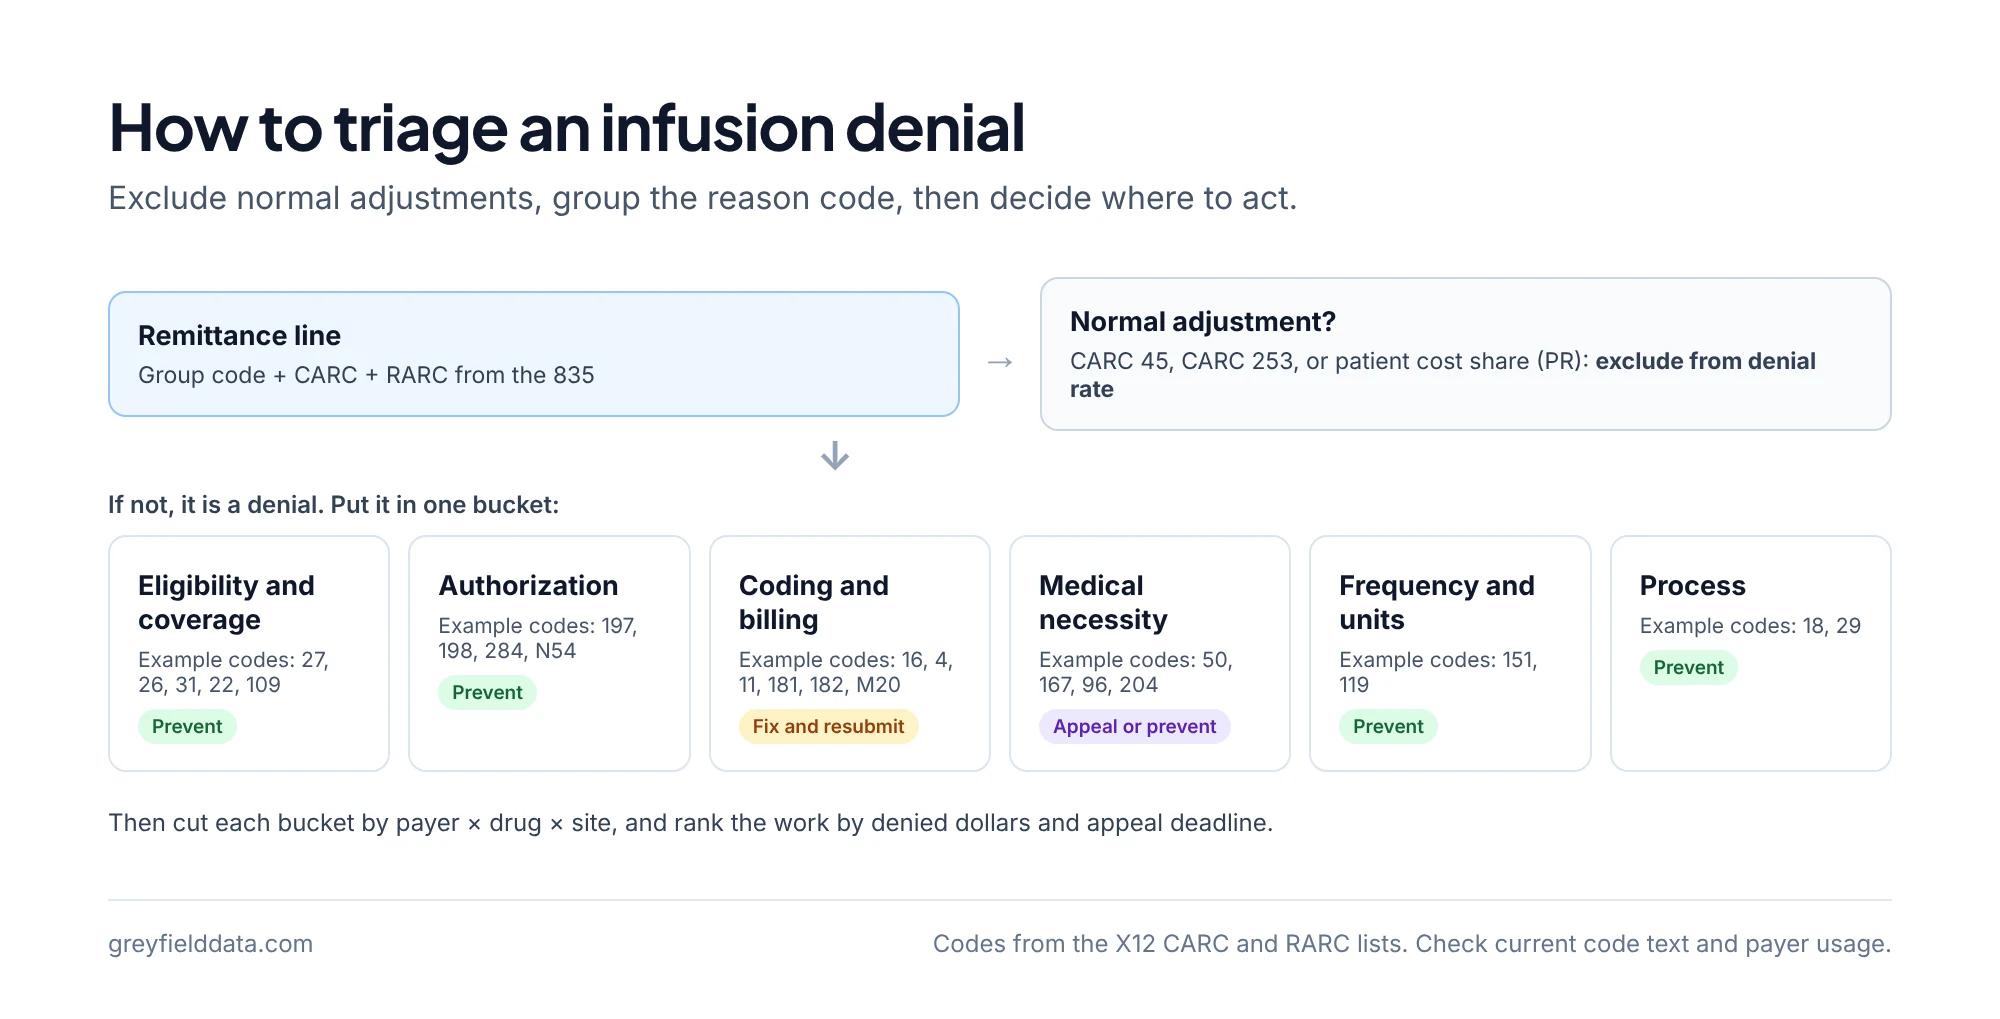
- Not every adjustment is a denial. CARC 45 (charge over the fee schedule) and CARC 253 (sequestration) are normal reductions, and counting them inflates the rate.
- Group reason codes into five or six root-cause buckets, such as eligibility, authorization, coding, medical necessity, and timely filing, before you look at payers or drugs.
- Cut each bucket by payer × drug × site. A denial problem that lives in one payer and one drug has a different fix from one spread across everything.
- Prevent what starts upstream (eligibility and authorization) and appeal what the payer got wrong. Rank the work by dollars, not by count.
Quick answers
- Prevent: eligibility, authorization, and frequency denials, at intake and authorization.
- Correct and resubmit: coding and billing denials.
- Appeal: medical necessity denials your documentation supports, and payer errors.
- Exclude from the rate: CARC 45, CARC 253, and patient responsibility.
- Data you need: 835 remittances, claim lines, and the authorization and intake record for each visit.
What counts as a denial?
A denial is a payer decision not to pay a claim or a line, reported on the 835 remittance with a group code and a CARC. Your team may call it a rejected claim or a payer refusal; the remittance codes are the same.
The group code says who owns the balance: CO (contractual obligation), PR (patient responsibility), OA (other adjustment), or PI (payer-initiated reduction). The CARC says why. Both lists are maintained by X12: the claim adjustment reason codes and the remittance advice remark codes.
Before you calculate anything, decide four things and write them down.
- Unit: claim or claim line. Infusion claims often have several lines (administration codes, drug, waste), and one line can be denied while the rest pay.
- Measure: count or dollars. A denied drug line can be worth many times a denied administration line.
- Timing: initial (first adjudication) or final (after appeals and resubmissions). Initial shows the process; final shows the money.
- Exclusions: which adjustment codes are not denials at all.
Which adjustments are not denials?
Some CARCs show up on almost every paid claim and should be excluded from the denial rate.
- CARC 45, "Charge exceeds fee schedule/maximum allowable or contracted/legislated fee arrangement." This is the normal write-down from your charge to the allowed amount.
- CARC 253, "Sequestration - reduction in federal payment." This is the Medicare sequestration reduction.
- Patient responsibility (deductible, coinsurance, copay) under group code PR. The payer processed the claim; the patient owes the balance.
If your denial rate includes these, it will look alarming and won't change no matter what the team does.
How do you group reason codes into root causes?
Group CARCs and RARCs into buckets that map to a step in your workflow, so each bucket has an owner.
The table below is a starting map, using code descriptions from the X12 lists. Check each code's current text and your payers' usage before you rely on it, because codes are added and deactivated. CARC 15, for example, was deactivated in 2018, so an old mapping table that still relies on it will miss authorization denials coded with CARC 197, 198, or 284.
| Bucket | Example codes (X12 description, shortened) | Workflow owner | Usually |
|---|---|---|---|
| Eligibility and coverage | 27 (expenses after coverage terminated), 26 (expenses before coverage), 31 (patient cannot be identified as insured), 22 (may be covered by another payer), 109 (not covered by this payer) | Intake and benefits investigation | Prevent |
| Authorization | 197 (authorization absent), 198 (authorization exceeded), 284 (authorization does not apply to billed services); RARC N54 (inconsistent with authorized services) | Prior authorization team | Prevent |
| Coding and billing | 16 (lacks information or has billing errors), 4 (procedure inconsistent with modifier), 11 (diagnosis inconsistent with procedure), 181 or 182 (code or modifier invalid on date of service); RARCs M20, M51, MA130 | Billing and charge capture | Fix and resubmit |
| Medical necessity and benefit | 50 (not deemed medically necessary), 167 (diagnosis not covered), 96 (non-covered charge), 204 (not covered under current benefit plan) | Intake, clinical, PA | Appeal or prevent |
| Frequency and units | 151 (information does not support this many or this frequency of services), 119 (benefit maximum reached) | Scheduling and PA | Prevent |
| Process | 18 (exact duplicate), 29 (time limit for filing has expired) | Billing | Prevent |
The buckets matter more than the codes. Once a line is in "Authorization", the question is no longer "what does 197 mean" but "why did we treat without a matching authorization".
Which cuts show the root cause?
After grouping, cut each bucket by payer, drug, and site. Three patterns come up again and again.
One payer, many drugs
If one payer accounts for most authorization denials across several drugs, the problem is usually that payer's process. Common causes are a portal you don't check, a renewal rule you don't track, or an authorization that covers fewer units or a shorter window than you schedule.
Read that payer's current policy and build its rules into your expiring authorizations report. The prior authorization denials by payer guide shows how to rank payers by refused requests.
One drug, many payers
If one drug is denied across payers, look at the drug's billing. Check unit conversion, the NDC on the claim, the JW or JZ modifier, the diagnosis codes that support it, and whether a new drug is still billed under a miscellaneous code. The JW and JZ modifier guide covers one common cause.
One site, many payers and drugs
If one site denies more than the others for the same payers and drugs, the cause is that site's workflow: intake staffing, documentation habits, or a different billing contact. This is the comparison most single-site reports can't make, and it is the one multi-site operators need most. The multi-site KPI rollup guide shows how to compare sites on the same definitions.
How do you calculate the denial rate correctly?
Use dollars at the claim-line grain for prioritizing, and counts for process tracking. Here is a worked example. The numbers are synthetic: they show the method, not a benchmark.
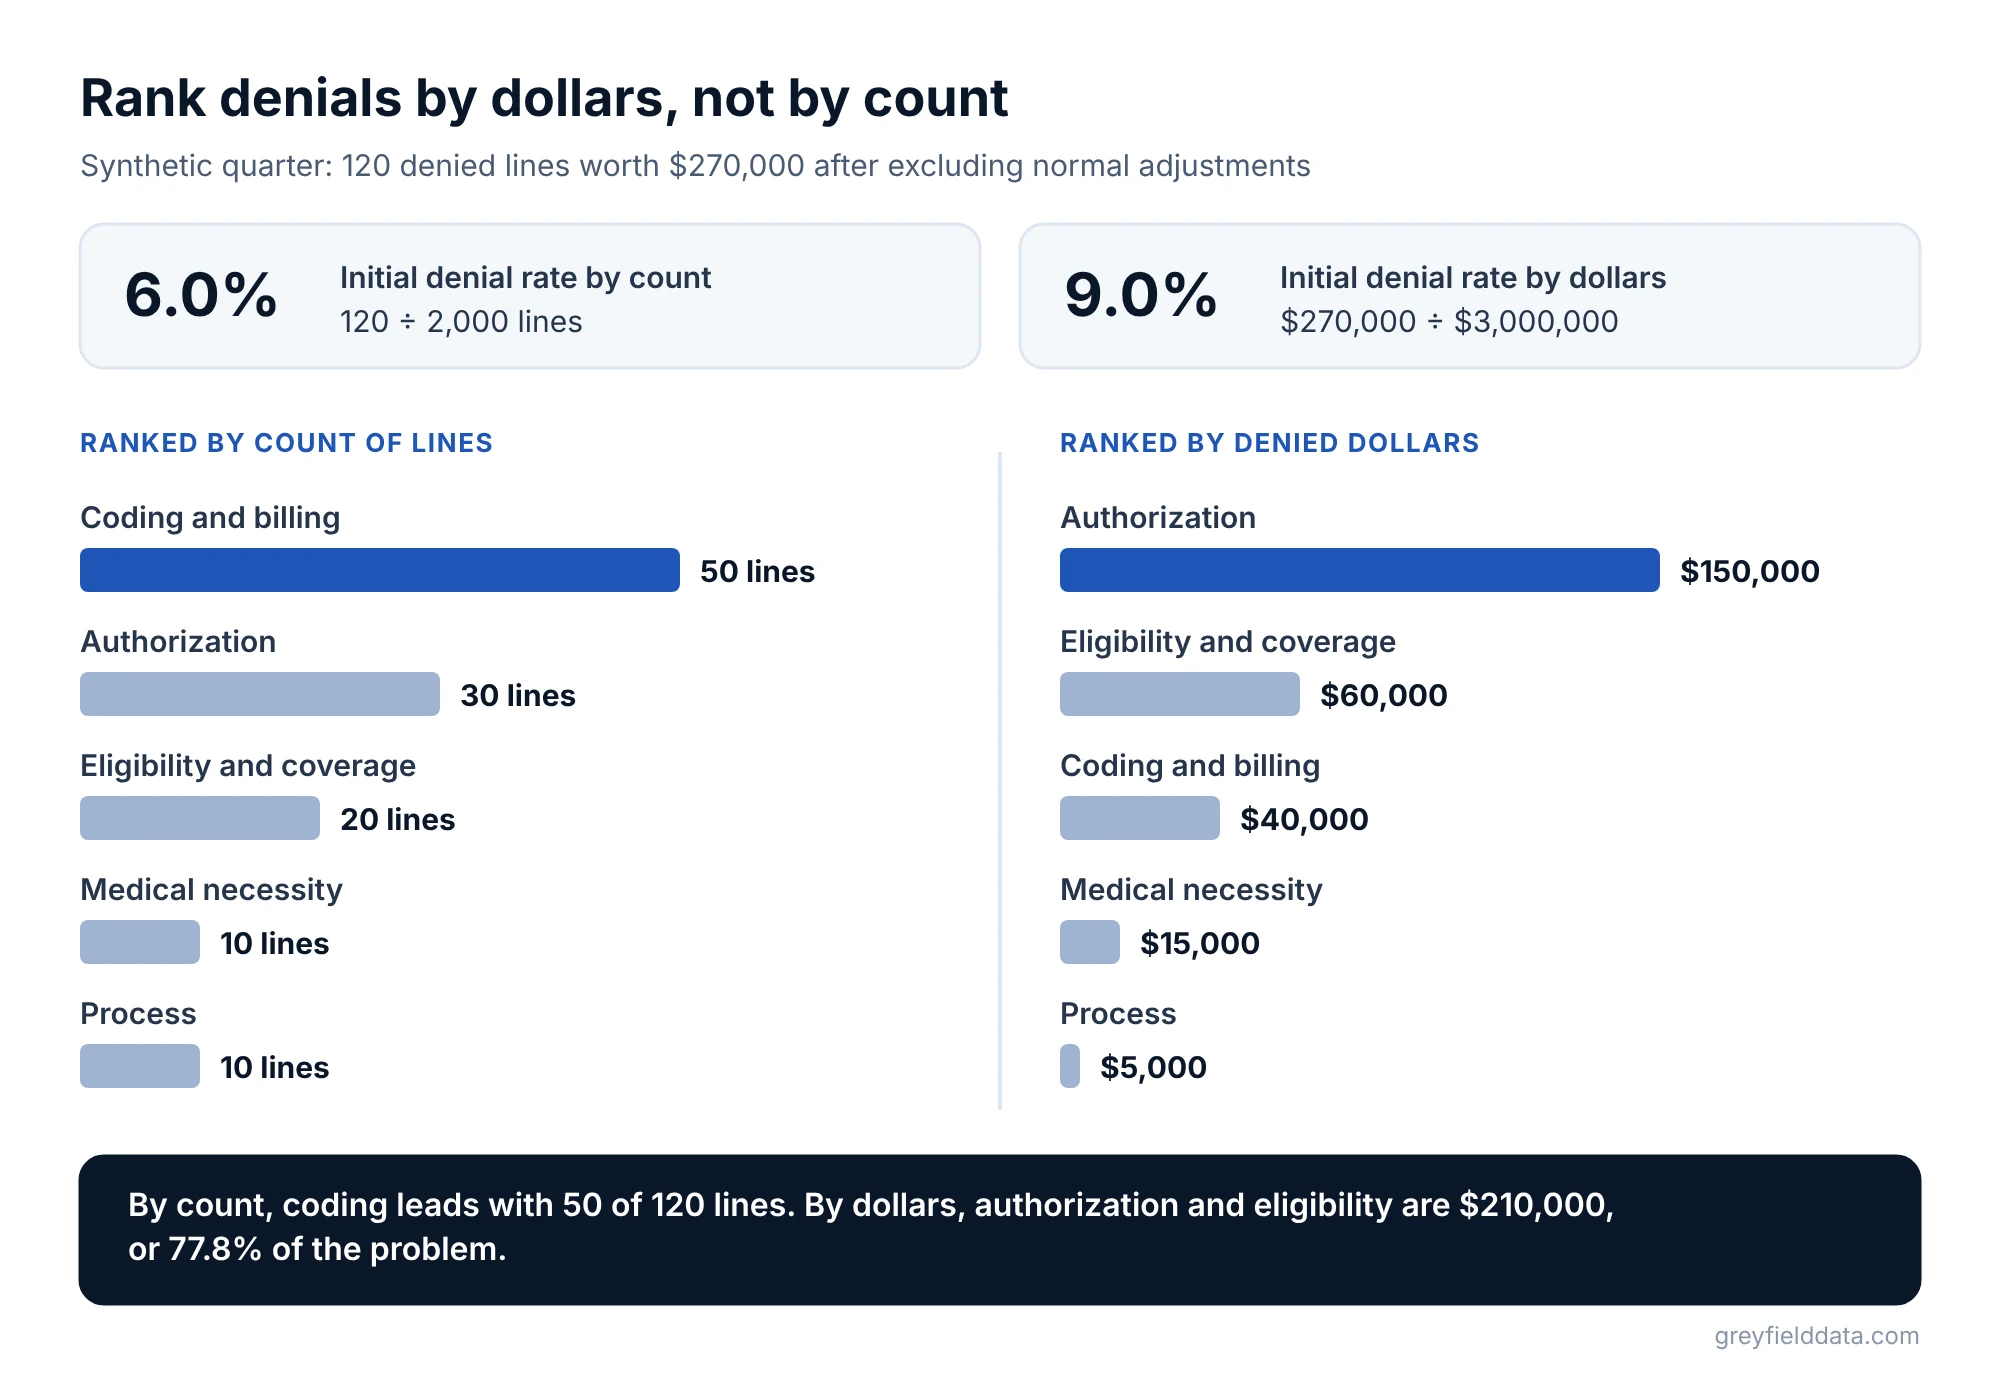
In one quarter a center submits 2,000 claim lines with $3,000,000 in expected reimbursement. After excluding CARC 45, CARC 253, and patient responsibility, 120 lines with $270,000 in expected reimbursement were denied on first adjudication.
- Initial denial rate by count: 120 ÷ 2,000 = 6.0%.
- Initial denial rate by dollars: $270,000 ÷ $3,000,000 = 9.0%.
The dollar rate is higher because denied lines skew toward drug lines. Here is how the $270,000 splits by bucket:
| Bucket | Lines | Denied dollars | Share of denied dollars |
|---|---|---|---|
| Authorization | 30 | $150,000 | 55.6% |
| Eligibility and coverage | 20 | $60,000 | 22.2% |
| Coding and billing | 50 | $40,000 | 14.8% |
| Medical necessity and benefit | 10 | $15,000 | 5.6% |
| Process | 10 | $5,000 | 1.9% |
| Total | 120 | $270,000 | 100% |
(Shares are rounded, so they add to 100.1%.)
By count, coding and billing is the biggest bucket: 50 of 120 lines. By dollars, authorization and eligibility together are $210,000 ÷ $270,000 = 77.8% of the problem. A team that ranks its work by count would spend most of its effort on the smaller-dollar bucket. The infusion revenue leakage calculator shows how denials compare with the other places money slips before the deposit.
Should you prevent denials or appeal them?
Prevent the denials that start upstream, and appeal the ones where the payer is wrong. A simple rule:
- Prevent eligibility, authorization, and frequency denials. They come from steps that happen before the visit, and an appeal rarely fixes a treatment given without coverage or a valid authorization. Track them back to the order and fix the intake or authorization step.
- Correct and resubmit coding and billing denials. They are usually fixable, but each one costs staff time and delays cash, so track the cause too.
- Appeal medical necessity denials when your documentation supports the treatment, and payer errors such as a valid authorization that was not applied.
Then rank the open work by dollars at risk and by deadline. An appeal that misses the payer's window becomes a timely filing write-off, which is the most avoidable loss in the whole cycle. The infusion denial prediction guide shows how to rank open claims by dollars at risk.
What data do you need for denial analysis?
You need the remittance data and a link back to the operational record.
- 835 remittances, parsed to claim-line grain with group code, CARC, RARC, allowed, paid, and adjusted amounts.
- Claims, with HCPCS and CPT codes, units, modifiers, NDC, place of service, and rendering and ordering provider.
- Operational data for the root cause: the authorization on file for that date of service, the coverage verified at intake, and the site and nurse who documented the visit.
The link back is what turns a denial report into a root-cause report. Without it you can see that authorization denials are high but not which orders, payers, or renewals caused them.
When billing runs outside your infusion EHR, the billing outside WeInfuse guide shows how to match each claim line to its visit. For several systems or sites, a single infusion data warehouse keeps that link in one place. If you work in WeInfuse, the WeInfuse reporting guide covers which Looker models hold orders and authorizations. Definitions for denial rate, clean claim rate, and the rest are in the infusion center KPI glossary. The free infusion data readiness check shows whether your data can make that link today.
WeInfuse is a trademark of its owner. Greyfield Data is independent and not affiliated with WeInfuse.
What to do next
Pull the last 90 days of remittances, exclude normal adjustments, and put every denied line into one of the buckets above. That alone tells you whether to start with intake, authorization, or billing.
The 12 weekly reports guide shows how to keep the denial view on a weekly cadence alongside expiring authorizations and unbilled visits. If you want help joining remittance data to your infusion EHR so every denial traces back to its order, see WeInfuse reporting help or book a call with me.
Frequently asked questions
What is a normal denial rate for an infusion center?
I don't know of a reliable public benchmark specific to infusion centers, and published figures rarely say whether they count claims or lines, or initial or final denials. Measure your own initial denial rate by dollars for a quarter, then track the trend by bucket.
How do I identify the root cause of infusion claim denials?
Group each denied line's CARC and RARC into a root-cause bucket, then cut the buckets by payer, drug, and site. Link each denial back to the order, authorization, and visit to see which step failed.
Which payer and drug combinations most often cause denials?
That depends on your payer contracts and therapy mix, so the answer comes from your own data. Build a payer × drug table of denied dollars by bucket, and the combinations that need attention will stand out.
Can infusion providers reduce denial rates without buying new software?
Often, yes. The remittance files and operational data you already have are enough to group denials by cause. Most root causes are fixed by changing an intake, authorization, or charge capture step rather than by adding a tool.
Do CARC 45 and CARC 253 count as denials?
No. CARC 45 is the normal reduction from your charge to the allowed amount, and CARC 253 is Medicare sequestration. Exclude both from your denial rate.
Part of the Infusion analytics guides, a reading path through related articles.
Linus Tse
Founder of Greyfield Data. Built 400+ dashboards. Certified in Sigma, Snowflake, Tableau, and Power BI.
About Linus