11 free tools for infusion center operators
Eleven free tools for infusion center operators: CMS drug price files, the NPI Registry, Medicare provider data, billing code lists, and five calculators.

Written by Linus Tse, founder of Greyfield Data
· 13 min read
On this page 18 sections

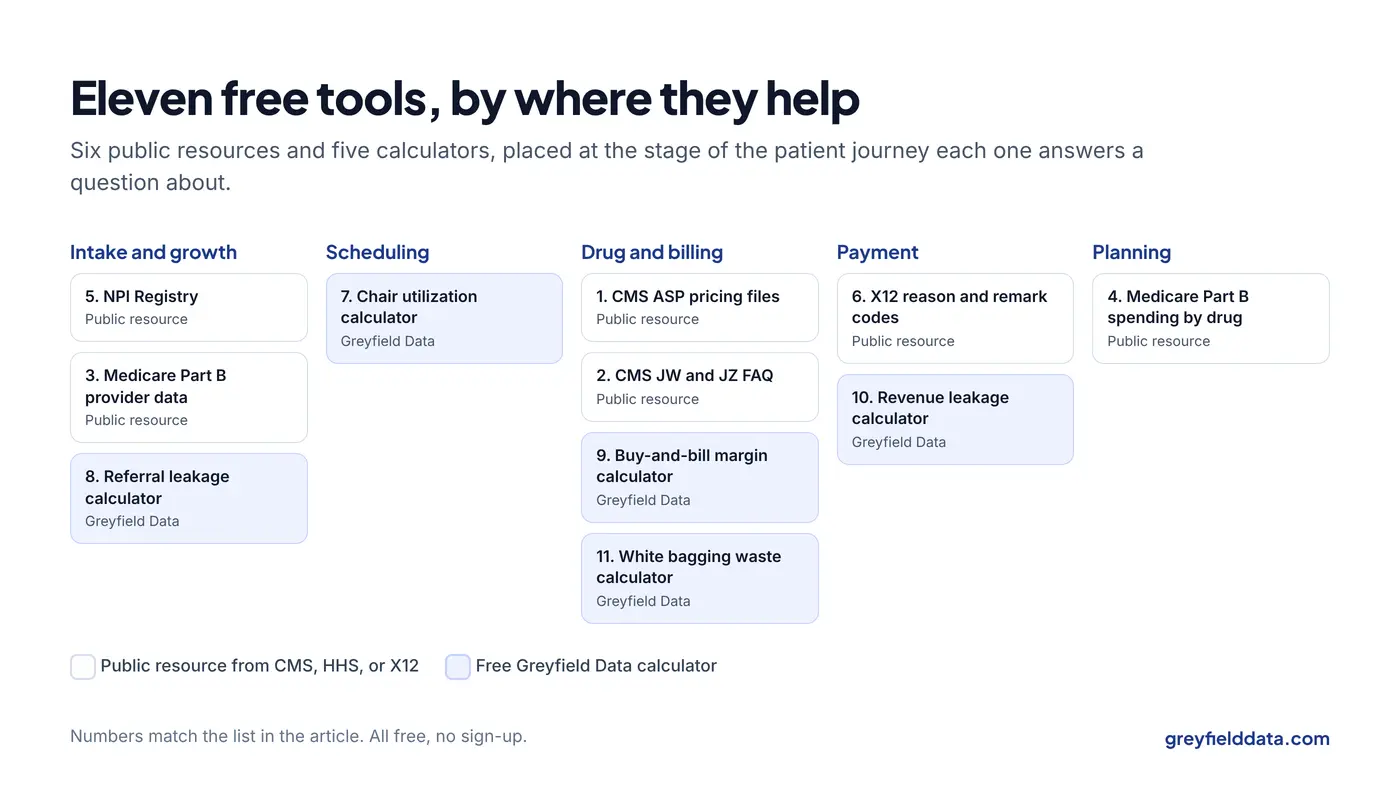
The most useful free tools for an infusion center operator are public files from CMS and the billing standards bodies, plus a few calculators that turn your own numbers into dollars. The CMS files show what Medicare pays for each drug, who gives and prescribes those drugs near you, and how waste must be billed. The calculators size chair capacity, lost referrals, drug margin, revenue leakage, and white bagging waste. All eleven below cost nothing and need no sign-up.
I build reporting for ambulatory infusion centers, and I use the public files on this list in that work. Five of the eleven are calculators I built at Greyfield Data. If you want one to start with, the infusion chair utilization calculator gives you a capacity baseline in about two minutes.
Disclosure. Entries 7 to 11 are Greyfield Data's own free tools. Entries 1 to 6 come from CMS, HHS, and X12, which have no connection to Greyfield. I checked every third-party link on November 6, 2026.
Key takeaways
- CMS publishes the Medicare payment limit for every separately payable Part B drug code each quarter. It is the starting point for any drug margin check.
- The NPI Registry and the Medicare provider-level files are free ways to find referring practices and competitors near you.
- The X12 reason code list and the CMS JW and JZ FAQ explain most of the codes on your denials and waste lines.
- A calculator with your own inputs is a first estimate, not a report. Use it to decide which number to measure properly next.
- Pair a public file with your own data. A file alone tells you about the market, and your data tells you about your center.
Quick answers
- Best for drug margin: the CMS ASP pricing files with the buy-and-bill margin calculator.
- Best for finding referral sources: the Medicare Part B provider file and the NPI Registry.
- Best for denials: the X12 claim adjustment reason code list.
- Best for capacity: the chair utilization calculator.
- Time needed: two to five minutes for each calculator; an afternoon for the CMS files the first time.
- Cost: all free, with no account needed.
Which free tool answers which question?
Each tool answers one question an operator asks. The table shows the question, who usually asks it, and what you need on hand.
| # | Tool | Question it answers | Best for | What you need |
|---|---|---|---|---|
| 1 | CMS ASP pricing files | What will Medicare pay per unit for this drug code? | Finance, billing | Your drug codes and units |
| 2 | CMS JW and JZ modifier FAQ | How must discarded drug be billed? | Billing, pharmacy | Your single-dose drugs |
| 3 | Medicare Part B provider and service data | Who gives these drugs near us, and how often? | Growth, sales | Drug codes and states |
| 4 | Medicare Part B spending by drug | Which drugs does Medicare spend most on? | Owners, finance | Nothing |
| 5 | NPI Registry and its API | Where does this clinician or practice work? | Intake, sales | A name, NPI, or specialty |
| 6 | X12 reason and remark code lists | What does this code on my remittance mean? | Billing | Codes from your remittances |
| 7 | Chair utilization calculator | How much chair time do we use? | Clinic managers | Chairs, hours, visits |
| 8 | Referral leakage calculator | How many referrals never start treatment? | Intake leads | Referrals and stage drop-off |
| 9 | Buy-and-bill margin calculator | What do we keep on one administration? | Finance | Cost, units, payment |
| 10 | Revenue leakage calculator | Where does a month of visits lose money? | Owners, revenue cycle | Visit and claim rates |
| 11 | White bagging waste calculator | What do unused white-bagged doses cost? | Pharmacy, owners | Doses, unused share, staff time |
1. CMS ASP pricing files: what will Medicare pay for each drug?
The CMS ASP pricing files list the Medicare Part B payment limit for each drug billing code, updated every quarter. For most separately payable drugs, that limit is the average sales price plus 6 percent (CMS ASP overview).
- What it does: gives the payment limit per billing unit for each code, plus a crosswalk from each NDC to its billing code. When I checked, the latest files were for October 2026.
- Who it's for: finance leads and billers who set drug margin targets or check payments.
- What you need: your top drug codes and the units you bill for each.
- Tip: keep every quarter's file, not just the latest. Comparing two quarters for your top 20 drugs shows a margin squeeze before the first claim at the new rate. The quarterly ASP update guide walks through that check.
2. CMS JW and JZ modifier FAQ: how must discarded drug be billed?
The CMS JW and JZ modifier FAQ is CMS's own answer sheet for billing drug waste from single-dose containers. JW reports the amount discarded, and JZ attests that nothing was discarded.
- What it does: explains when each modifier applies, how to split administered and discarded units, and what documentation CMS expects.
- Who it's for: billers, pharmacy leads, and nurses who document waste.
- What you need: a list of the single-dose drugs you give.
- Tip: check your own claims for single-dose drug lines with neither modifier. Those are the lines most likely to come back. The JW and JZ modifier guide shows the checks in plain words.
3. Medicare Part B provider and service data: who gives these drugs near you?
The Medicare Physician and Other Practitioners by Provider and Service file shows Medicare services and payments for each clinician, billing code, and place of service. The latest year published on data.cms.gov when I checked was 2024.
- What it does: shows which clinicians billed Medicare for the drug codes you infuse, how many services, and whether in an office or a facility.
- Who it's for: owners and referral development teams looking for practices to visit, and for competitors.
- What you need: your drug codes and the states you serve. The file is large, so filter it on the site or through its free API before downloading.
- Tip: the file covers traditional Medicare only, and it hides rows with very small patient counts. A practice that looks small may still be a good prospect. The guide to finding infusion prescribers with Medicare data covers the limits and how to build a target list.
4. Medicare Part B spending by drug: which drugs does Medicare spend most on?
The Medicare Part B Spending by Drug dataset shows national Medicare spending for drugs given in offices and other outpatient settings, by billing code. It includes average spending per dosage unit and how it changed over time.
- What it does: ranks Part B drugs by total spending and shows the trend. The annual dataset ran through 2024 when I checked. A quarterly version adds preliminary data, which CMS says may change with each release.
- Who it's for: owners and finance leads deciding which therapies to add or watch.
- What you need: nothing. It runs in the browser.
- Tip: spending is a national total, not your market. Use it to shortlist drugs, then check the provider file (entry 3) for your own region.
5. NPI Registry: where does a clinician or practice work?
The NPI Registry is the free public lookup for every National Provider Identifier, run by CMS. It shows each provider's name, practice address, phone number, and specialty (called taxonomy).
- What it does: looks up one clinician or practice, or searches by name, city, state, or specialty. A free API does the same searches for a spreadsheet or report.
- Who it's for: intake teams checking an ordering provider, and referral development teams building visit lists.
- What you need: a name, an NPI, or a specialty and a state.
- Tip: search the specialty "Clinic/Center, Infusion Therapy" with your state to list infusion clinics registered near you. In my test, the API returned at most 200 records per request, so narrow by city or ZIP code. Addresses are self-reported and can be out of date.
6. X12 reason and remark code lists: what does this code on my remittance mean?
The X12 claim adjustment reason code list is the official list of codes payers use to explain why a claim line was paid differently than billed. Its companion, the remittance advice remark code list, adds detail.
- What it does: gives the exact wording for each code, such as 197, "Precertification/authorization/notification/pre-treatment absent," and the group codes CO (contractual obligation), PR (patient responsibility), and OA (other adjustment).
- Who it's for: billers and revenue cycle leads sorting denials.
- What you need: the codes from your remittance files.
- Tip: not every code is a denial. Code 45 means the charge exceeds the fee schedule or contracted amount, a normal adjustment on most claims. The denial analysis guide shows how to group codes into causes you can fix.
7. Infusion chair utilization calculator: how much chair time do we use?
The chair utilization calculator is a Greyfield Data tool. It shows the share of open chair-hours you use, what no-shows cost in margin a year, and how many more infusions a week would reach your target.
- What it does: turns chairs, hours, days, visits, and chair time into used and available chair-hours.
- Who it's for: clinic managers and owners deciding whether to add chairs, hours, or staff.
- What you need: chairs, operating hours and days, scheduled infusions a week, average chair time, your no-show rate, and margin per infusion.
- Tip: if your chair times come from the schedule, call the result "scheduled utilization." Most systems store booked times, not when the patient sat down and left. For the staff side, the infusion staffing planner uses the same inputs to show whether chairs or nurses run out first.
8. Referral leakage calculator: how many referrals never start treatment?
The referral leakage calculator is a Greyfield Data tool. It shows how many referred patients never reach a first infusion, which step loses the most, and what that costs in margin a year.
- What it does: walks a month of referrals through intake, benefits, prior authorization, and scheduling.
- Who it's for: intake leads and owners who feel referrals slipping away but have no number for it.
- What you need: new referrals a month, treatments per patient a year, margin per treatment, and your best guess at the share lost at each step.
- Tip: if you have to guess the step rates, that is the finding. The referral-to-first-treatment guide shows the nine places to start a clock.
9. Buy-and-bill margin calculator: what do we keep on one administration?
The buy-and-bill margin calculator is a Greyfield Data tool. It shows the expected margin per administration after waste, patient responsibility, and collections, and how many visits one unpaid claim wipes out.
- What it does: compares drug cost with drug payment, waste payment, and the administration fee.
- Who it's for: finance leads and owners checking whether a drug or payer is worth carrying.
- What you need: cost per billing unit, units given and wasted, payment per unit, administration fee, and patient responsibility.
- Tip: run your top three drugs with the payment limit from the ASP file (entry 1). Then run the same drugs in the Medicare negotiated price exposure calculator to see the margin at a negotiated price.
10. Infusion revenue leakage calculator: where does a month of visits lose money?
The infusion revenue leakage calculator is a Greyfield Data tool. It walks one month from scheduled visits to money in the bank and shows the dollars lost at each step.
- What it does: applies your completion, billing, first-pass payment, and recovery rates to a month of scheduled visits, and names the biggest leak.
- Who it's for: owners and revenue cycle leads deciding where to put staff time first.
- What you need: scheduled visits, the share completed, expected payment per visit, and your billing and denial rates.
- Tip: if the biggest leak is visits that never happen, run the no-show cost calculator next. The revenue leakage guide explains each step.
11. White bagging waste calculator: what do unused white-bagged doses cost?
The white bagging waste calculator is a Greyfield Data tool. It estimates what white-bagged doses that are never given cost in a year, plus the staff time to receive, store, and track the shipments.
- What it does: multiplies doses received, the share unused, and value per dose, minus any credits, and adds handling time.
- Who it's for: pharmacy leads and owners preparing for a payer conversation about white bagging.
- What you need: white-bagged doses a month, the share unused, average value per dose, and staff minutes per shipment.
- Tip: compare your result with published research. An Avalere study funded by NICA and others surveyed 35 infusion organizations. It reported discarded white-bagged drug from about $35,000 to $652,000 per site a year, by organization size (Avalere report on infusioncenter.org). The authors warn against generalizing from that sample. The white bagging revenue guide covers what to track.
What else is free from Greyfield Data?
Two more tools help once the first numbers are in. The infusion data readiness check is ten plain questions that place your reporting in one of four stages. The infusion data assistant demo lets you ask a fictional center's synthetic data questions in plain English, such as which visits were never billed.
For a written reference, the infusion center metrics playbook is a free white paper with the 12 numbers to review each week and how to calculate each. The infusion center KPI glossary defines 30 metrics in one place.
How do you get the most from free tools?
Use each one to decide what to measure next, not as the final answer.
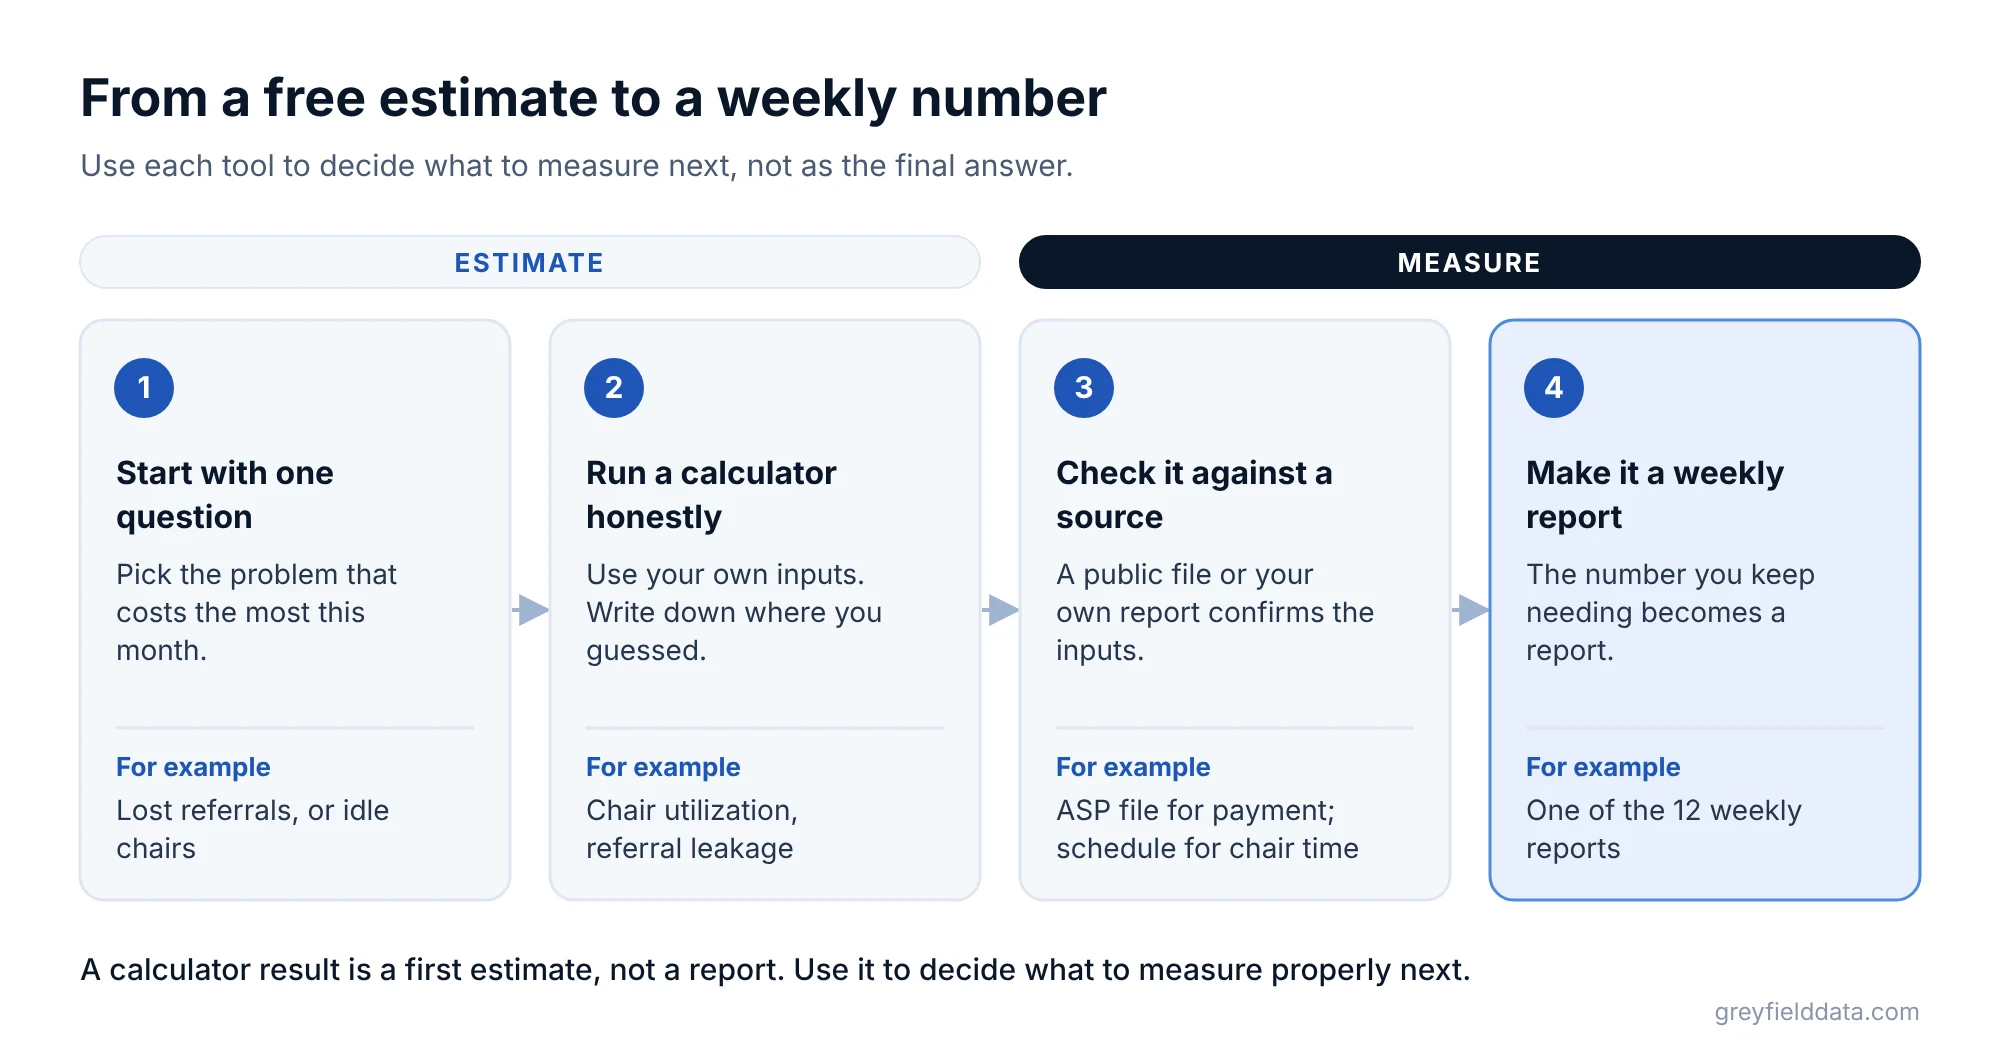
- Start with one question. Pick the problem that costs the most this month, such as lost referrals or idle chairs.
- Run the calculator with honest inputs. Where you guess, write down that you guessed.
- Check it against a public file or your own report. The ASP file checks your payment assumption. Your schedule checks your chair time.
- Turn the estimate into a weekly report. The 12 weekly reports guide lists the report behind each number.
If you run WeInfuse, many of those weekly reports can be built from its own Looker reports. The WeInfuse reporting guide explains where to start. WeInfuse is a trademark of its owner. Greyfield Data is independent and not affiliated with WeInfuse.
What to do next
Run the chair utilization calculator and the referral leakage calculator this week, and download the current ASP file for your top drugs. Those three cover capacity, the front of the funnel, and drug margin.
When the estimates point to a number you need every week, infusion analytics guides show how to build it. If you want it built on your own data, see WeInfuse reporting services or book a call with me.
Frequently asked questions
Are CMS drug pricing and provider files free to use?
Yes. CMS publishes the ASP pricing files on cms.gov and the provider files on data.cms.gov at no cost, and the NPI Registry is a free public lookup. Read each file's notes and data dictionary before you rely on a column.
Where do I find what Medicare pays for an infused drug?
Download the latest quarterly ASP pricing file from CMS and look up the drug's billing code. For most separately payable drugs, the payment limit is the average sales price plus 6 percent, per billing unit.
How do I find infusion centers near me with free data?
Search the NPI Registry for the specialty "Clinic/Center, Infusion Therapy" in your state. Then check the Medicare Part B provider file for practices that give infused drugs in their own offices.
Are the Greyfield Data calculators really free?
Yes. They run in your browser with no sign-up, and they show the math. Use your own numbers, and treat the result as an estimate to check against your reports.
What does CARC 45 mean on an infusion claim?
Code 45 means the charge exceeds the fee schedule, maximum allowable, or contracted amount. It is usually a normal contractual adjustment, not a denial, so leave it out of your denial rate.
Part of the Infusion analytics guides, a reading path through related articles.
Linus Tse
Founder of Greyfield Data. Built 400+ dashboards. Certified in Sigma, Snowflake, Tableau, and Power BI.
About Linus