12 reports every infusion center should run weekly
Twelve weekly infusion center reports, from referral pipeline to denials by payer, each with the question it answers, its grain, and a common mistake.

Written by Linus Tse, founder of Greyfield Data
· 11 min read
On this page 20 sections

An infusion center needs a short set of weekly reports that each answer one question someone will act on that week. The questions are which referrals are stuck, which authorizations are about to expire, which visits haven't been billed, and where denials are coming from. Twelve reports cover the path from referral to cash for most centers.
I build these reports for infusion providers, often on top of WeInfuse's embedded Looker as part of WeInfuse reporting work. The same mistakes come up every time: the wrong grain, the wrong date, or a status filter nobody wrote down. If chair capacity is your first question, the infusion chair utilization calculator gives you a baseline in a minute.
Key takeaways
- A weekly report earns its place when it answers one question and has one owner who acts on it. If nobody acts, cut it.
- Write the grain for every report: one row per order, appointment, administration, authorization, claim line, or inventory item. Most wrong numbers come from mixing grains.
- Five of the twelve reports protect revenue before the claim exists: referral pipeline, expiring authorizations, due but unscheduled patients, unbilled visits, and waste units.
- Utilization from schedule data is scheduled utilization. Label it that way unless you have real check-in and check-out times.
- Denials, AR, and payment data usually live outside the infusion EHR, so the revenue reports need remittance and billing data joined in.
Quick answers
- Build first: unbilled completed visits, expiring authorizations, and the referral pipeline.
- Quickest money back: unbilled completed visits, because every row is a claim you can still send.
- When to run them: every Monday, so each list is worked that week.
- How many numbers on the dashboard: eight to twelve, each with an owner.
How did I choose these twelve?
Each report had to pass three tests: someone can act on it within the week, it maps to one stage between referral and deposit, and it can be built from data most centers already have. The stages come from where infusion centers lose revenue between order and deposit, and the metric definitions from the infusion center KPI glossary.
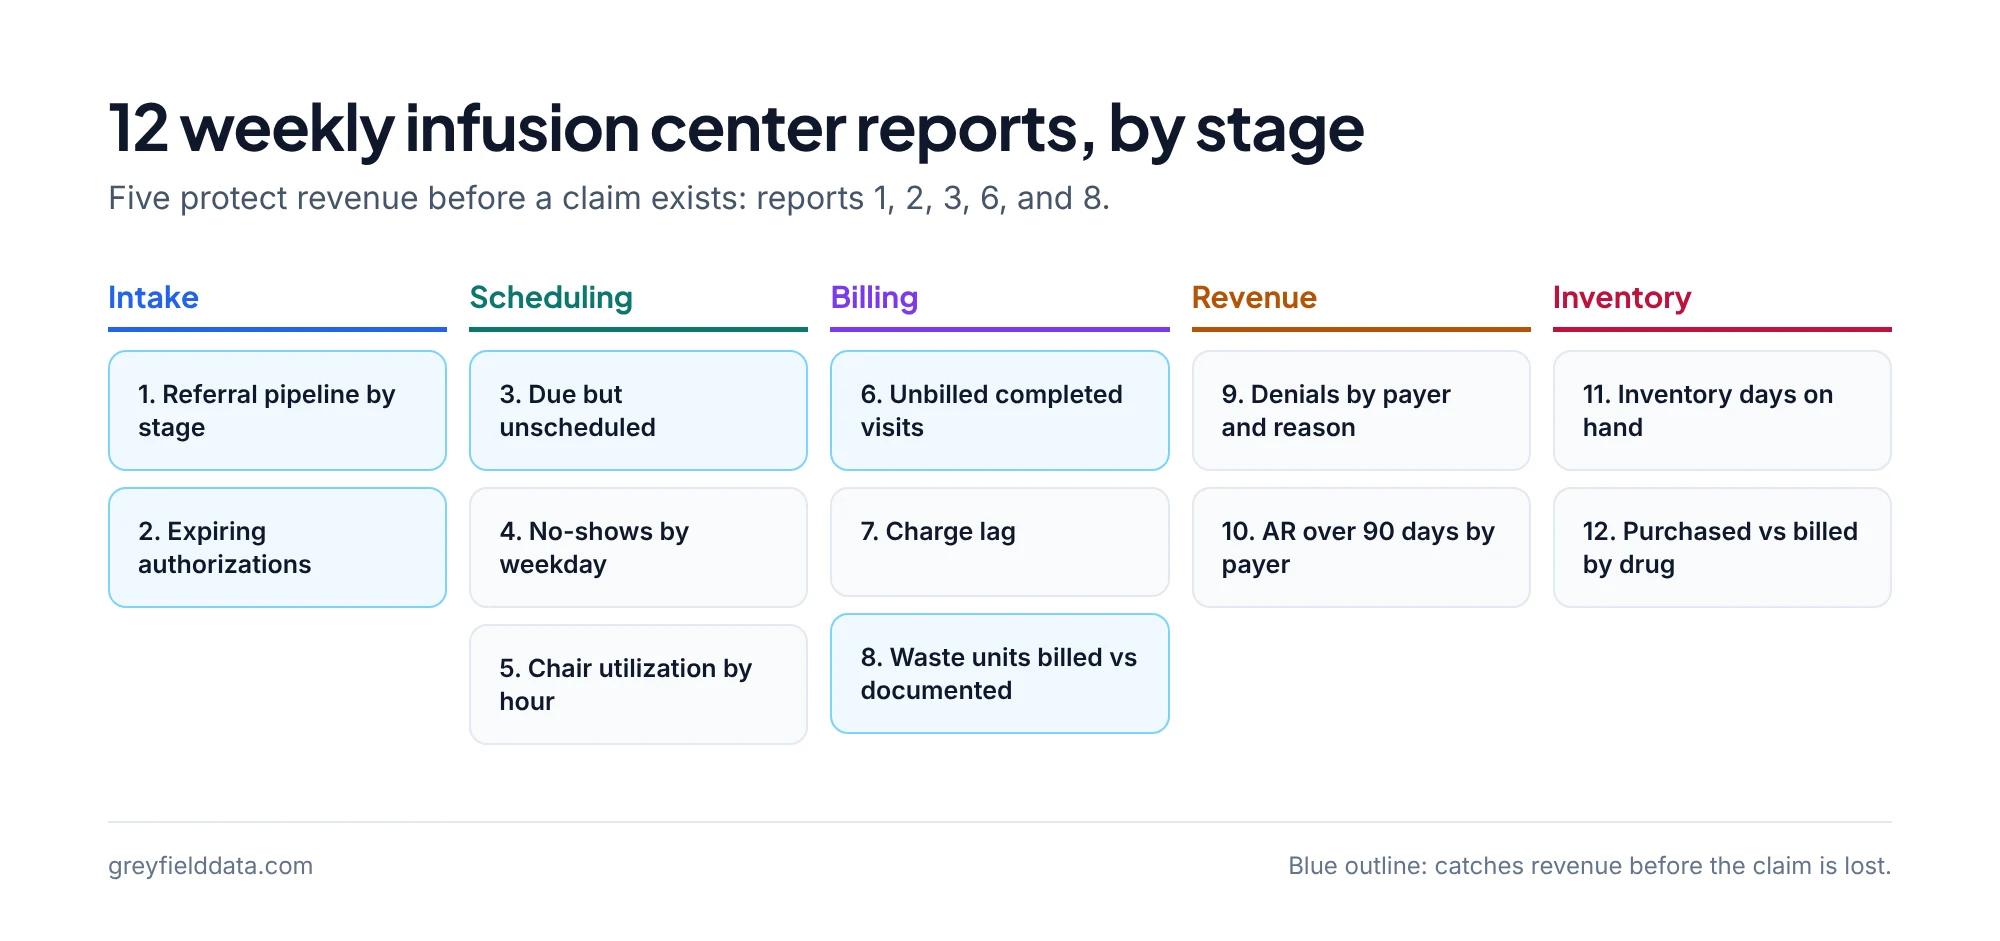
What are the 12 weekly infusion center reports?
They run from referral pipeline to purchased versus billed drug, in the order money moves. The table gives each report's question, what one row counts, and who owns it.
| # | Report | Question it answers | Grain | Owner |
|---|---|---|---|---|
| 1 | Referral pipeline by stage | Where are new referrals stuck? | Order | Intake lead |
| 2 | Expiring authorizations | Whose authorization runs out before their next dose? | Authorization | PA team |
| 3 | Due but unscheduled | Who needs a dose and has nothing booked? | Order series | Scheduling |
| 4 | No-shows and cancellations by weekday | Which days lose the most visits? | Appointment | Clinic manager |
| 5 | Chair utilization by hour | When are chairs idle or overbooked? | Chair × hour | Clinic manager |
| 6 | Unbilled completed visits | Which visits happened but have no claim? | Administration | Billing |
| 7 | Charge lag | How long from visit to claim? | Claim | Billing |
| 8 | Waste units billed vs documented | Is discarded drug reaching the claim? | Drug × week | Billing |
| 9 | Denials by payer and reason | Which payers deny what, and why? | Claim line | Revenue cycle lead |
| 10 | AR over 90 days by payer | Which balances are getting old? | Claim balance | Revenue cycle lead |
| 11 | Inventory days on hand | Are we holding too much or too little drug? | Location × NDC | Pharmacy or inventory lead |
| 12 | Purchased vs billed by drug | Did every vial we bought end up billed, wasted, or on the shelf? | Drug × week | Finance |
1. Referral pipeline by stage: where are new referrals stuck?
This report shows every open referral and the stage it is in: received, intake, benefits investigation, prior authorization, scheduling, or waiting for drug.
- Answers: where are referrals stuck, and for how long?
- Grain: one row per order, with the current stage and days in that stage.
- Common mistake: building it from appointments. An order with no appointment yet won't appear, and those are exactly the stuck ones. In WeInfuse, that means starting from the orders model rather than the appointments model; the WeInfuse reporting guide explains the difference. The referral-to-first-treatment guide breaks the pipeline into nine stall points.
2. Expiring authorizations: whose approval runs out before the next dose?
A list of active patients whose authorization expires in the next 14 and 30 days, with their next scheduled dose.
- Answers: which renewals must start this week to avoid treating without an authorization?
- Grain: one row per authorization, joined to the patient's next appointment.
- Common mistake: filtering on statuses that "sound right." Authorization task statuses differ between centers, so get the exact list of included statuses agreed with the PA team and write it on the report. The expiring authorizations report guide walks through the build in WeInfuse.
3. Due but unscheduled: who is about to miss a dose?
Patients on an active order who are due for their next dose within the dosing interval and have no future appointment.
- Answers: who is about to miss a dose?
- Grain: one row per active order series, with the last completed dose date and the expected next date.
- Common mistake: confusing treatments remaining with refills or approved supply. Treatments remaining on an order is a count of planned doses, not proof the drug or the authorization is in place.
4. No-shows and cancellations by weekday: which days lose the most visits?
No-shows, same-day cancellations, and earlier cancellations, by weekday and site, with the share rebooked.
- Answers: which days and sites lose the most visits, and do we recover them?
- Grain: one row per appointment.
- Common mistake: putting rescheduled appointments in the same bucket as true no-shows. Keep the cancellation reason and the rebooked flag, or the rate will overstate lost visits. The infusion no-show cost calculator turns the rate into dollars.
5. Chair utilization by hour: when are chairs idle or overbooked?
Booked chair-minutes divided by available chair-minutes, for each hour of each weekday.
- Answers: when are chairs idle, and when are they overbooked?
- Grain: one row per chair per hour slot.
- Common mistake: calling it actual utilization. Most schedule data carries scheduled start and end times, not check-in and check-out. If that is what you have, label the report "scheduled utilization." The chair utilization calculator shows the math.
6. Unbilled completed visits: which visits have no claim yet?
Completed administrations with no claim, older than your normal charge lag.
- Answers: which visits happened and still haven't been billed?
- Grain: one row per administration.
- Common mistake: counting check-ins as billable visits. A visit where no drug was given may not be billable, so filter to completed administrations, not arrived appointments. If billing runs in another system, the billing outside WeInfuse guide shows how to match visits to claims.
7. Charge lag: how long does a visit wait for its claim?
Days from date of service to claim submitted, by site and biller, as a median and a 90th percentile.
- Answers: are claims going out promptly, and is one site or biller slower?
- Grain: one row per claim.
- Common mistake: reporting only the average. A few very old claims can hide behind a good average; the 90th percentile shows them.
8. Waste units billed vs documented: is discarded drug reaching the claim?
Billed JW units compared with waste documented in the chart, and with vials removed from inventory, by drug and week.
- Answers: is discarded drug from single-dose containers reaching the claim?
- Grain: one row per drug per week.
- Common mistake: summing units by NDC instead of by HCPCS code. Billing units belong to the HCPCS code, and one code can cover several NDCs and vial sizes. The JW and JZ modifier guide covers the billing rules.
9. Denials by payer and reason: which payers refuse what, and why?
Denied dollars and lines for the last 90 days, by payer and root-cause bucket (eligibility, authorization, coding, medical necessity, process).
- Answers: which payers deny what, and which step of our workflow causes it?
- Grain: one row per claim line with its adjustment codes.
- Common mistake: counting normal adjustments, such as CARC 45 (charge over the fee schedule), as denials. The denial analysis guide shows how to group reason codes, and the prior authorization denials by payer guide covers authorization refusals.
10. AR over 90 days by payer: which balances are getting old?
Open balances older than 90 days, by payer, with the last action taken.
- Answers: which balances are aging, and is anyone working them?
- Grain: one row per open claim balance.
- Common mistake: mixing payer and patient balances. They are worked by different people with different tools, so split them. Charges, claims, expected payment and collections explains which balance is which.
11. Inventory days on hand: are we holding too much or too little drug?
Inventory value on hand divided by average daily drug use, by location and drug.
- Answers: are we tying up cash in drug, or at risk of running out before scheduled doses?
- Grain: one row per location and NDC, at a weekly snapshot.
- Common mistake: including lot in the grain. Lots create rows that look like duplicates. Consolidate to location, NDC, and date before computing balances. The WeInfuse inventory report guide shows the fields to use.
12. Purchased vs billed by drug: did every vial we bought get billed?
Units purchased, compared with units billed (administered plus waste), units on the shelf, and units written off, by drug and week.
- Answers: did every unit we bought end up billed, wasted and billed, still on the shelf, or written off?
- Grain: one row per drug per week, converted to billing units.
- Common mistake: treating "used inventory" as "billed." Inventory removed for a completed visit still needs a claim line to become revenue. The infusion drug inventory shrink guide has a worked example.
Which reports should you build first?
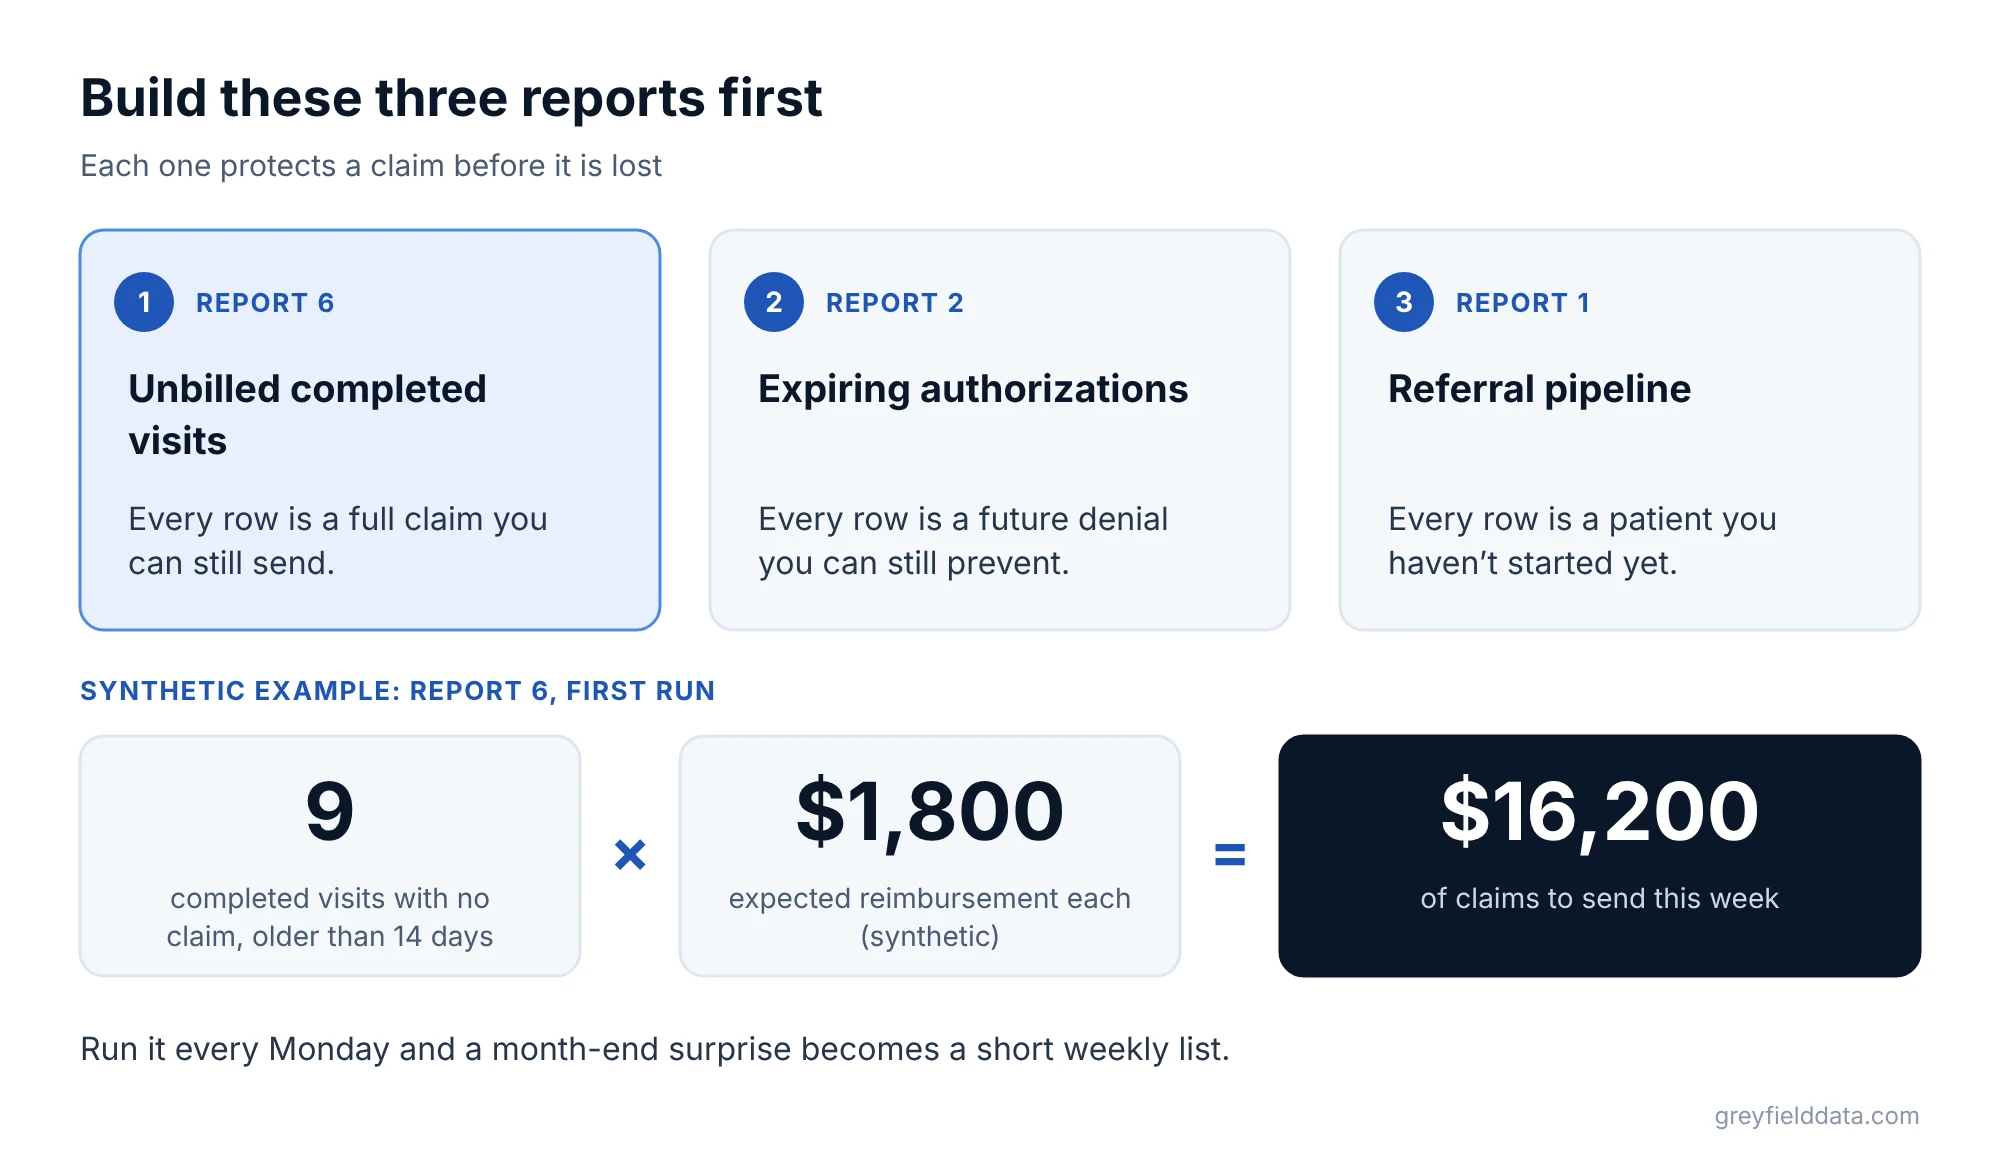
If you can build only three this month, build the ones that protect a claim before it is lost:
- Unbilled completed visits (report 6). Every row is a full claim you can still send.
- Expiring authorizations (report 2). Every row is a future denial you can still prevent.
- Referral pipeline (report 1). Every row is a patient you haven't started yet.
A worked example of the impact
Synthetic example. A center runs report 6 for the first time and finds 9 completed administrations with no claim, older than 14 days. If each carries an expected reimbursement of $1,800 (synthetic), that is 9 × $1,800 = $16,200 of claims to send this week. Running the same report every Monday turns a month-end surprise into a short weekly list. The infusion revenue leakage calculator estimates what each gap like this costs per month.
How do you keep weekly reports trusted?
Three habits keep the numbers believable:
- Write the definition on the report. Grain, date field, included statuses, and exclusions, in one line under the title.
- Check the feed, not just the report. A scheduled export can succeed and still skip a window or leave required fields blank. Track row counts by week and flag sudden drops. The guide to scheduling WeInfuse reports covers the setup.
- Keep one owner per report. If a report has no owner, nobody acts on it, and it quietly stops being trusted. To see how far your reporting has come overall, take the infusion data readiness check.
WeInfuse is a trademark of its owner. Greyfield Data is independent and not affiliated with WeInfuse.
What to do next
Pick the three starter reports, write each definition in one line, and run them every Monday for a month. The infusion center metrics playbook shows the weekly scorecard these reports feed.
Use the chair utilization calculator for a capacity baseline, and the referral leakage calculator to size the front of your funnel. If you want these twelve built on your WeInfuse and billing data, with the definitions agreed up front, book a call with me.
Frequently asked questions
What reports should an infusion center run every week?
Start with referral pipeline, expiring authorizations, due but unscheduled patients, unbilled completed visits, and denials by payer and reason. Add capacity, AR, and inventory reports once those are trusted.
What is the difference between a report's grain and its filter?
The grain is what one row represents, such as an order or an appointment. The filter decides which rows are included. Changing the grain changes what you are counting; changing a filter only changes which rows you count.
Can I build these reports in WeInfuse?
Many of the operational reports (pipeline, authorizations, scheduling, unbilled visits, inventory) can be built from WeInfuse's Looker models. Denials and AR usually need remittance and billing data from outside, joined at the claim-line grain.
How many KPIs should an infusion center dashboard have?
Fewer than you think. A weekly view of eight to twelve numbers, each with an owner, is easier to act on than a page of thirty. The KPI glossary lists the candidates.
Part of the Infusion analytics guides, a reading path through related articles.
Linus Tse
Founder of Greyfield Data. Built 400+ dashboards. Certified in Sigma, Snowflake, Tableau, and Power BI.
About Linus