Prior authorization denials by payer: are your appeals winning?
Track infusion prior authorization denials by payer and drug, how often you appeal, how often you win, and how many patients never start after a denial.

Written by Linus Tse, founder of Greyfield Data
· 8 min read
On this page 9 sections
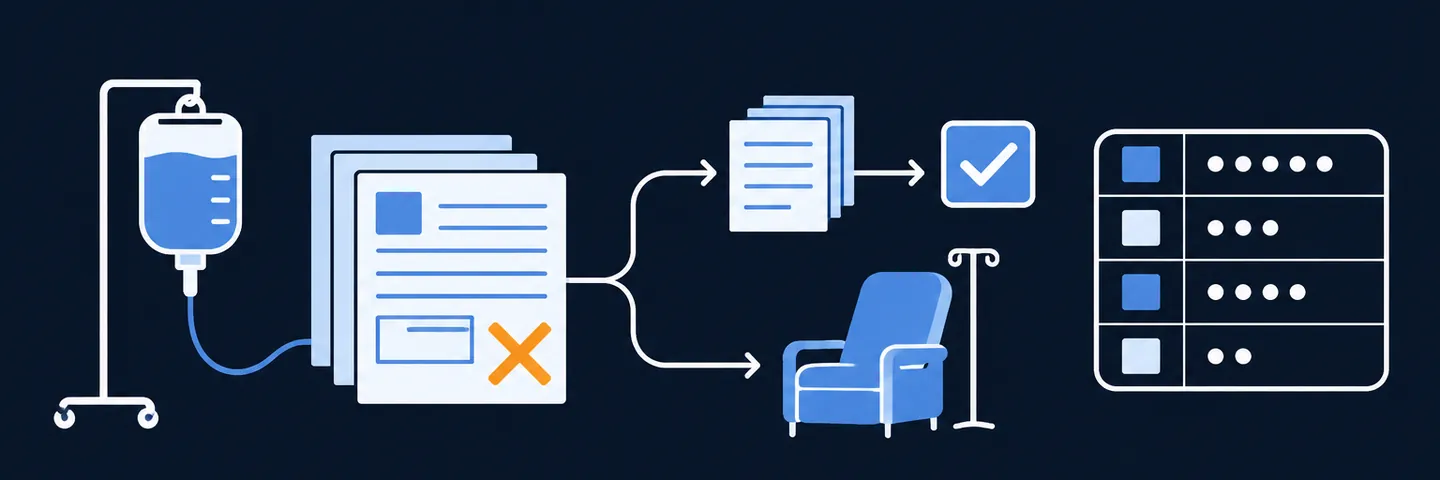
To see which payers are costing you patients, count every prior authorization request by payer and drug. Then track four numbers: how often the first answer is a denial, how often you appeal, how often the appeal wins, and how many patients never start treatment after a denial. Public data on Medicare Advantage plans shows most appealed denials are overturned, yet few are appealed. If your own numbers look the same, the cheapest new patients you'll find are the ones you stopped fighting for.
I build reporting for ambulatory infusion centers that follows each referral from authorization to first infusion, so intake leads can see where patients drop out. To put a dollar figure on patients who never start, try the referral leakage calculator. More on this work is on the infusion analytics page.
Key takeaways
- A prior authorization denial is not a claim denial. It happens before treatment, and the cost is a patient who may never start, not a claim that goes unpaid.
- Four numbers by payer and drug: initial denial rate, appeal rate, overturn rate, and patients who never started after a denial.
- Most appealed denials win, at least in Medicare Advantage. KFF found 80.7% of appealed Medicare Advantage prior authorization denials in 2024 were partly or fully overturned, but only 11.5% of denials were appealed.
- Days to decision matter too. Since January 1, 2026, a federal rule sets decision deadlines for Medicare Advantage and several other payer types. Measure how long your payers actually take.
- The best target is the payer with a high win rate and a low appeal rate. That gap is patients you could have treated.
Quick answers
- Initial denial rate: denied requests ÷ all requests, by payer and drug.
- Appeal rate: appealed denials ÷ all denials.
- Overturn rate: appeals won ÷ appeals filed.
- Decision deadlines since 2026: 72 hours for urgent and seven calendar days for standard requests, for Medicare Advantage, Medicaid and CHIP.
- How often to review: the payer scorecard quarterly, and patients who never started after a denial monthly.
How is a prior authorization denial different from a claim denial?
A prior authorization denial happens before the first dose: the payer says no to the treatment plan. A claim denial happens after the visit: the payer refuses to pay for care you already gave. They need different reports because they cost you different things.
A claim denial is money at risk, covered in why your infusion denial rate is high and how to find the root cause. A prior authorization denial is a patient at risk. If nobody appeals and no alternative drug is approved, that patient never fills a chair, and the referring office may send the next one somewhere else.
What does public data say about overturn rates?
The best public numbers come from Medicare Advantage, and they point the same way: most appealed denials are overturned, but few denials are appealed.
| Source | What it covers | Finding |
|---|---|---|
| KFF, January 2026 | Medicare Advantage prior authorization, all services, 2024 | 52.8 million determinations; 7.7% denied in full or in part; 11.5% of denials appealed; 80.7% of appeals partly or fully overturned |
| HHS Office of Inspector General, September 2018 | Medicare Advantage prior authorization and payment denials, 2014 to 2016 | Plans overturned 75% of their own denials on appeal; only 1% of denials were appealed to the first level |
Two cautions. Both studies cover all services, not just infusion drugs, and neither covers commercial plans. Use them as context for your own numbers, not as a benchmark for your center.
Payers now have to publish their own numbers
Since January 1, 2026, a federal rule sets decision deadlines for some payers and requires them to publish their own approval and denial statistics.
The Interoperability and Prior Authorization final rule covers Medicare Advantage plans and Medicaid and CHIP programs and plans. They must decide urgent requests within 72 hours and standard requests within seven calendar days. Plans sold on the federal marketplace are covered by the rule but not by those deadlines.
All of these payers must post prior authorization statistics on their websites each year. The first set was due by March 31, 2026, according to CMS's fact sheet on the rule. When those reports are posted, compare them with what you see from the same payer.
What should you track for each request?
Give every prior authorization request one row, and keep it even after the patient starts or drops out. The columns:
- Patient and referral: an internal reference, the referring office, and the date the referral arrived.
- Payer and plan: the specific plan, not just the insurance company. Medicare Advantage and commercial plans from the same company behave differently.
- Drug and dosing plan.
- Dates: submitted, first decision, appeal submitted, appeal decision.
- First decision: approved, denied, partly approved, or more information requested.
- Denial reason in plain words: step therapy required, missing records, not medically necessary, site of care, dose or frequency.
- Appeal: yes or no, and if no, why not.
- Final outcome: approved as requested, approved for an alternative drug, or not approved.
- First infusion date, if there was one.
The "if no, why not" column is the one most teams skip, and it's the most useful. "Ran out of time" and "office didn't send records" are fixable. "Patient chose another site" is a different problem.
How do you build a payer scorecard?
Total the rows by payer each quarter. Here is one quarter for a center with three payers. All numbers are synthetic: replace them with your own.
| Payer | Requests | Denied | Initial denial rate | Appealed | Appeal rate | Overturned | Overturn rate | Median days to decision |
|---|---|---|---|---|---|---|---|---|
| Payer A | 120 | 18 | 15.0% | 12 | 66.7% | 8 | 66.7% | 6 |
| Payer B | 80 | 4 | 5.0% | 2 | 50.0% | 1 | 50.0% | 3 |
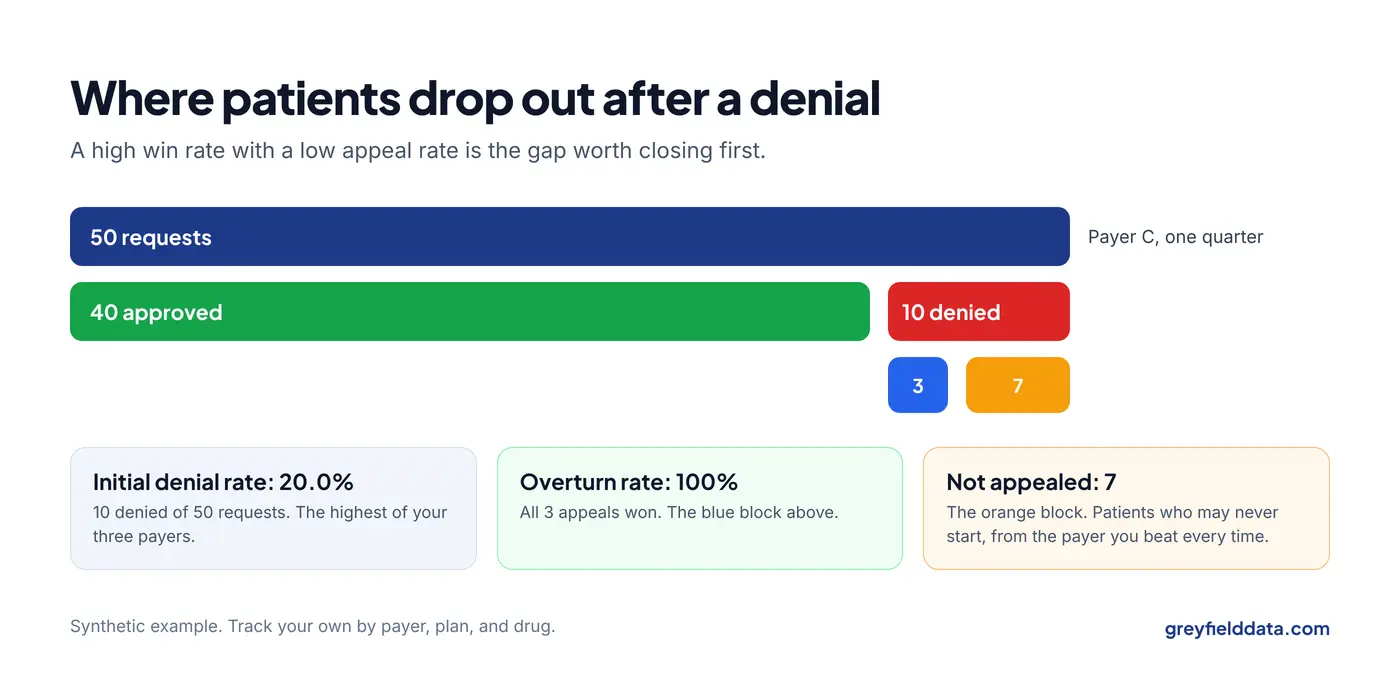
| Payer C | 50 | 10 | 20.0% | 3 | 30.0% | 3 | 100% | 11 |
| All payers | 250 | 32 | 12.8% | 17 | 53.1% | 12 | 70.6% |
How to read it:
- Initial denial rate is denied ÷ requests. Payer C denies 10 ÷ 50 = 20.0%.
- Appeal rate is appealed ÷ denied. Your team appealed 3 of Payer C's 10 denials, or 30.0%.
- Overturn rate is overturned ÷ appealed. All 3 of Payer C's appeals won.
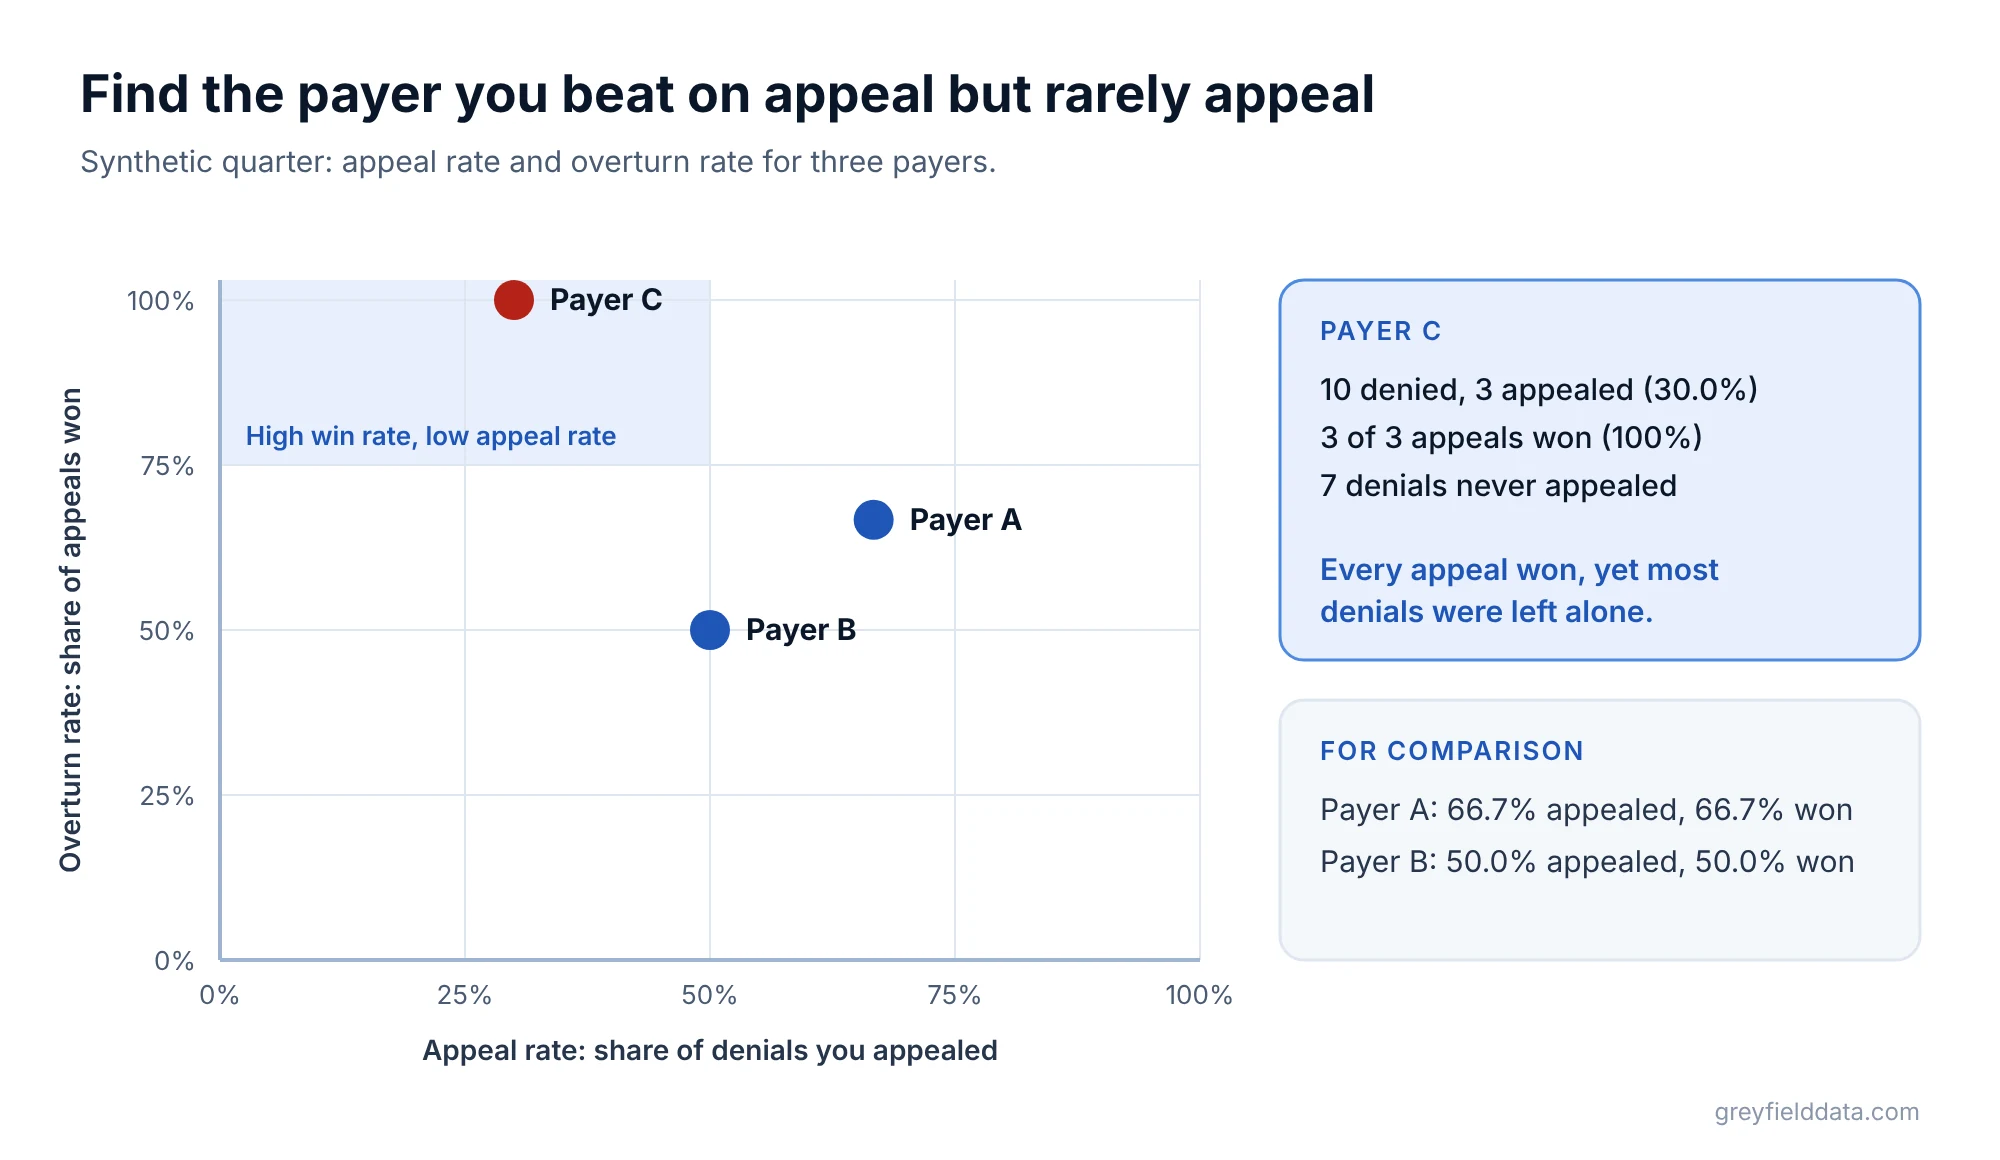
Payer C is the story. It denies the most and takes the longest, but every appeal won. Seven denials were never appealed. If even half of those patients would have started treatment, that's three or four patients a quarter you let go. The chair utilization calculator shows what those empty chairs mean for capacity.
What is a lost patient worth?
Put a value on the gap so the decision to add appeal capacity is a number, not a feeling. Use your own average yearly margin per patient for the drug. With a synthetic $3,000 a year per patient, the seven unappealed Payer C denials represent up to 7 × $3,000 = $21,000 of yearly margin, before counting the referring office's next referral. The referral leakage calculator runs the same math across all payers.
Which cuts show the fix?
Once the scorecard is running, cut it three more ways:
- By drug. A denial rate that's high for one drug across every payer usually means a missing step in your submission, such as a lab result or prior therapy history.
- By denial reason. "Missing records" is an intake process problem. "Step therapy required" is a payer policy problem. Fix the first; document the second for contract talks.
- By referring office. If one office's referrals are denied twice as often, its records are probably incomplete. A short checklist for that office pays for itself.
Track patients who never started after a denial as their own number every month. It is the number that connects this report to growth, and it belongs next to the other stalls in the nine places referrals stall before the first infusion.
Expiring approvals are a separate leak. A patient who was approved can still miss a dose when the approval runs out, which is the subject of the expiring authorizations report. Both leaks also appear as weekly to-do lists in the red flag reports guide.
What to do next
Pull last quarter's prior authorization requests into one list, add the appeal and final outcome columns, and build the scorecard above.
Look first for the payer with a high overturn rate and a low appeal rate. After the visit, claim denials belong on the revenue cycle dashboard. The infusion center metrics white paper and the infusion analytics resource hub cover the related measures.
If you want this scorecard built from your intake records and kept current, book a call with me.
Frequently asked questions
What is a good prior authorization denial rate for an infusion center?
There is no reliable public benchmark for infusion centers. Track your own rate by payer and drug each quarter and watch the trend. KFF's Medicare Advantage figure of 7.7% in 2024 covers all services, not infusion drugs.
How often are prior authorization denials overturned on appeal?
In Medicare Advantage, KFF found 80.7% of appealed denials in 2024 were partly or fully overturned. The OIG found plans overturned 75% of their own denials in 2014 to 2016. Your own overturn rate by payer is the number that should guide your team.
How long do payers have to decide a prior authorization request?
Under a federal rule effective January 1, 2026, Medicare Advantage, Medicaid and CHIP payers must decide urgent requests within 72 hours and standard requests within seven calendar days. Commercial employer plans are not covered by that rule, so check your contracts and state law.
Should we appeal every prior authorization denial?
Not necessarily, but decide on purpose. Use your own overturn rate by payer and reason, and the value of a patient for that drug, to decide which denials are worth the staff time.
Part of the Infusion analytics guides, a reading path through related articles.
Linus Tse
Founder of Greyfield Data. Built 400+ dashboards. Certified in Sigma, Snowflake, Tableau, and Power BI.
About Linus