Revenue cycle dashboards for infusion: what to show in Power BI or any BI tool
What an infusion revenue cycle dashboard should show, from AR aging and denials to charge lag and waste, in Power BI, Sigma, Looker, or Tableau.

Written by Linus Tse, founder of Greyfield Data
· 8 min read
On this page 11 sections

An infusion revenue cycle dashboard should answer five questions:
- Are we getting paid?
- How old is what we're owed?
- Why are claims denied?
- What have we done but not billed?
- Are we billing the drug we waste?
That means five pages: an executive summary, AR aging, denials, unbilled and charge lag, and waste. Power BI, Sigma, Looker, and Tableau can all build them. The tool matters less than getting the grain right. Denial and AR numbers change a lot depending on whether one row is a claim, a claim line, or a visit.
I build revenue and operations reporting for infusion providers, joining infusion EHR data with billing and remittance data. If you want this dashboard built on your data, with definitions agreed first, that is the WeInfuse reporting service I run for ambulatory infusion centers. To see what one unpaid drug claim costs, try the buy-and-bill margin calculator.
Key takeaways
- Build five pages: executive summary, AR aging, denials, unbilled and charge lag, and drug waste. Each page answers one question someone acts on.
- Pick the grain per page and write it on the page. AR is usually claim grain; denials and waste are usually claim-line grain; unbilled is visit grain.
- A denial rate counted by claim, by line, and by dollars gives three different numbers. All are valid; mixing them is the error.
- Any major BI tool works. Power BI, Sigma, Looker, and Tableau all support row-level security for site-level access.
- Most infusion RCM dashboards need data from outside the infusion EHR: remittance (835) files, the billing system, and sometimes the general ledger.
What should an infusion revenue cycle dashboard show?
It should show the few numbers that tell you whether cash is coming in on time and where it is getting stuck. Here are the five pages I build, with the grain and source for each.
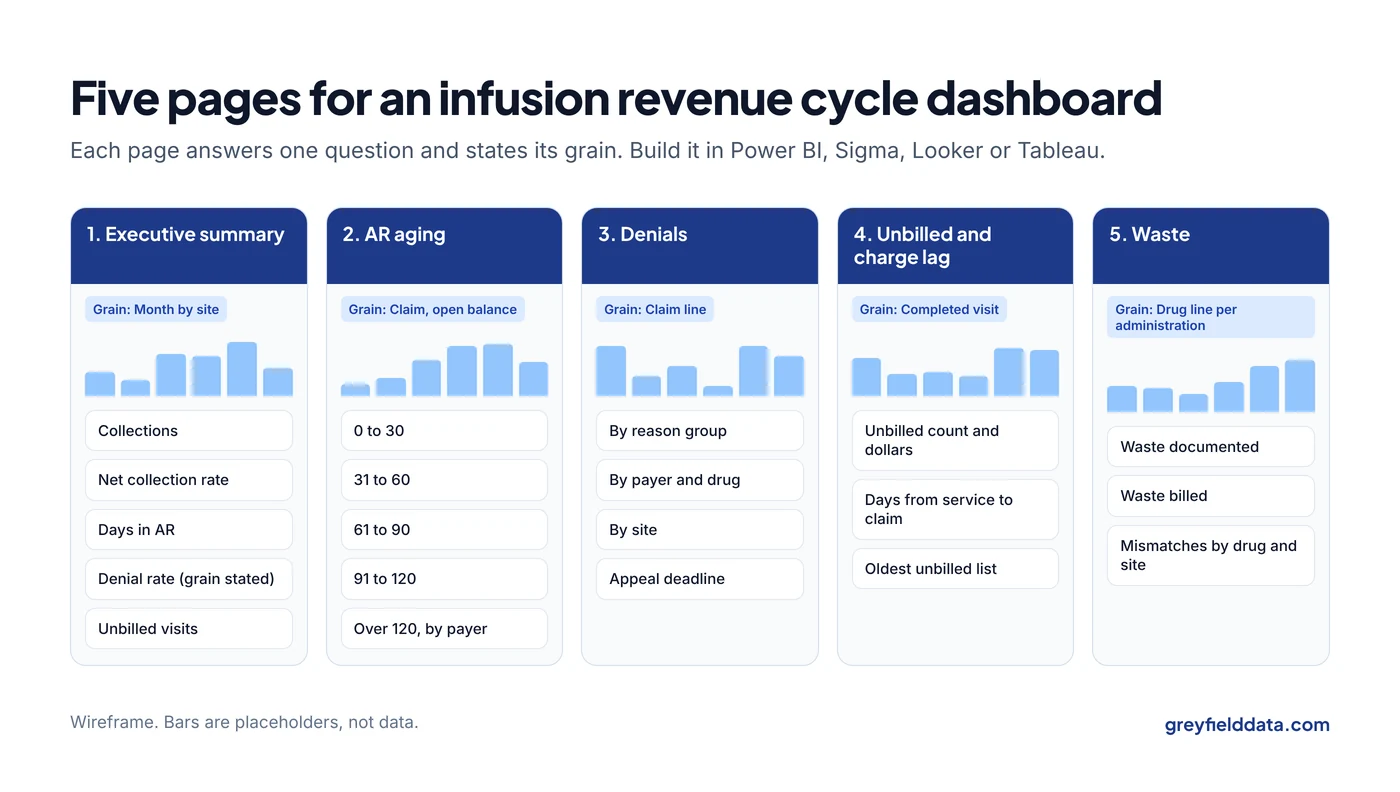
| Page | Question it answers | Grain | Main source |
|---|---|---|---|
| Executive summary | Are we getting paid, and is it getting better or worse? | Month by site | All of the below, summarized |
| AR aging | How much is owed, by whom, and how old is it? | Claim (open balance) | Billing system or clearinghouse |
| Denials | Why are claims denied, and by which payers? | Claim line | 835 remittance with reason codes |
| Unbilled and charge lag | What have we done but not billed, and how long does billing take? | Visit (administration) | Infusion EHR plus claims |
| Waste | Are we documenting and billing discarded drug correctly? | Drug line per administration | Infusion EHR plus claims |
What goes on the executive page?
The executive page holds four to six numbers, each with a trend and a target. I usually use:
- Collections for the month, by site. The claims, charges and collections guide explains why these three are not the same number.
- Net collection rate: payments divided by what you were contractually owed (allowed amount after contractual adjustments).
- Days in AR: AR balance divided by average daily net revenue.
- Denial rate, with its grain written next to it.
- Unbilled visits, as a count and estimated dollars.
Each number should click through to the page that explains it. The infusion center KPI glossary has the formula, grain, and clock for each.
How should the AR aging page work?
AR aging groups open balances by how long they have been outstanding: 0 to 30, 31 to 60, 61 to 90, 91 to 120, and over 120 days. Show it by payer, and let users switch between patient balances and payer balances, since they're worked by different people.
Two choices change the numbers, so write them on the page:
- The aging clock. Date of service or date of first submission. Resubmitted claims age differently under each.
- Credit balances. Netting credits against debits hides both. Show them separately.
What belongs on the denials page?
The denials page shows denials grouped by root cause, then cut by payer, drug, and site. Group claim adjustment reason codes into a few buckets (eligibility, authorization, coding, medical necessity, timely filing) rather than listing dozens of codes.
The infusion denial analysis guide covers the grouping and what to fix first. For authorization refusals in particular, the prior authorization denials by payer guide shows which payers reject most.
Exclude contractual adjustments that aren't denials, or your denial rate will be inflated. And add a column for appeal deadline, so the page drives action rather than just describing the past.
How do you show unbilled visits and charge lag?
Unbilled visits are completed administrations with no claim yet. Charge lag is the days from date of service to claim submission. Show both by site and by biller, with a list of the oldest unbilled visits underneath.
In WeInfuse, the appointments Explore exposes appointments.billed (Yes / No) and appointments.status, which give you a starting list of completed but unbilled appointments. Check what your center means by "billed" before trusting it: a billed flag is not proof a claim was accepted or paid. The revenue leakage guide explains why, and the revenue leakage calculator estimates what unbilled visits cost each month.
Why put waste on a revenue dashboard?
Waste belongs on the dashboard because discarded drug from single-dose containers is billable under specific rules, and missing or inconsistent waste lines cost money and draw payer edits. Show waste units documented against waste units billed, by drug and site, and flag lines where documentation and claim disagree.
The rules for the JW and JZ modifiers are in the JW and JZ modifier guide. The dashboard's job is to show where your claims don't match your documentation.
Which grain mistakes break RCM dashboards?
Grain mistakes are the most common reason two RCM dashboards disagree. The denial rate is the clearest example.
Here is a synthetic set of 10 claims with 40 lines in total. One claim is denied in full (4 lines). Two other claims each have one line denied.
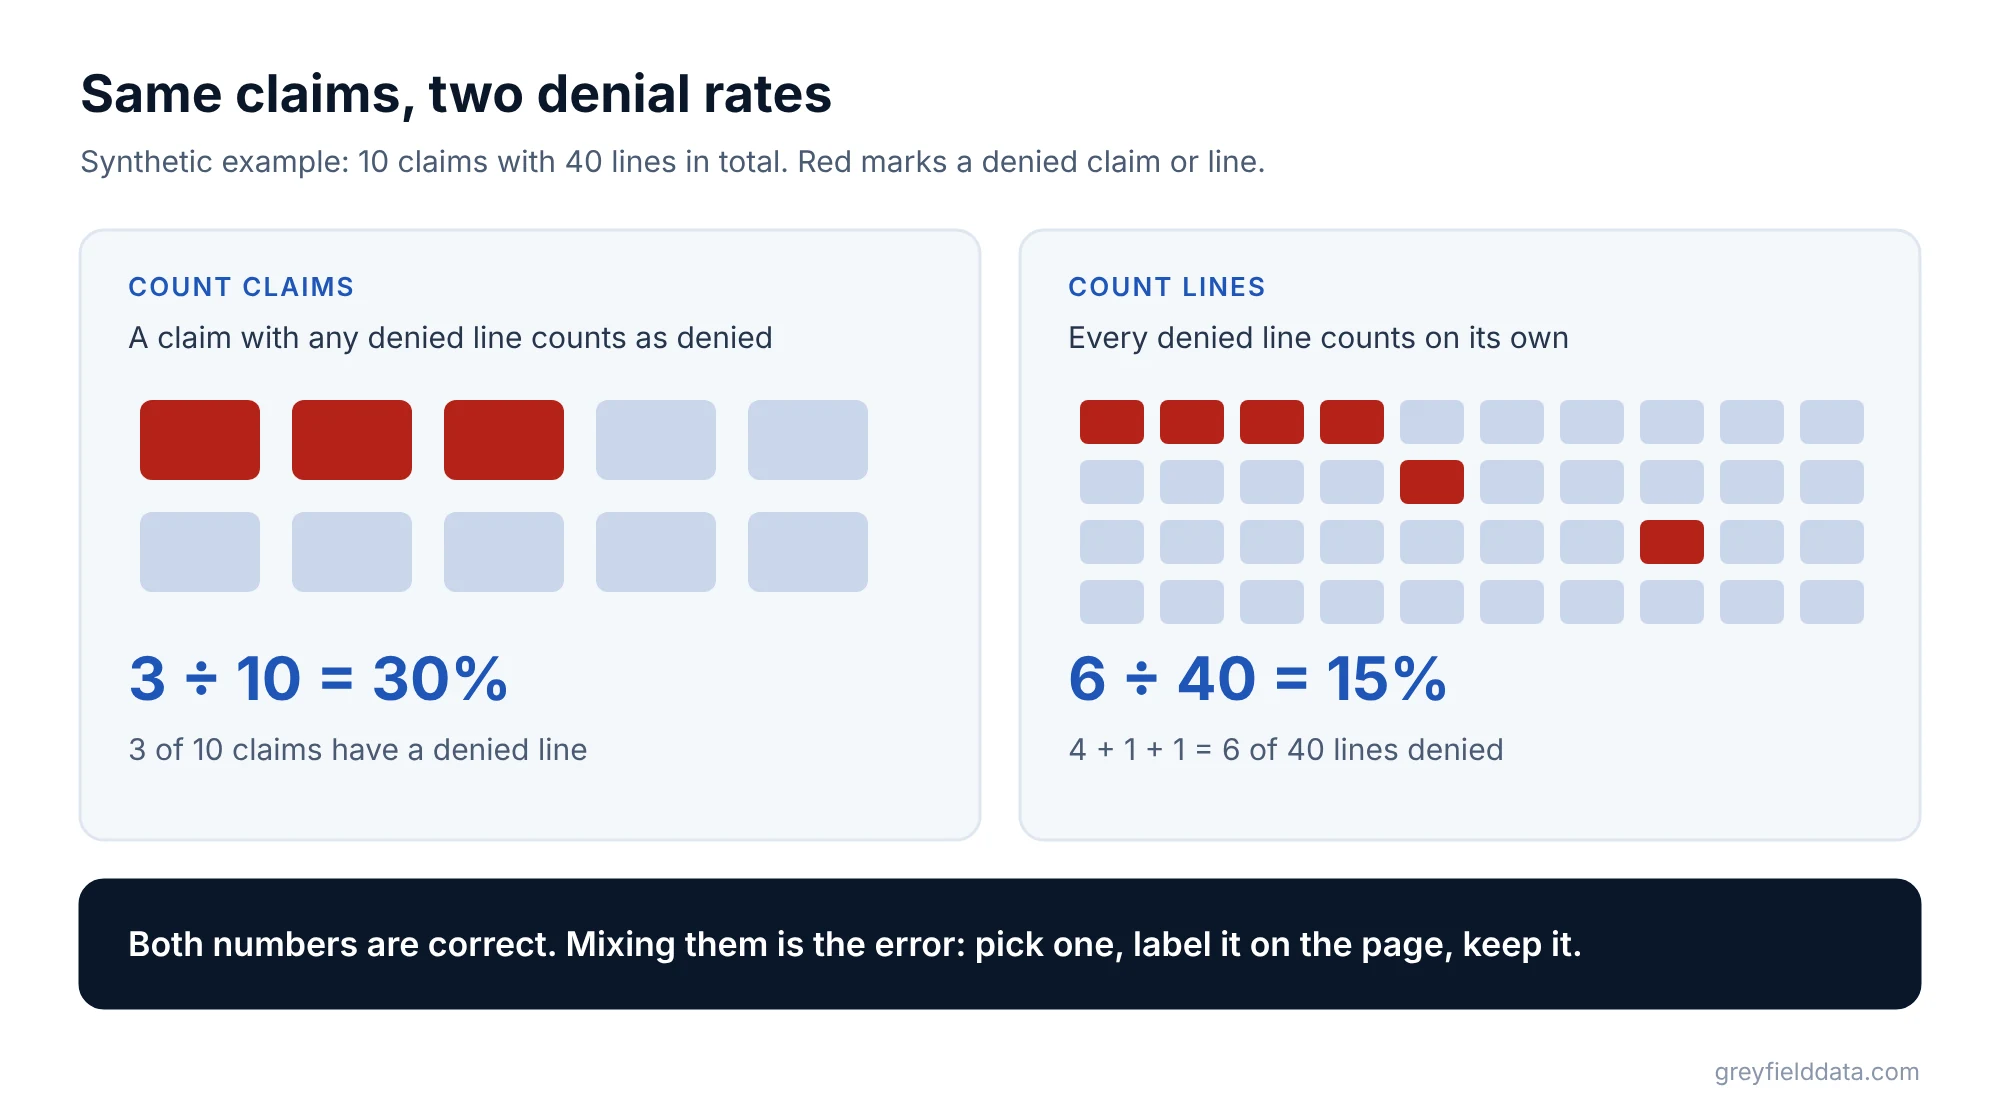
| Way of counting | Calculation | Denial rate |
|---|---|---|
| Claims with any denied line | 3 ÷ 10 | 30% |
| Denied lines | (4 + 1 + 1) ÷ 40 = 6 ÷ 40 | 15% |
Synthetic example. Claims and lines are invented.
Both numbers are correct. A board that sees 30% one month and 15% the next, because someone changed the query, will think something happened. Pick one, label it, and keep it.
Other grain traps I see:
- Visit counts from a claim table. A visit with a drug line and two administration lines is three lines, not three visits.
- Order-level values summed at appointment grain. The order repeats for each appointment, so the sum multiplies. The duplicate rows guide shows how.
- Payments joined to claims without handling partial payments. One claim can have several payments and adjustments over months.
Which BI tool should you use for an infusion RCM dashboard?
Use the tool your organization already pays for and can support. The differences that matter for revenue cycle work are how the tool connects to your data, how it handles site-level access, and who will maintain it.
| Tool | Fits well when | Site-level access |
|---|---|---|
| Power BI | You run Microsoft 365 and have staff who know it | Row-level security |
| Sigma | Your data is in a cloud warehouse and finance users like spreadsheets | Row-level security |
| Looker | You want definitions in a shared model and already use Google Cloud | Access filters |
| Tableau | Your analysts already build in it | Row-level security options |
If your infusion EHR is WeInfuse, its embedded Looker covers much of the operational side. Denials and AR usually need remittance and billing data from outside it, joined in a data warehouse or in the BI tool. The WeInfuse reporting guide covers what you can get out. If you're still deciding whether you need a BI tool at all, read Excel vs BI for infusion reporting.
What to do next
Write down the grain and source for each of the five pages before you open any BI tool. Then build the executive page last, from the others.
The 12 weekly infusion reports fill in the operational side, and the infusion center metrics playbook collects the definitions. For the version your board sees, the board monthly finance pack shows what to send each month. If you want the dashboard built on your EHR, billing, and remittance data, book a call with me.
WeInfuse is a trademark of its owner. Greyfield Data is independent and not affiliated with WeInfuse.
Frequently asked questions
What should a revenue cycle management dashboard in Power BI include?
For infusion: an executive summary, AR aging by payer, denials by reason and payer, unbilled visits and charge lag, and drug waste documented versus billed. Write the grain on each page.
What data sources does an infusion RCM dashboard need?
The infusion EHR for orders and administrations, the billing system or clearinghouse for claims and AR, 835 remittance files for payments and denial reasons, and sometimes the general ledger for collections.
Why do two denial rate reports disagree?
Usually because one counts claims and the other counts claim lines or dollars. A claim with one denied line out of four is one denied claim but only a quarter of its lines.
Is Power BI better than Sigma, Looker, or Tableau for revenue cycle reporting?
None is clearly better for revenue cycle work. Choose the one you can connect to your data, secure by site, and maintain with the people you have.
Part of the Infusion analytics guides, a reading path through related articles.
Linus Tse
Founder of Greyfield Data. Built 400+ dashboards. Certified in Sigma, Snowflake, Tableau, and Power BI.
About Linus