Excel or a BI tool for infusion reporting? When to switch
When Excel is enough for infusion reporting, the signs it's time for Power BI, Sigma, Looker, or Tableau, and how to switch without losing trust.

Written by Linus Tse, founder of Greyfield Data
· 8 min read
On this page 10 sections

Excel is enough for infusion reporting when one site, one person, and a handful of monthly numbers are involved, and the inputs come from one system. Move to a BI tool such as Power BI, Sigma, Looker, or Tableau when the same report is rebuilt by hand every week or joins two or more systems. The same goes when several people need different slices of it, or when a wrong number has a real cost. The switch only helps if you write the definitions down first.
I build infusion reporting in both: Excel workbooks for one-off analysis, and BI dashboards on top of infusion EHR, billing, and remittance data. If you're deciding whether to make the move, that is a conversation I have often as part of my infusion analytics work. If your first question is about capacity, the chair utilization calculator gives you a number without either tool.
Key takeaways
- Excel is enough for one-off questions, small single-system data, and a single owner who checks the work.
- Switch to a BI tool when a report is rebuilt by hand every week, joins several systems, needs per-site access, or feeds decisions where an error is costly.
- The tool doesn't fix definitions. Move only the numbers you've written down, including what each line counts and which date it runs from, or you'll move the arguments too.
- You don't have to pick one. Most infusion teams end up with a BI tool for recurring numbers and Excel for analysis.
- Excel's hard limit is 1,048,576 rows per worksheet, but most teams leave Excel long before they reach it.
Quick answers
- Excel is best for: one-off questions, data from one system, and one owner who checks the work.
- Power BI is best for: teams already on Microsoft 365.
- Sigma is best for: finance teams that think in spreadsheets and keep data in a cloud warehouse.
- Looker is best for: teams that want definitions in one shared model. WeInfuse users already have it embedded.
- Tableau is best for: teams whose analysts already know it.
- Time to switch: when three or more of the warning signs below apply.
When is Excel enough for infusion reporting?
Excel is enough when the question is one-off, the data comes from one system, and one person owns the result. Examples:
- Checking last quarter's infusions by drug for a payer meeting.
- Testing a new metric definition before you build it anywhere permanent.
- Modeling a scenario, such as the margin on a new drug under different payer mixes.
- A single-site center with one person who pulls and checks a few monthly numbers.
Excel is fast, everyone has it, and it is the right place to try an idea. Power Query, built into Excel, can also refresh a saved import from a file or database, which takes you surprisingly far. If your weekly pain is a no-show or cancellation count, the infusion no-show cost calculator shows whether it is worth automating.
What are the signs it's time for a BI tool?
It's time when the cost of keeping the spreadsheet right is higher than the cost of a tool. These are the signals I look for.
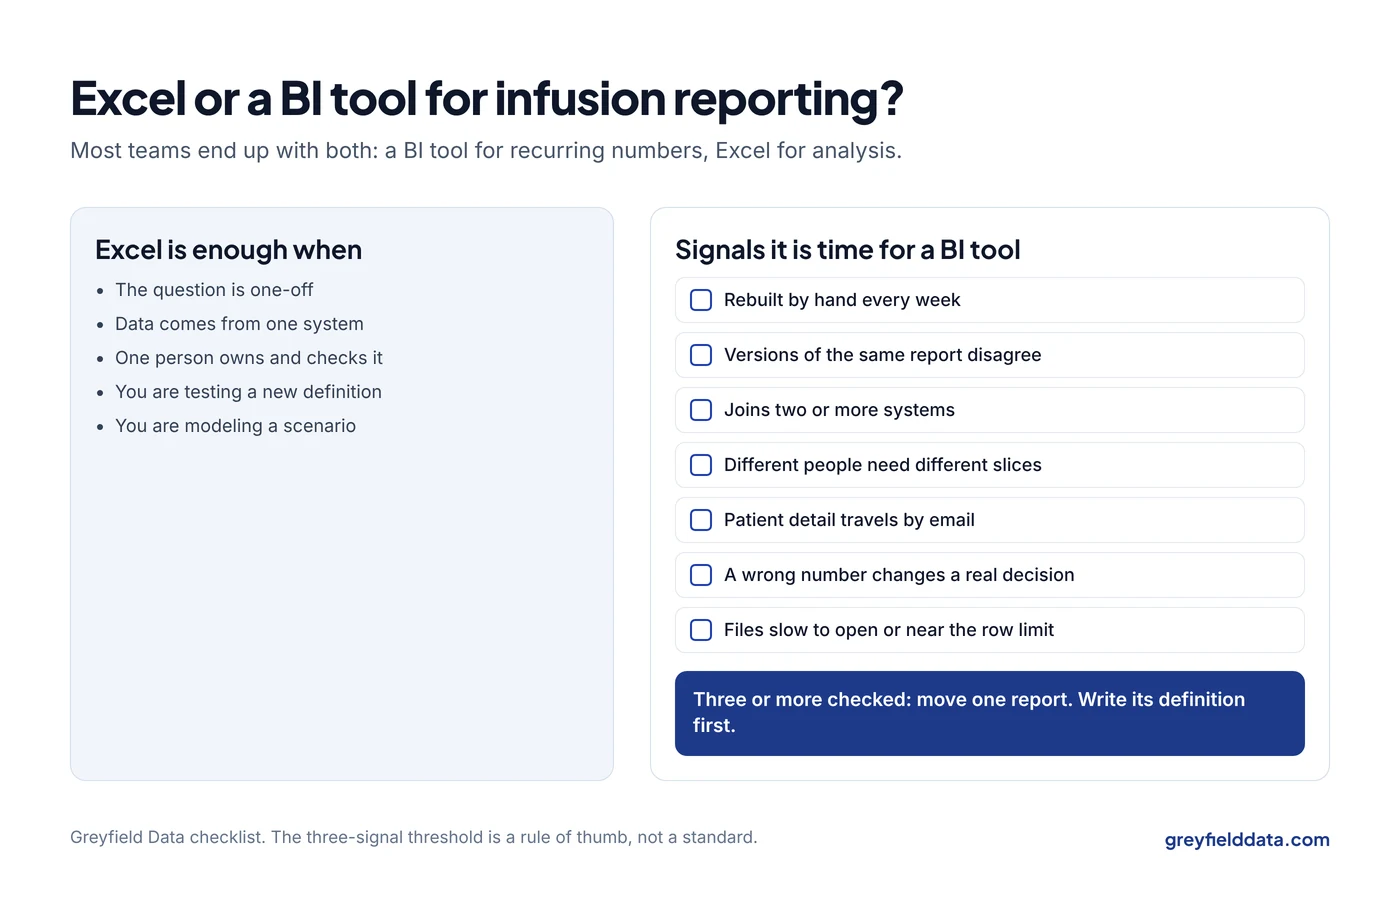
| Signal | What it looks like | Why a BI tool helps |
|---|---|---|
| Rebuilt by hand | Someone spends hours each week exporting, pasting, and fixing the same report | Scheduled refresh from a saved query |
| Versions disagree | Two copies of "the" report show different numbers | One shared definition, one source |
| Joins across systems | VLOOKUPs between EHR exports, billing exports, and remittance files | Matching rules that run the same way every time |
| Different people need different slices | Separate files for each site manager | One dashboard with row-level security by site |
| Patient data in email | Spreadsheets with patient detail attached to emails | Access controlled in one place, with an audit trail |
| Errors are costly | A wrong number changes staffing, purchasing, or a board decision | Tested logic that doesn't depend on one person's formulas |
| Size | Files that take minutes to open, or exports near the 1,048,576-row worksheet limit | Queries run against the source, not a pasted copy |
One signal on its own isn't decisive. Three or more usually means the spreadsheet is costing you more than it saves.
What does Excel get wrong with infusion data?
Excel doesn't get anything wrong on its own. The trouble is that infusion data has one-to-many relationships that are easy to break in a spreadsheet:
- One order, many appointments. Paste an appointment export and sum an order-level field, and you count the order once per appointment. The duplicate rows guide shows how quickly this multiplies.
- One claim, many lines and payments. A VLOOKUP returns the first match, so a claim with two payments shows only one.
- Dates without time zones. Appointment start times exported in UTC can land on the wrong day for an evening slot if nobody converts them to local time.
None of these is fixed by switching tools. A BI tool just lets you fix them once, in the model, instead of every week in a new file.
Which BI tool should an infusion provider choose?
Choose the tool your organization can connect to its data and maintain.
Power BI suits teams already on Microsoft 365. Sigma suits finance teams that think in spreadsheets and have data in a cloud warehouse. Looker suits teams that want definitions in a shared model. Tableau suits teams whose analysts already know it.
If your infusion EHR is WeInfuse, its embedded Looker already gives you a BI tool for data that lives inside WeInfuse, and you can schedule saved reports out of it. What it doesn't do is join billing, remittance, or general ledger data from other systems. That is usually what pushes a team toward a separate BI tool or a warehouse. The revenue cycle dashboards guide compares the four tools for that use. When billing runs outside WeInfuse, the billing outside WeInfuse guide shows what the combined report has to match.
The WeInfuse reporting guide covers what you can build inside the embedded Looker first. For reports that span several systems or sites, the infusion data warehouse white paper explains how one single source of truth feeds whichever BI tool you pick.
How do you move from Excel to BI without losing trust?
Move the definitions before you move the dashboards. People trust a spreadsheet they know, even a flawed one, so the new tool has to match it or explain the difference.
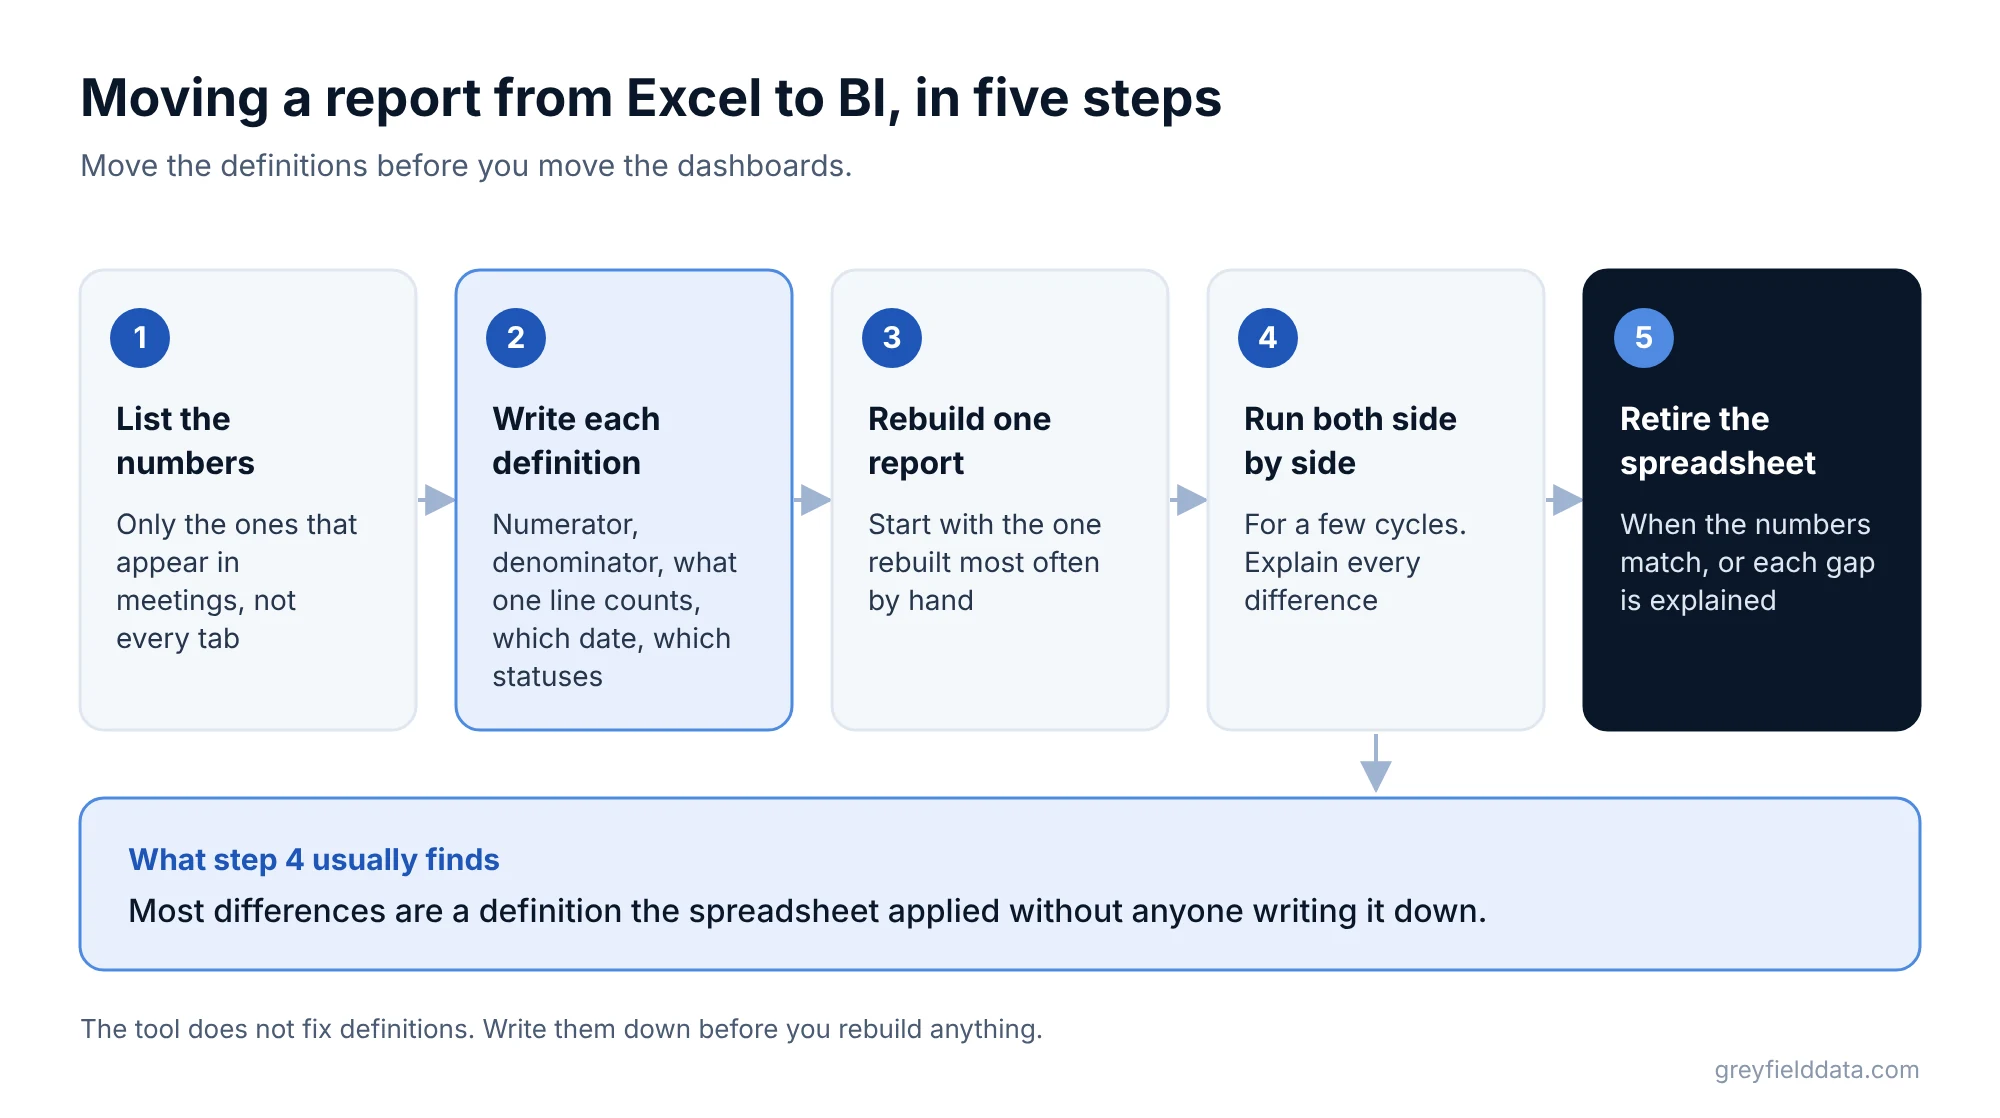
- List the numbers people use. Not every tab, just the numbers that appear in meetings.
- Write each definition. Numerator, denominator, what one line counts, which date it runs from, and which statuses are included. The KPI glossary is a starting point.
- Rebuild one report. Start with the one rebuilt most often by hand.
- Run both side by side. For a few cycles, compare the spreadsheet and the BI version and explain every difference. Most differences are a definition the spreadsheet applied without anyone writing it down.
- Retire the spreadsheet. Once the numbers match or the differences are explained, stop sending the file.
What does a sensible split look like?
Most infusion teams I work with end up with both:
| Use | Best place |
|---|---|
| Weekly operating reports and exception lists | BI tool or scheduled EHR report |
| Executive and board numbers | BI tool, from shared definitions |
| One-off analysis and scenarios | Excel, using data exported from the BI tool |
| Testing a new metric | Excel first, then the BI tool once agreed |
That split is roughly stage two to three of the infusion data maturity path.
What to do next
Count how many hours a week your team spends rebuilding the same reports by hand, and how many of the signals in the table above apply. If it's three or more, pick one report and move it. The reporting time calculator turns those hours into a monthly cost and a payback period.
The 12 weekly reports guide suggests which to start with. The free infusion data readiness check shows whether your data is ready to move. If you run WeInfuse, WeInfuse reporting help covers both the embedded reports and the move to a BI tool. If you want help choosing a tool or moving your reports, book a call with me.
WeInfuse is a trademark of its owner. Greyfield Data is independent and not affiliated with WeInfuse.
Frequently asked questions
Is Excel or Power BI better for revenue cycle analytics?
Excel is better for one-off analysis and testing definitions. Power BI, or another BI tool, is better for recurring revenue cycle reports that join billing, remittance, and operations data and need controlled access by site.
How many rows can Excel handle?
An Excel worksheet holds up to 1,048,576 rows by 16,384 columns, per Microsoft's published specifications. Performance and maintenance usually become the problem well before that.
Do we need a data warehouse to use a BI tool?
No. Most BI tools can connect to files and databases directly. A warehouse helps when you join several systems, keep history, or want one set of definitions across tools.
Can we keep using Excel after moving to a BI tool?
Yes, and you should for ad hoc analysis. The change is that recurring numbers come from the BI tool's shared definitions, and Excel works from its exports instead of from separate raw pulls.
Part of the Infusion analytics guides, a reading path through related articles.
Linus Tse
Founder of Greyfield Data. Built 400+ dashboards. Certified in Sigma, Snowflake, Tableau, and Power BI.
About Linus