Multi-site infusion KPIs: how to roll up sites so the board trusts one number
How to roll up infusion KPIs across sites: shared definitions, a site mapping that handles billing-entity changes, local time zones, and one grain.

Written by Linus Tse, founder of Greyfield Data
· 8 min read
On this page 10 sections

To roll up infusion KPIs across sites so the board trusts one number, you need four things:
- One written definition per KPI that every site uses.
- A site mapping table that ties every location name and billing entity back to one real site.
- Dates converted to each site's local time before you group by day.
- One consistent row grain.
Then you add up numerators and denominators across sites, rather than averaging site percentages.
I build these rollups for multi-site ambulatory infusion centers, from infusion EHR and billing data up to the executive view. If you want your sites on one set of numbers, that is the WeInfuse reporting service I run. For a quick capacity number by site, the chair utilization calculator does the math.
Key takeaways
- Write one definition per KPI and use it at every site. If sites count "infusions" differently, the total means nothing.
- Keep a site mapping table. Billing-entity changes, renamed locations, and system migrations often create two records for one real site.
- Convert timestamps to each site's local time before grouping by day or hour. A UTC timestamp can put an evening visit on the next day.
- Roll up ratios by summing numerators and denominators. Averaging site percentages gives small sites the same weight as large ones.
- Fix the grain before you roll up. One row per administration at one site and one row per appointment at another won't add up.
Why don't multi-site infusion numbers add up?
Multi-site numbers don't add up because each site's report was built on its own assumptions. Each report is right for its site, and the total is still wrong.
- One site counts appointments, another counts administrations.
- One location appears under two names.
- One region's dates are in UTC.
The board sees a number that changes when someone re-runs it, and stops trusting the deck. The fix is not a new dashboard. It is the four foundations below, kept in one data warehouse so every report reads the same single source of truth.
How do shared definitions work across sites?
A shared definition is one sentence per KPI, used by every site, with the numerator, denominator, grain, and clock written down. "Infusions" might be defined as "completed administrations, one row per appointment with an administered drug, by date of service in the site's local time."
Sites can still track their own extra measures. The rollup uses only the shared ones. The infusion center KPI glossary gives definitions in this format for 30 KPIs.
| KPI | Common site-level difference | Shared definition to agree |
|---|---|---|
| Infusions | Orders vs appointments vs administrations | Which event, and which statuses count |
| Chair utilization | Scheduled vs actual minutes; open hours differ | Booked chair-minutes ÷ available chair-minutes, with each site's hours |
| No-show rate | Same-day cancels counted or not | Which statuses count as no-show, and the denominator |
| Denial rate | Claims vs lines vs dollars | One grain, labeled |
| Referral to first treatment | Clock starts at fax received or order entered | Start and stop events for the clock |
How do you build a site mapping table?
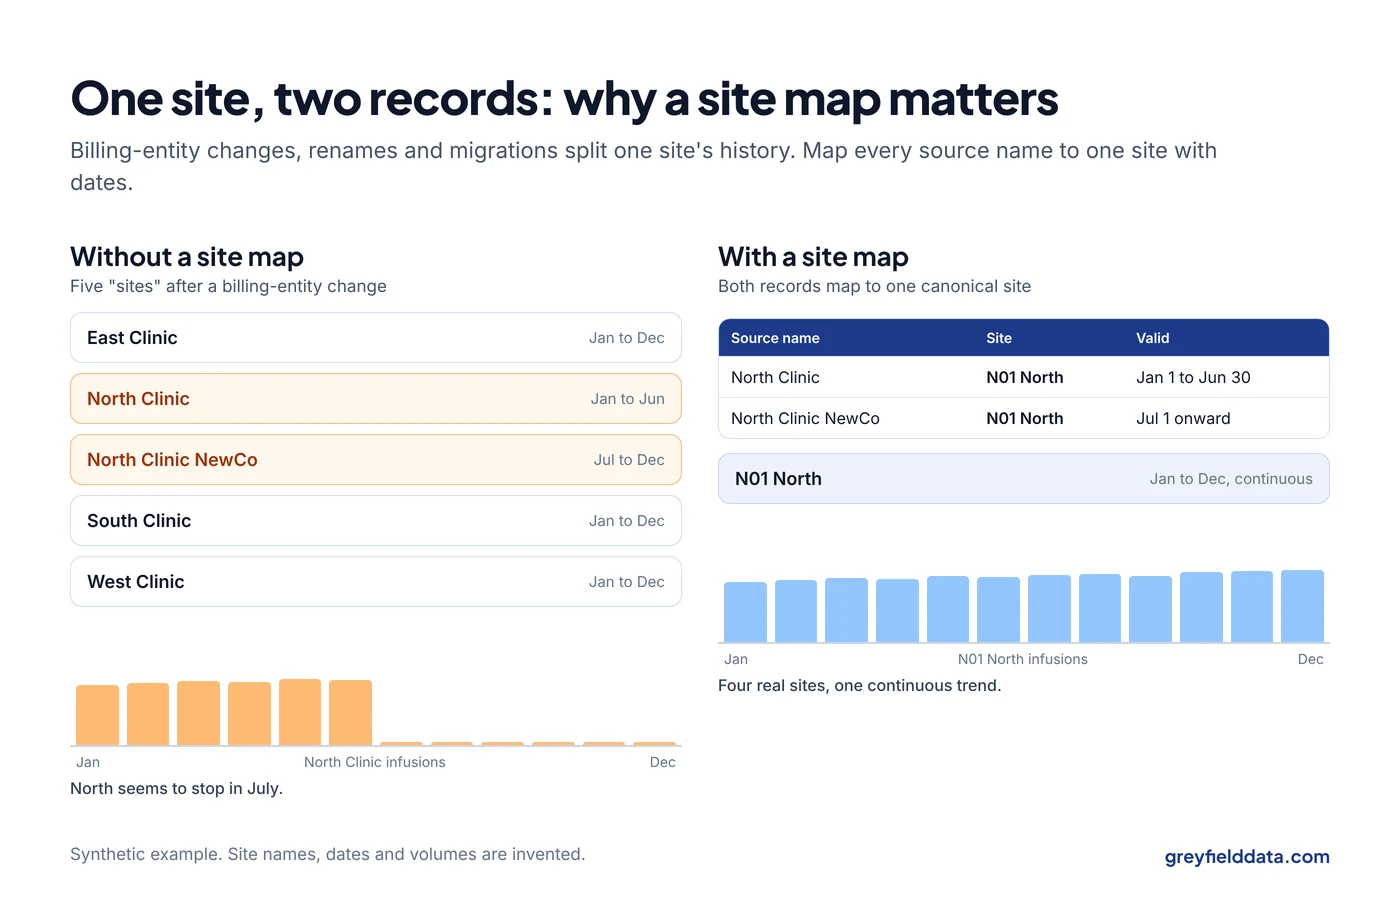
A site mapping table lists every location identifier from every system and maps each one to a single canonical site, with the dates it applies. It is a small table, and it is the single biggest fix I make in multi-site reporting.
| Source system | Source location name | Canonical site | Valid from | Valid to |
|---|---|---|---|---|
| Infusion EHR | North Clinic | N01 North | Jan 1 | Jun 30 |
| Infusion EHR | North Clinic NewCo | N01 North | Jul 1 | (current) |
| Billing system | North Infusion LLC | N01 North | Jan 1 | (current) |
| Infusion EHR | South Clinic | S01 South | Jan 1 | (current) |
Synthetic example. Names and dates are invented.
Why one site becomes two:
- Billing-entity changes. A new legal entity, tax ID, or billing NPI often means a new location record in the EHR or billing system, so history splits in two.
- Renames and moves. A site moves down the street and gets a new name or ID.
- System migrations. The old system's site codes don't match the new one's.
- Shared space. One building hosting two programs that bill differently.
Every report then joins to the mapping table and groups by canonical site, never by the raw location name. In WeInfuse, appointment data carries appointments.location_id and appointments.location_name; map the ID, not the name, since names change.
Why do time zones matter for infusion KPIs?
Time zones matter because a timestamp stored in UTC can land on a different calendar day than the visit did. If your sites span time zones, or your source stores UTC, an evening appointment can be counted on the next day, and hour-of-day utilization shifts by several hours.
In WeInfuse, the dictionary describes appointments.start_time as the scheduled start time in UTC, and location data includes locations.time_zone. Convert each appointment to its site's local time before you group by date or hour. Also watch the other direction: a date-only field (like a date of birth or a service date stored without a time) should stay a calendar date and not be shifted through a time zone conversion.
How do you keep a consistent grain across sites?
Pick one grain per KPI and build every site's numbers from the same base. If infusions are counted at one row per completed appointment, every site uses that, even if one site's team usually thinks in orders.
The most common grain break I see: one site's report starts from orders and another from appointments. They look alike and don't add up. The orders vs appointments guide explains why, and the duplicate rows guide shows how a one-to-many join changes totals.
How do you roll up ratios correctly?
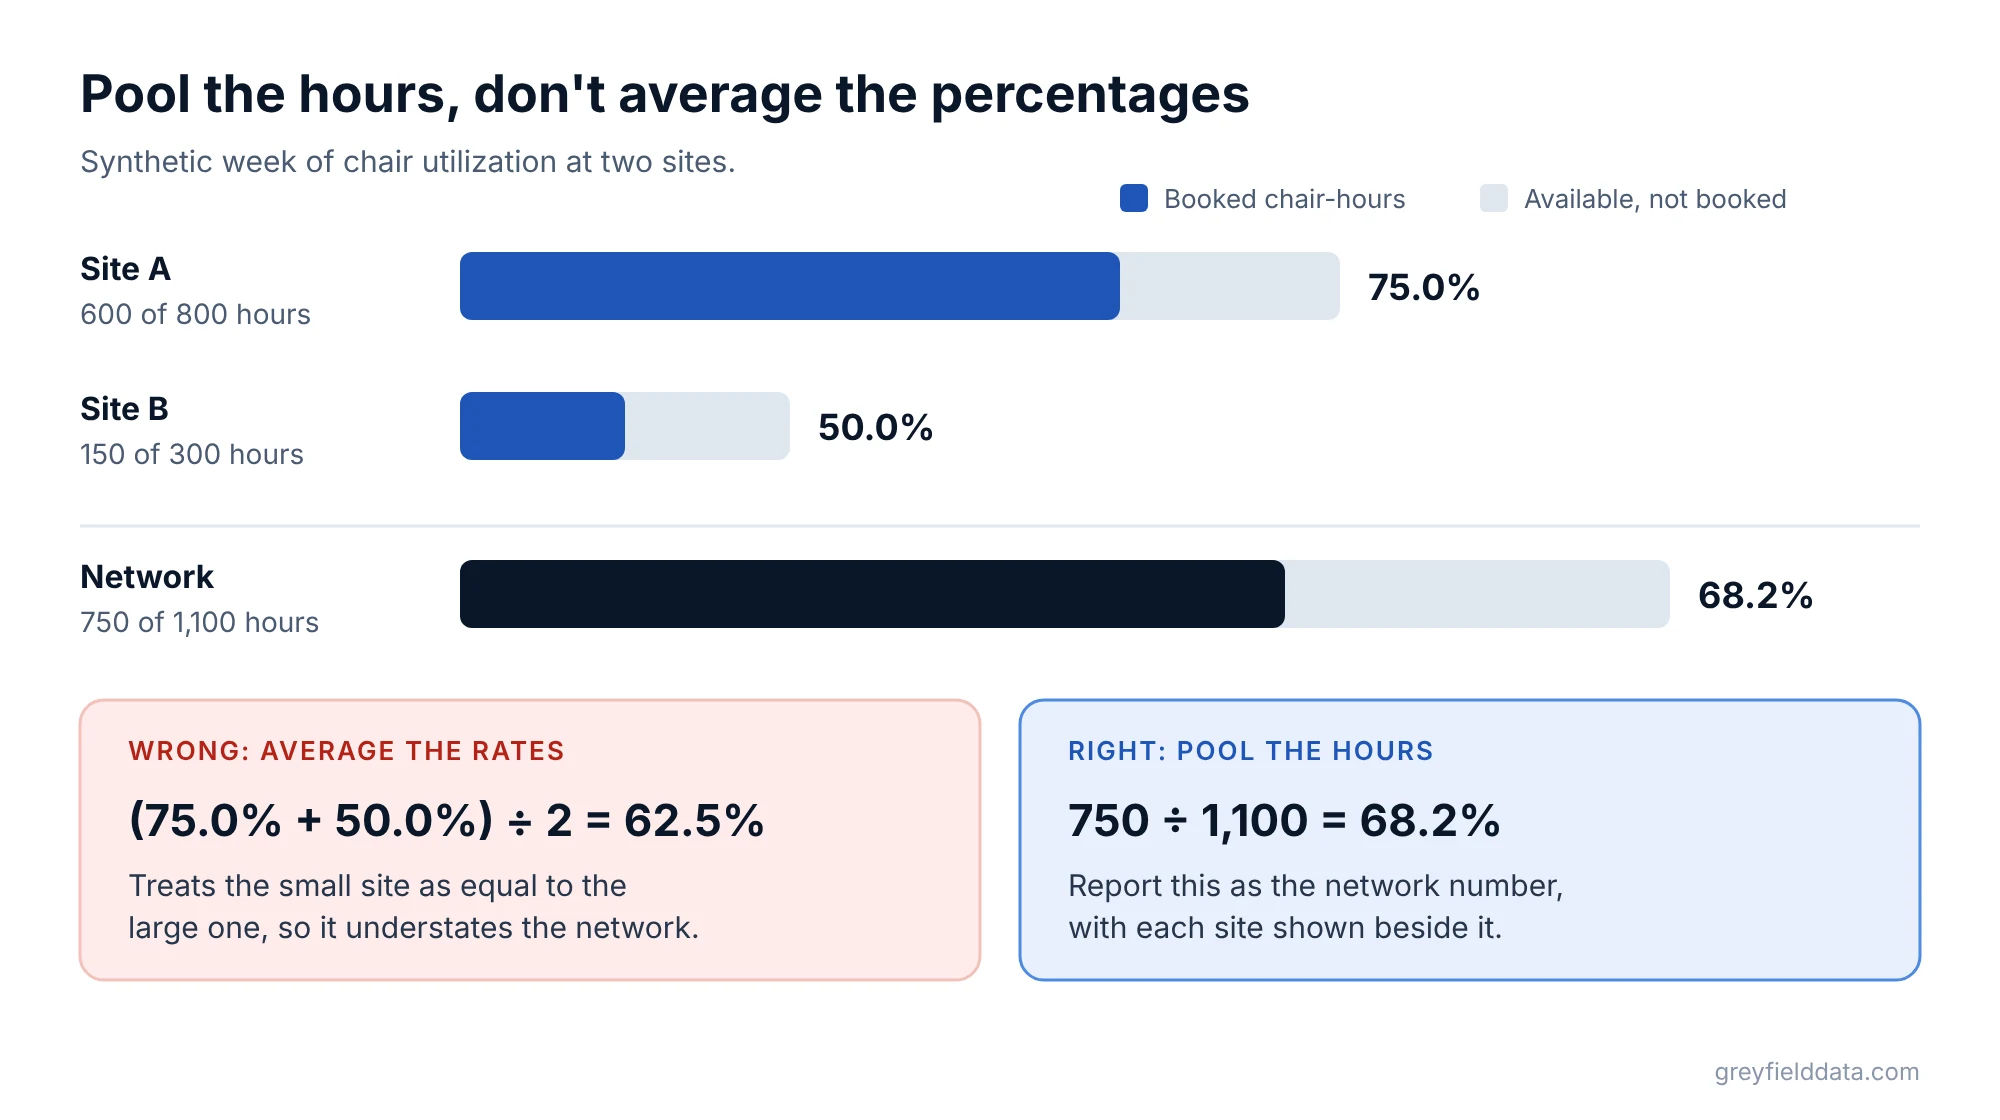
Roll up a ratio by adding the numerators across sites and dividing by the added denominators. Don't average the site percentages.
Synthetic example for one week of chair utilization:
| Site | Booked chair-hours | Available chair-hours | Utilization |
|---|---|---|---|
| A | 600 | 800 | 75.0% |
| B | 150 | 300 | 50.0% |
| Pooled | 750 | 1,100 | 68.2% |
Synthetic example. Hours are invented.
The simple average of 75.0% and 50.0% is 62.5%. The pooled number is 750 ÷ 1,100 = 68.2%. The average treats the small site as equal to the large one, which understates the network. Report the pooled figure as the network number, and show sites beside it.
What should a multi-site executive view show?
A multi-site executive view shows the network number for each shared KPI, each site beside it, and the trend. Keep it to the numbers the board actually decides on:
- Infusions and new patient starts by site.
- Chair utilization by site, pooled for the network.
- Referral to first treatment, median by site.
- Collections, days in AR, and denial rate by site.
- Site-level margin, once revenue, drug cost, and labor are joined by site.
For the revenue side, the revenue cycle dashboards guide covers the pages and grain. If a transaction is on the horizon, the same foundations feed M&A data readiness. For the monthly pack itself, see the board monthly finance pack guide.
What to do next
List every location name in every system you report from, and map each to a canonical site with dates. Then re-run last year's monthly infusions by site. If the trend changes, you've found the problem the board has been feeling.
The infusion center metrics playbook collects the definitions, and the no-show cost calculator helps compare sites on missed visits. If you are weighing where the rollup should live, the CFO guide to an infusion data warehouse covers tying site numbers to the books. The WeInfuse reporting guide covers what you can pull from WeInfuse today.
If you want help building the rollup, book a call with me.
WeInfuse is a trademark of its owner. Greyfield Data is independent and not affiliated with WeInfuse.
Frequently asked questions
How do I get visibility across all my infusion sites?
Agree one definition per KPI, map every location from every system to one canonical site, convert times to each site's local time, and build every site's numbers from the same grain. Then report the network number with sites beside it.
What analytics should a multi-site AIC have in place?
A shared KPI definitions document, a site mapping table, a consistent grain for core counts, and an executive view of volume, utilization, referral-to-treatment time, revenue cycle health, and site margin.
Why does one of our sites appear twice in reports?
Usually because a billing-entity change, rename, or system migration created a second location record. A site mapping table with effective dates ties both records to one site.
Can executive analytics support PE board reporting?
Yes, if the numbers rest on written definitions and a site mapping that anyone can rebuild. Boards trust a number that comes out the same every time it's re-run.
Part of the Infusion analytics guides, a reading path through related articles.
Linus Tse
Founder of Greyfield Data. Built 400+ dashboards. Certified in Sigma, Snowflake, Tableau, and Power BI.
About Linus