Infusion M&A data readiness: what buyers and lenders will ask for
The data a buyer or lender will ask an infusion provider for, from multi-year site trends to payer concentration and site margin, as a checklist.

Written by Linus Tse, founder of Greyfield Data
· 8 min read
On this page 12 sections
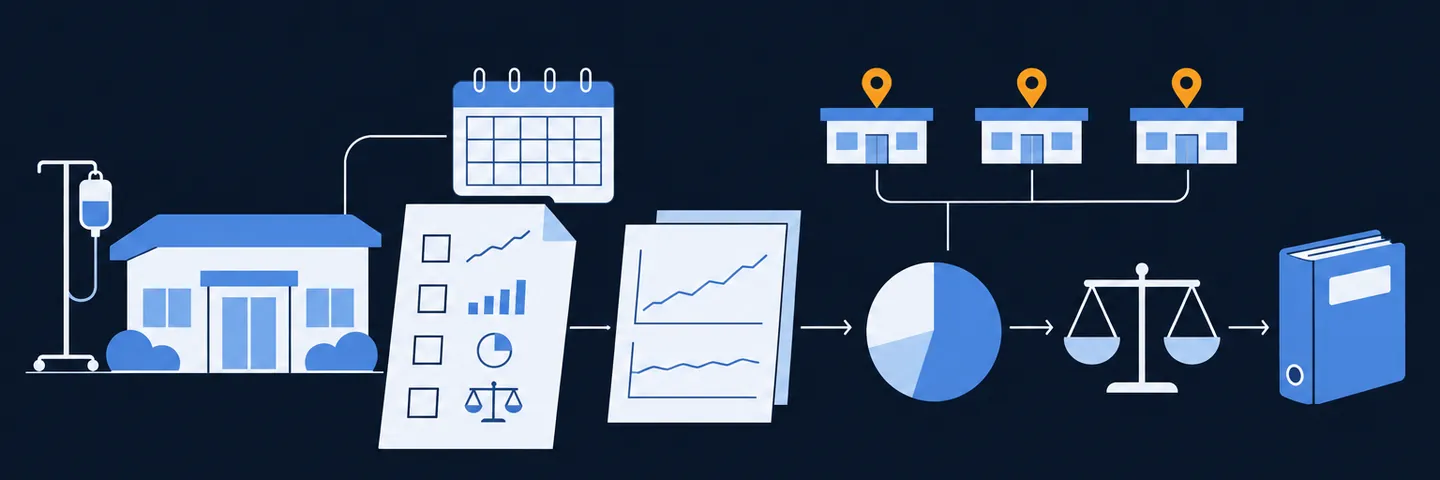
A buyer or lender looking at an infusion provider will ask for multi-year trends by site, therapy and payer mix, payer and referral concentration, site-level margin, and written definitions for every number you show. The best time to build that is a year or more before a transaction, because the hard part is not the report. It is being able to produce the same numbers from source data, consistently, and explain any change.
I build the reporting and data models that answer these questions for multi-site infusion groups, from the infusion EHR, billing, and remittance data up to site-level views. This guide is about data, not legal, tax, or financial advice. Your deal advisors decide what a transaction needs.
If you want help getting the numbers ready, that is part of the infusion analytics work I do. The multi-site KPI rollup guide covers the foundation most of this depends on.
Key takeaways
- Expect requests for at least two to three years of monthly trends by site, therapy, and payer, plus concentration by payer and referral source.
- Consistency matters more than polish. A number you can rebuild from source data and explain beats a better-looking number you can't.
- Write down the definitions behind every metric you share. Different definitions between periods look like performance changes.
- Site-level margin needs drug cost, payments, and labor joined at site level. That is usually the longest piece to build.
- Share only what each request needs, and keep patient-level data out of the data room unless your advisors say otherwise.
What data will a buyer or lender ask an infusion provider for?
They will ask for data that shows how the business earns money, how dependable that is, and whether your numbers hold up when someone else rebuilds them. For an infusion provider that usually means the groups below.
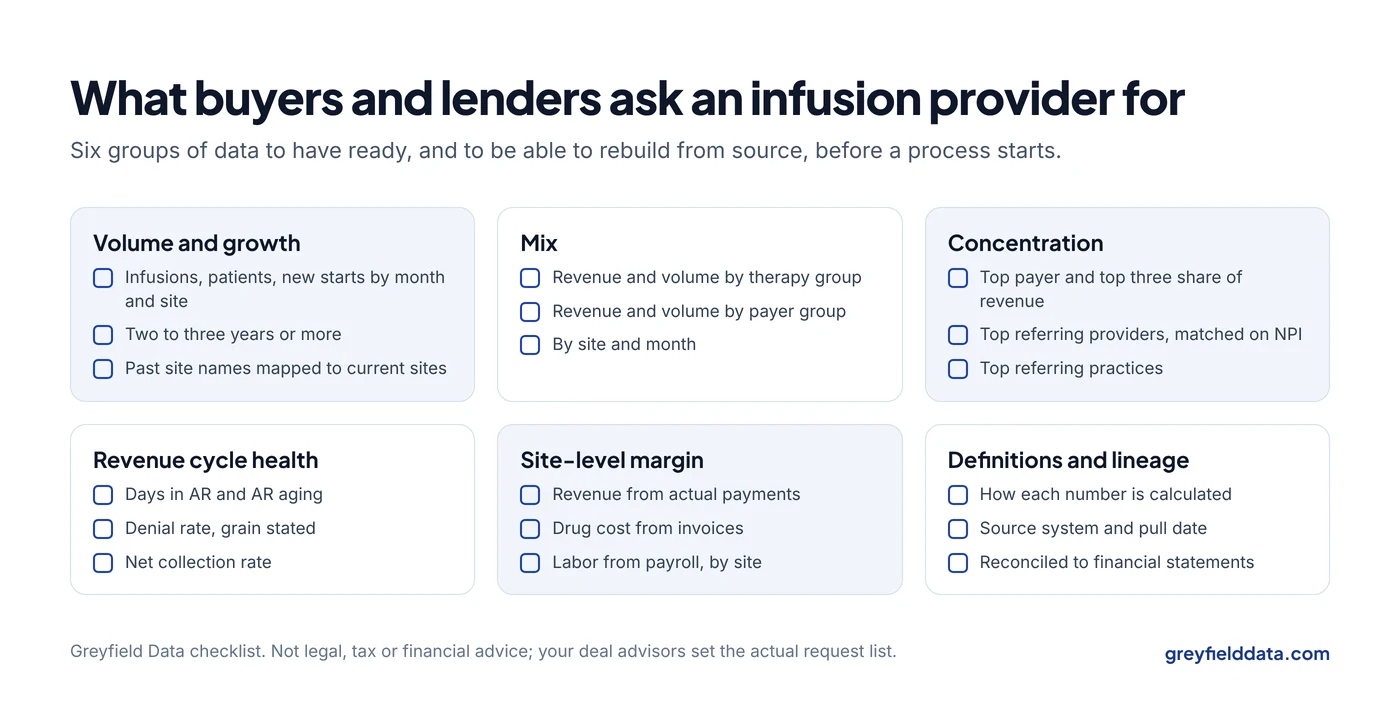
| Group | What they ask for | Grain and period | Where it usually comes from |
|---|---|---|---|
| Volume and growth | Infusions, patients, and new starts by month and site | Monthly, 2 to 3 years or more | Infusion EHR |
| Mix | Revenue and volume by therapy and by payer | Monthly by site | EHR plus billing and remittance |
| Concentration | Share of revenue from top payers and top referring providers | Annual and trailing 12 months | Billing plus EHR order data |
| Revenue cycle health | Days in AR, AR aging, denial rate, net collection rate | Monthly | Billing system and 835 remittance |
| Site-level margin | Revenue, drug cost, labor, and other direct costs by site | Monthly or quarterly | Remittance, invoices, payroll, general ledger |
| Definitions and lineage | How each number is calculated, from which system, with what exclusions | One document | Your team |
Why do multi-year trends by site matter?
Trends show whether growth is real and repeatable. A buyer wants to see that a site's volume grew steadily, not that one quarter jumped because a large referral source arrived.
Two things commonly break trends:
- Site history. A site that changed billing entity or name often appears as two locations. Map them to one site before you show a trend. The multi-site rollup guide explains how.
- Definition drift. If "infusions" meant orders one year and administrations the next, the trend shows a jump that never happened. The orders vs appointments guide explains the difference in WeInfuse data, and the WeInfuse reporting guide covers the rest of its reports.
WeInfuse is a trademark of its owner. Greyfield Data is independent and not affiliated with WeInfuse.
How do you show therapy and payer mix?
Show revenue and volume by therapy group and by payer group, by site, by month. Group therapies the way you manage them (for example biologics, immune globulin, iron, antibiotics, hydration) and payers by type (Medicare, Medicare Advantage, commercial, Medicaid, self-pay).
Mix matters because margin differs widely by drug and by payer. A buyer will want to know whether growth came from higher-margin or lower-margin work. If you can't yet tie payments back to the drug and payer, start with volume mix and say so. Payment terms that move with Medicare's quarterly drug rates are explained in the quarterly ASP update guide.
What is payer and referral concentration?
Concentration is how much of your revenue depends on a few payers or a few referring providers. Buyers and lenders look at it because losing one large payer contract or one referring group can change the business.
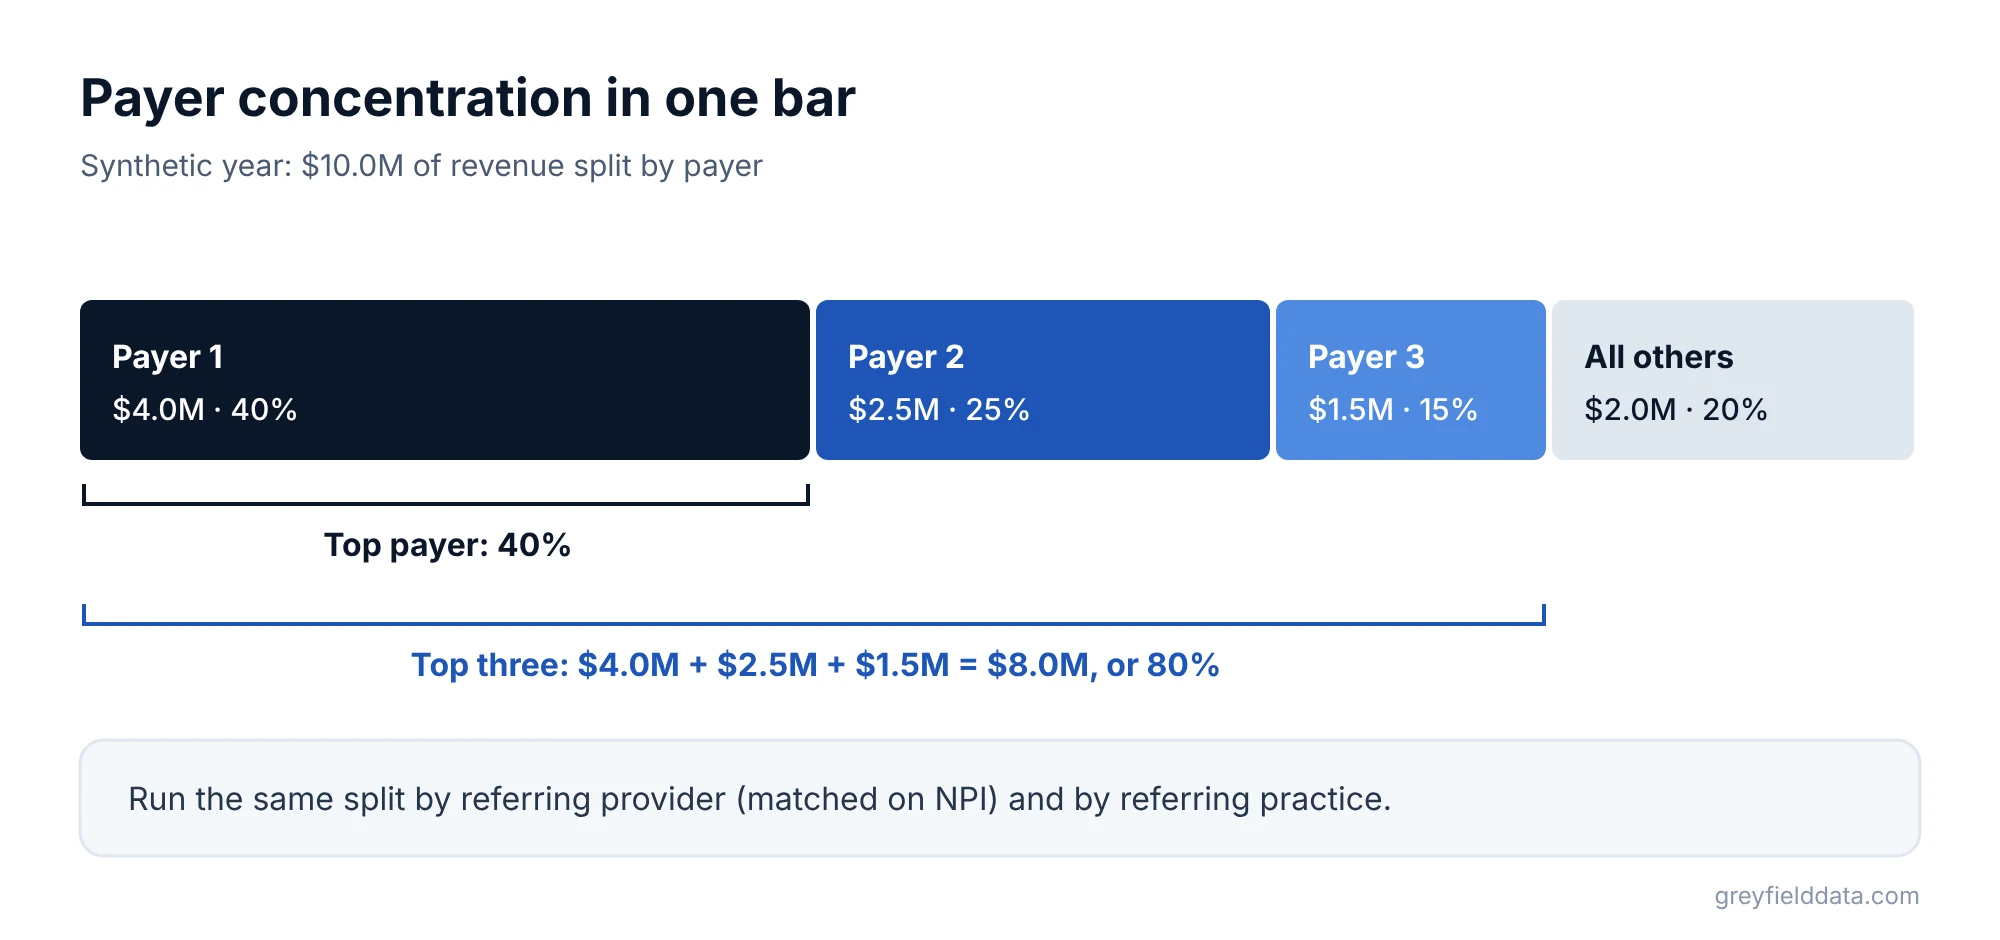
Here is a synthetic example of payer concentration for a year:
| Payer | Revenue | Share |
|---|---|---|
| Payer 1 | $4.0M | 40% |
| Payer 2 | $2.5M | 25% |
| Payer 3 | $1.5M | 15% |
| All others | $2.0M | 20% |
| Total | $10.0M | 100% |
Synthetic example. Payers and amounts are invented.
In this example the top payer is 40% of revenue, and the top three are $4.0M + $2.5M + $1.5M = $8.0M, or 80%. Do the same by referring provider and by referring practice. Referral concentration needs a clean provider key: match on NPI, not name, and decide whether you mean the ordering provider or the practice.
What does site-level margin need?
Site-level margin needs revenue, drug cost, and direct labor by site, at minimum.
Revenue should come from actual payments, not charges, as charges, claims, expected payment and collections explains. Drug cost should come from invoices (net of any rebates you can attribute), not list price. Labor should come from payroll, allocated to sites by where people work.
This is usually the longest piece to build, because the data sits in four systems that don't share keys. Start early. The CFO's guide to an infusion data warehouse shows how groups put those systems in one place and tie them to the books. The revenue leakage guide shows the stages from order to deposit that the margin calculation passes through, and the buy-and-bill margin calculator shows the per-dose math.
Why document data definitions?
Documenting definitions lets someone else rebuild your numbers and get the same answer. Without it, every difference between your figures and theirs becomes a question, and questions slow a process down.
For each metric you share, write:
- What is counted, and what one row means.
- The numerator, denominator, and date clock.
- Which statuses are included and excluded.
- Which system it comes from, and when it was pulled.
- Any known gaps, such as a period with incomplete data.
The infusion center KPI glossary shows the format I use.
How should you share data during diligence?
Share the least data that answers each request. Aggregated monthly figures by site, payer, and therapy answer most questions without patient-level detail.
When patient-level data is truly needed, work with your advisors on the HIPAA basis for sharing it, and consider de-identified extracts. HHS publishes guidance on de-identification and the minimum necessary standard.
Keep a log of what you sent, when, and from which query, so you can answer follow-ups with the same numbers.
When should you start building M&A readiness?
Start a year or more before you expect a process, or as soon as a transaction is a real possibility. That gives you time to fix site mappings, settle definitions, and build at least a few clean months on the new basis. Last-minute builds tend to produce numbers that don't tie to prior statements, which invites more questions.
Even if no deal happens, the same work gives you better board reporting, as in the board monthly finance pack guide. It is stage three of the infusion data maturity path.
What should an infusion M&A data readiness checklist include?
It should cover ten items, from multi-year site trends to a log of what you shared. Tick each one only when you can rebuild it from source data.
- Monthly infusions, patients, and new starts by site for at least two to three years
- One site list, with past names and billing entities mapped to current sites
- Revenue and volume by therapy group and payer group, by site
- Payer concentration: top payer and top three share of revenue
- Referral concentration by provider (matched on NPI) and by practice
- Days in AR, AR aging, denial rate, and net collection rate by month, with the grain stated
- Site-level margin from actual payments, invoice drug cost, and payroll
- A definitions document for every shared metric
- Reconciliation of reported revenue to your financial statements, with differences explained
- A log of what was shared and from which query
What to do next
Pick the three items on the checklist you're least confident in and try to rebuild last year's figure from source data. Where you can't, that's your work list.
For capacity questions a buyer may ask, the chair utilization calculator gives a quick baseline, and the infusion center metrics playbook collects the core definitions. Finance leaders scoping the build should read the CFO white paper on the infusion data warehouse. The infusion analytics resource hub links every related guide. If you want help building the numbers before a process starts, book a call with me.
Frequently asked questions
How do I know if my infusion company is ready for acquisition from a data standpoint?
You're in good shape if you can rebuild multi-year volume, mix, concentration, revenue cycle, and site margin figures from source data, get the same answer twice, and explain every definition. Gaps in any of those are your preparation list.
What's the financial impact of poor data on valuation?
It isn't something a data consultant can put a number on. In practice, numbers that can't be rebuilt or that change definition between periods lead to more diligence questions and less confidence in the figures. Your deal advisors can speak to valuation.
When should we start building M&A readiness analytics?
A year or more before a likely process, so you have time to fix site mappings, settle definitions, and build clean months on the new basis.
Should we share patient-level data in a data room?
Usually aggregated data answers most requests. If patient-level data is needed, decide the approach with your legal advisors and consider de-identified extracts.
Part of the Infusion analytics guides, a reading path through related articles.
Linus Tse
Founder of Greyfield Data. Built 400+ dashboards. Certified in Sigma, Snowflake, Tableau, and Power BI.
About Linus