How long will a new infusion site take to fill its chairs?
Model a new infusion site's ramp with three numbers: new patients a month, how long patients stay, and visits per patient, then find the referrals you need.

Written by Linus Tse, founder of Greyfield Data
· 8 min read
On this page 9 sections
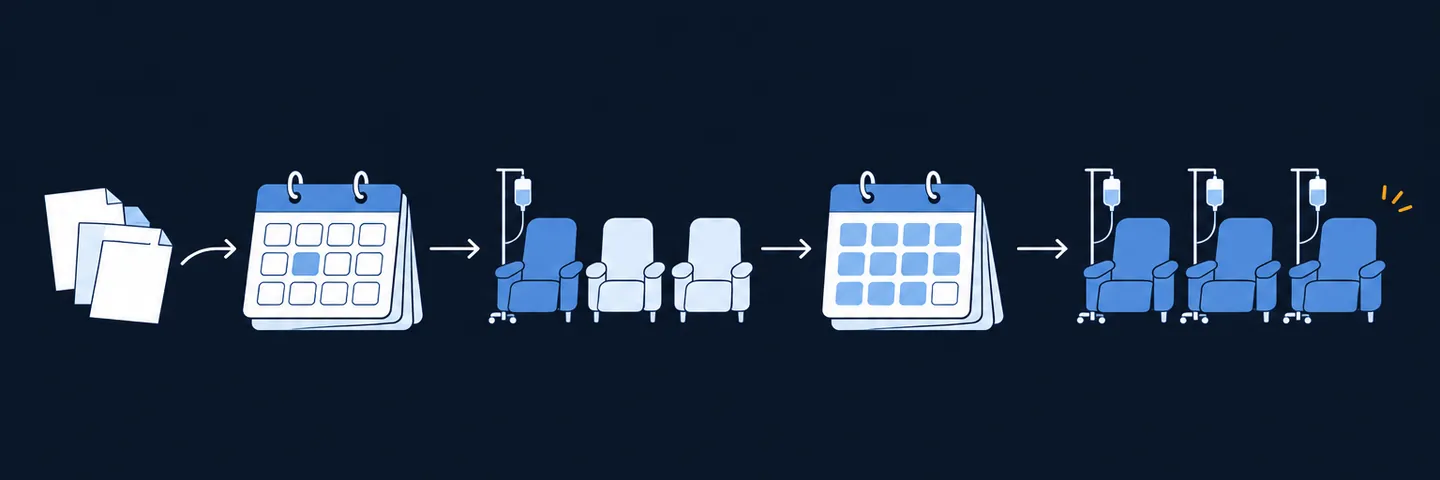
A new infusion site fills its chairs only as fast as its patient count builds. The patient count settles at new patients per month divided by the share of patients who finish or stop each month. That one rule tells you two things before you sign a lease: the most a site will ever reach at your expected referral rate, and roughly how long it takes to get close. Build the model from your current sites' own numbers, then track the new site against it every month.
I build reporting for ambulatory infusion centers that turns a growth plan into numbers the team can check monthly, from referrals to chair hours. To turn a visit count into chair use, try the infusion chair utilization calculator, and to see the nurses those visits need, the infusion staffing planner.
Key takeaways
- There is no public benchmark for ramp time. Model it from your own referral rate, patient retention, and visit frequency.
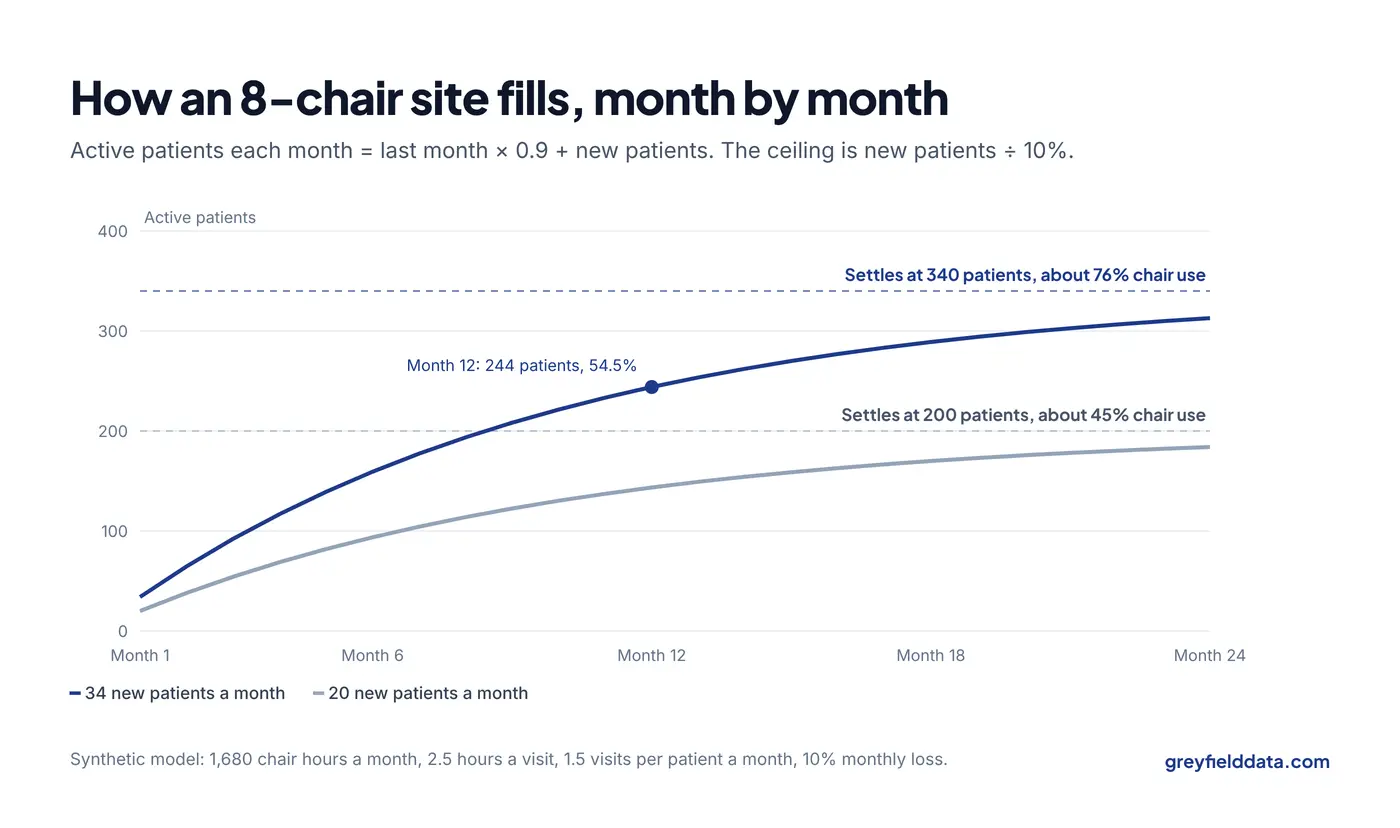
- Active patients settle at new patients a month ÷ monthly loss rate. At 34 new patients a month and 10% leaving each month, that's 340 patients.
- The ramp is slow by nature. With 10% of patients leaving each month, the site reaches about 90% of its settled patient count in about 22 months.
- Work backward from your target. Decide the chair use you need, convert it to visits and patients, then to the new patients a month that requires.
- Track three numbers monthly against the model: new patients started, active patients, and chair use.
Why isn't there a standard ramp time?
There isn't one, because ramp time depends on things that differ for every site.
- how many practices refer to you
- which payers you're in network with
- the drugs you give
- how long patients stay on therapy
The National Infusion Center Association (NICA) doesn't publish a ramp benchmark, and its own clinical guidance says there's no standard staffing model for infusion centers, in its post on optimizing an infusion center schedule. So model your own.
The good news is that you already have the inputs. Your existing sites know how many new patients a referral base produces, how long patients stay, and how often they come. The infusion center KPI glossary defines each of these measures.
Which numbers drive the ramp?
Five inputs, most of them from your current sites:
| Input | What it means | Where to get it |
|---|---|---|
| Chair hours available | Chairs × open hours a day × open days a month | Your plan for the site |
| Average chair time per visit | Hours a patient occupies a chair, including setup and observation | Your current sites' schedules |
| New patients a month | First infusions expected at the new site | Referral commitments and current sites' history |
| Visits per active patient a month | Average across your drug mix | Your current sites |
| Monthly loss rate | Share of active patients who finish, switch, or stop each month | Your current sites' patient history |
The loss rate is the one most plans leave out, and it changes everything. Short courses like iron or antibiotics lose patients fast. Long-term maintenance therapies keep them for years. Use your own mix. If you don't yet know how many referrals turn into first infusions, the referral to first treatment guide shows how to measure it.
How do you model the ramp month by month?
Each month, active patients = last month's active patients × (1 − loss rate) + new patients. Visits = active patients × visits per patient. Chair use = visits × chair time per visit ÷ chair hours available.
Here's a model for an 8-chair site. All numbers are synthetic: replace them with your own.
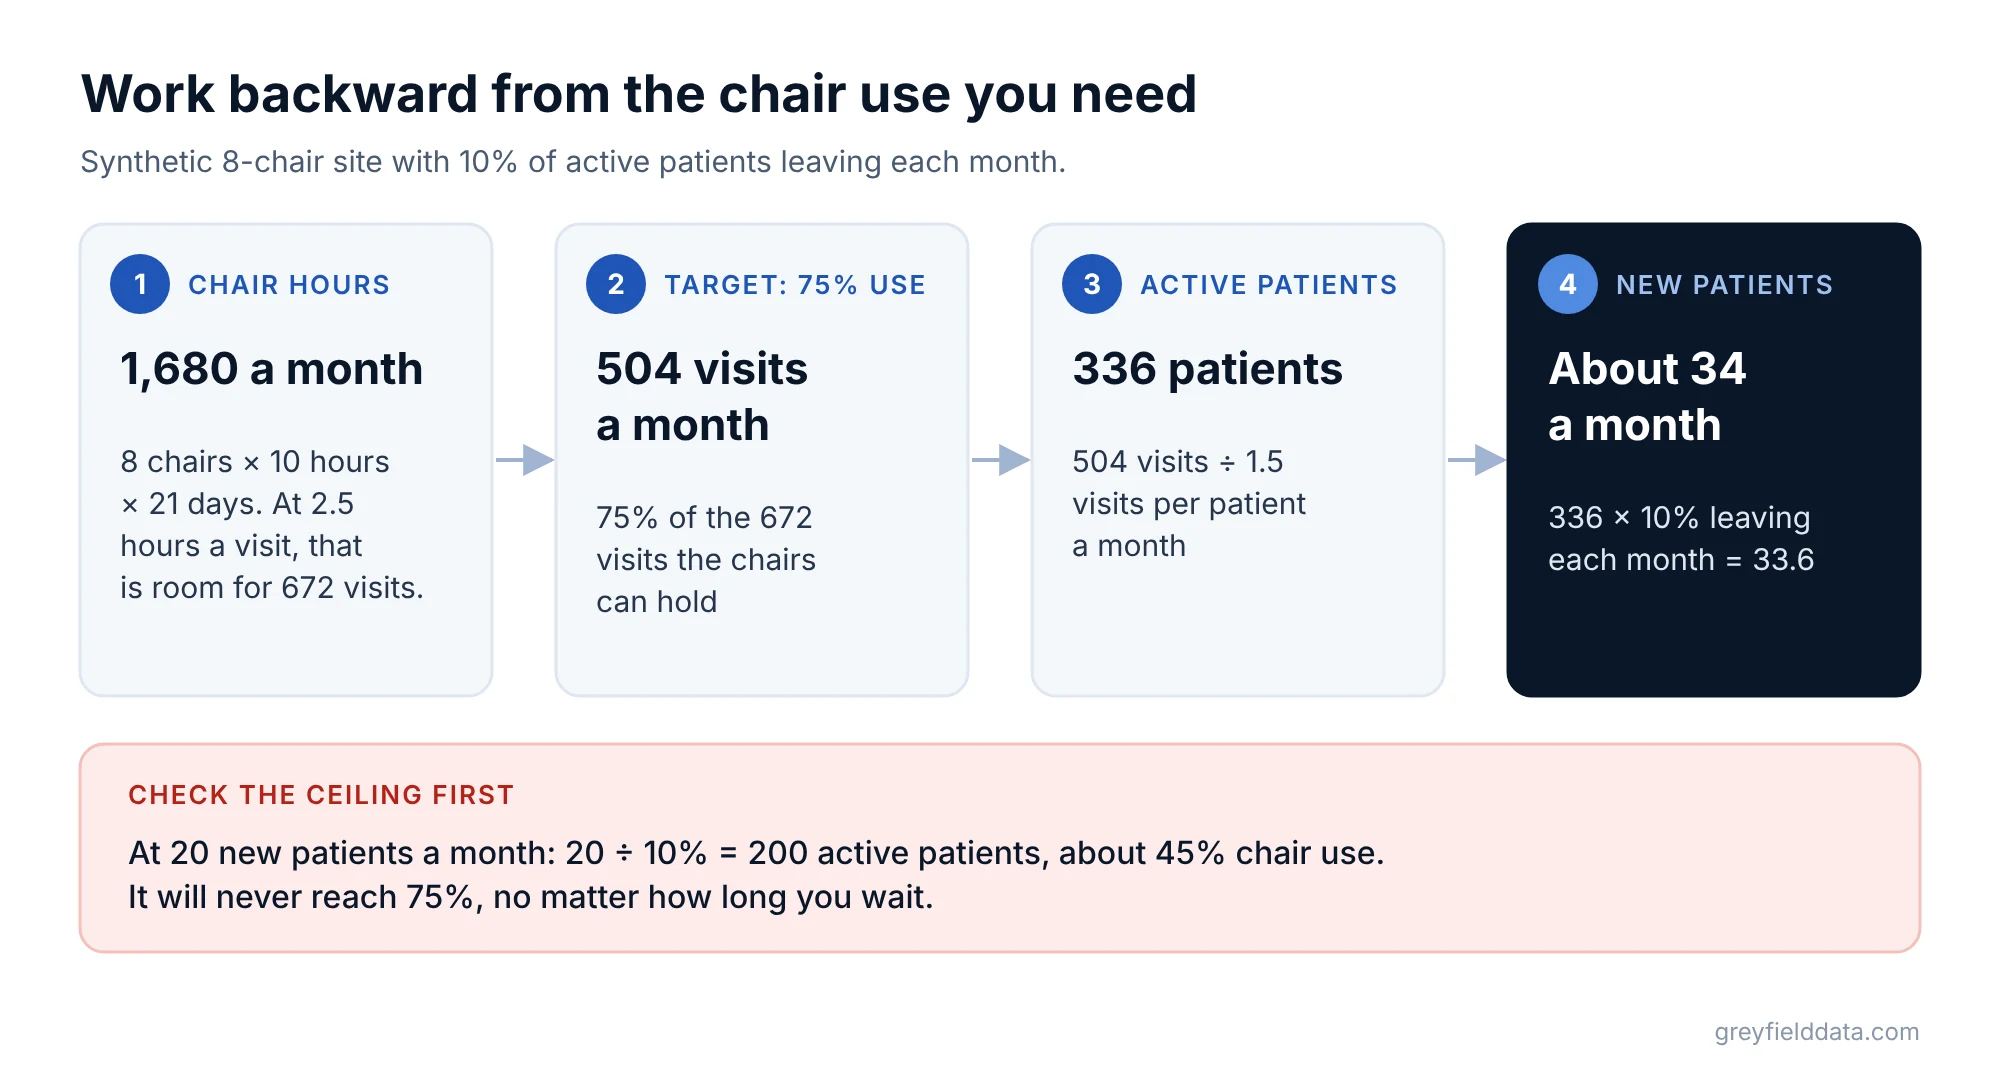
- Chair hours available: 8 chairs × 10 hours × 21 days = 1,680 a month
- Average chair time per visit: 2.5 hours, so 672 visits would fill every chair hour
- Target: 75% chair use, or 504 visits a month
- Visits per active patient: 1.5 a month
- Monthly loss rate: 10%
Two scenarios, 20 or 34 new patients a month:
| Month | Active patients at 20 new a month | Chair use | Active patients at 34 new a month | Chair use |
|---|---|---|---|---|
| 1 | 20 | 4.5% | 34 | 7.6% |
| 3 | 54 | 12.1% | 92 | 20.6% |
| 6 | 94 | 20.9% | 159 | 35.6% |
| 12 | 144 | 32.0% | 244 | 54.5% |
| 18 | 170 | 37.9% | 289 | 64.5% |
| 24 | 184 | 41.1% | 313 | 69.8% |
| Settles at | 200 | 44.6% | 340 | 75.9% |
Check month 12 at 34 new patients: 244 active patients × 1.5 visits = 366 visits. 366 × 2.5 hours = 915 chair hours, and 915 ÷ 1,680 = 54.5%.
What does the model tell you?
Three things, before you commit.
The ceiling. At 20 new patients a month, the site settles at 200 active patients and about 45% chair use. It will never reach 75%, no matter how long you wait. That's the most important answer the model gives, and it comes from one division: 20 ÷ 10% = 200.
The new patients you need. Work backward from the target. 504 visits ÷ 1.5 visits per patient = 336 active patients. 336 × 10% = 33.6, so about 34 new patients a month.
The time it takes. With a 10% monthly loss rate, the site closes half the gap to its settled level about every 6.6 months, and reaches about 90% of it in about 22 months. A lower loss rate raises the ceiling but makes the climb slower. That's the trade-off between long-term therapies and short courses.
What about nurses and space?
Staff the ramp, not the end state. A site at 20% chair use doesn't need the staff it will need at 70%.
Plan when each hire happens by the month the model crosses each visit level, and recheck as real numbers arrive. NICA's clinical guidance says an experienced infusion nurse may be able to start a patient about every 15 to 30 minutes, while a newer nurse needs more time, in the same scheduling post. That's one nurse's pace, not a staffing ratio. The staffing planner turns your visit count into nurse hours.
For space, commercial real estate brokers writing for NICA suggest roughly 75 to 150 square feet per chair in an open layout. For private rooms they suggest 120 to 180, in their guide to finding space for an infusion center. They also note there's no regulatory minimum size. Treat those as practitioner ranges and check your state's rules.
How do you track the real ramp?
Every month, put three actual numbers next to the model:
- New patients started at the site. If it's below plan, the ramp can't catch up on its own. Look at referrals, authorizations, and payer contracts.
- Active patients. If new patients are on plan but active patients lag, patients are leaving faster than you assumed.
- Chair use. If active patients are on plan but chair use lags, visits per patient or chair time are different from your assumption.
Each gap points to a different fix. Referral shortfalls are a sales and payer question. See where to open your next infusion site for choosing markets with enough referral base, and how to find infusion prescribers in Medicare data for the practices to call on. The referral leakage calculator shows how many referrals you lose before the first dose. Patient loss is often a scheduling, access, or cost problem. Pricing in the empty chairs while you ramp is the job of the no-show cost calculator.
When several sites ramp at once, the group view needs consistent definitions so a new site's numbers compare fairly with mature ones. See how to roll up multi-site infusion KPIs.
What to do next
Pull three numbers from your current sites: new patients a month per referring practice, monthly loss rate, and visits per patient. Put them into the model above for the site you're considering. Then check whether the expected referrals clear the ceiling you need.
The infusion center metrics white paper defines the monthly measures to track, and the infusion analytics resource hub collects the related guides. If you'd like the model built from your own history and tracked monthly once the site opens, book a call with me.
Frequently asked questions
How long does it take a new infusion center to reach capacity?
There's no reliable public benchmark. With 10% of patients leaving each month, a site reaches about 90% of its settled patient count in about 22 months. Your own loss rate and referral rate decide the real answer.
How many new patients does an infusion center need each month?
Work backward: target visits ÷ visits per patient gives active patients, and active patients × monthly loss rate gives new patients needed. In the example, 504 visits needs about 34 new patients a month.
How many chairs should a new infusion center start with?
Start with the chairs your expected patient count will use within your planning window, plus room to grow. Model the settled patient count first, then convert it to chair hours.
What chair utilization should a new infusion site target?
Set your own target from your margins and staffing. The model shows whether your expected referrals can reach it, and when.
Part of the Infusion analytics guides, a reading path through related articles.
Linus Tse
Founder of Greyfield Data. Built 400+ dashboards. Certified in Sigma, Snowflake, Tableau, and Power BI.
About Linus