Show payers your infusion center costs less than the hospital
Why payers steer infusion patients away from hospitals, what the research says, and how to prove your own cost advantage by drug and payer with public prices.

Written by Linus Tse, founder of Greyfield Data
· 8 min read
On this page 9 sections
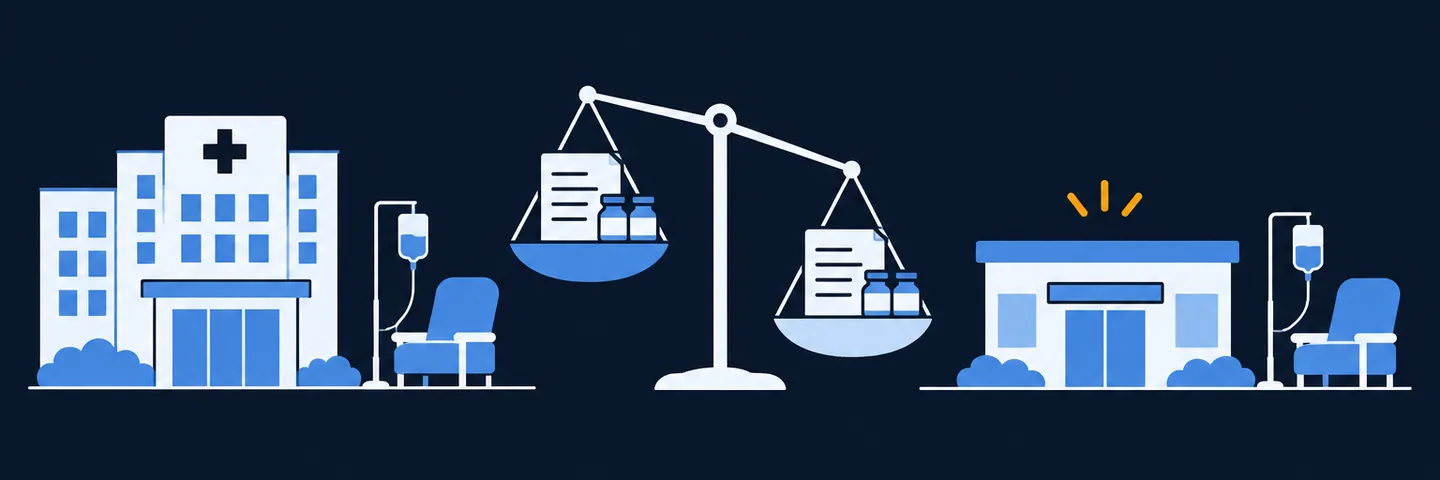
Payers steer infusion patients to non-hospital centers because the same drug usually costs them less there. Independent research on commercial claims found hospital outpatient departments averaged 76% higher spending than physician offices for physician-given drugs in 2021. To use that in a payer conversation, show your own version. For your top drugs, put your allowed amount per visit next to the same payer's negotiated rate at nearby hospitals. Hospitals are required to publish those rates. Then multiply the difference by your yearly visits.
I build reporting for ambulatory infusion centers that puts their prices next to the market's, drug by drug, so a contracts lead walks into a payer meeting with numbers. Start by knowing what each drug earns you with the buy-and-bill margin calculator. More on this work is on the infusion analytics page, and the infusion analytics resource hub collects the related guides.
Key takeaways
- Payers have a reason to send you patients: hospital outpatient prices for the same drug are usually higher.
- The best public evidence is from commercial claims. EBRI found hospital outpatient spending averaged 76% higher than physician offices in 2021 across 72 physician-given drugs.
- Your own numbers beat any study. Compare your allowed amount with the same payer's negotiated hospital rate for the same drug and code.
- Hospitals publish those rates. Since 2021, federal rules require hospitals to post a file with payer-specific negotiated charges for every item and service.
- Lead with savings in dollars per year, then add what the payer's members notice: lower cost share, faster first infusion, and open chairs.
Why do payers steer patients to infusion centers?
Payers steer patients because the same infusion usually costs them more in a hospital outpatient department than in a non-hospital center. Many run site-of-care programs that require or encourage members on certain drugs to move out of the hospital setting. Check each payer's medical policy for which drugs are included.
That's an opportunity and a risk. It's an opportunity because the payer already wants the patient in a setting like yours. It's a risk because payers can pick which centers they steer patients to. The centers that get picked are usually the ones that can show, in the payer's own terms, what they save.
Some payers steer drug supply too, by requiring white bagging from a specialty pharmacy. The white bagging revenue guide covers what that does to your margin. The white bagging waste calculator estimates the yearly cost of white-bagged doses that are never given.
What does the research say about the cost difference?
Two sources are worth knowing, and they're quite different in strength.
| Source | What it measured | Finding | How to use it |
|---|---|---|---|
| EBRI Fast Fact #469, May 2023 | Commercial claims for 72 physician-given outpatient drugs, hospital outpatient departments versus physician offices, 2021 | Hospital outpatient spending averaged 76% higher, weighted by use. The share of patients treated in hospital outpatient departments rose from 58% in 2019 to 63% in 2021. | Strong, independent evidence. Note it compares with physician offices, not infusion centers specifically. |
| NICA referral best practices sheet, July 2024 | The National Infusion Center Association's guidance for referring offices | Says infusion and injection services can cost 2 to 3 times more at hospital-affiliated centers than at non-hospital centers | A trade association's statement; the sheet doesn't give a method. Quote it as NICA's view. |
EBRI's same note found wide variation by place: the spending difference ranged from minus 2% to plus 181% across states. That's why your local numbers matter more than a national average. A payer in a market where hospital prices are close to yours won't be moved by a national figure.
How do you show your own cost advantage?
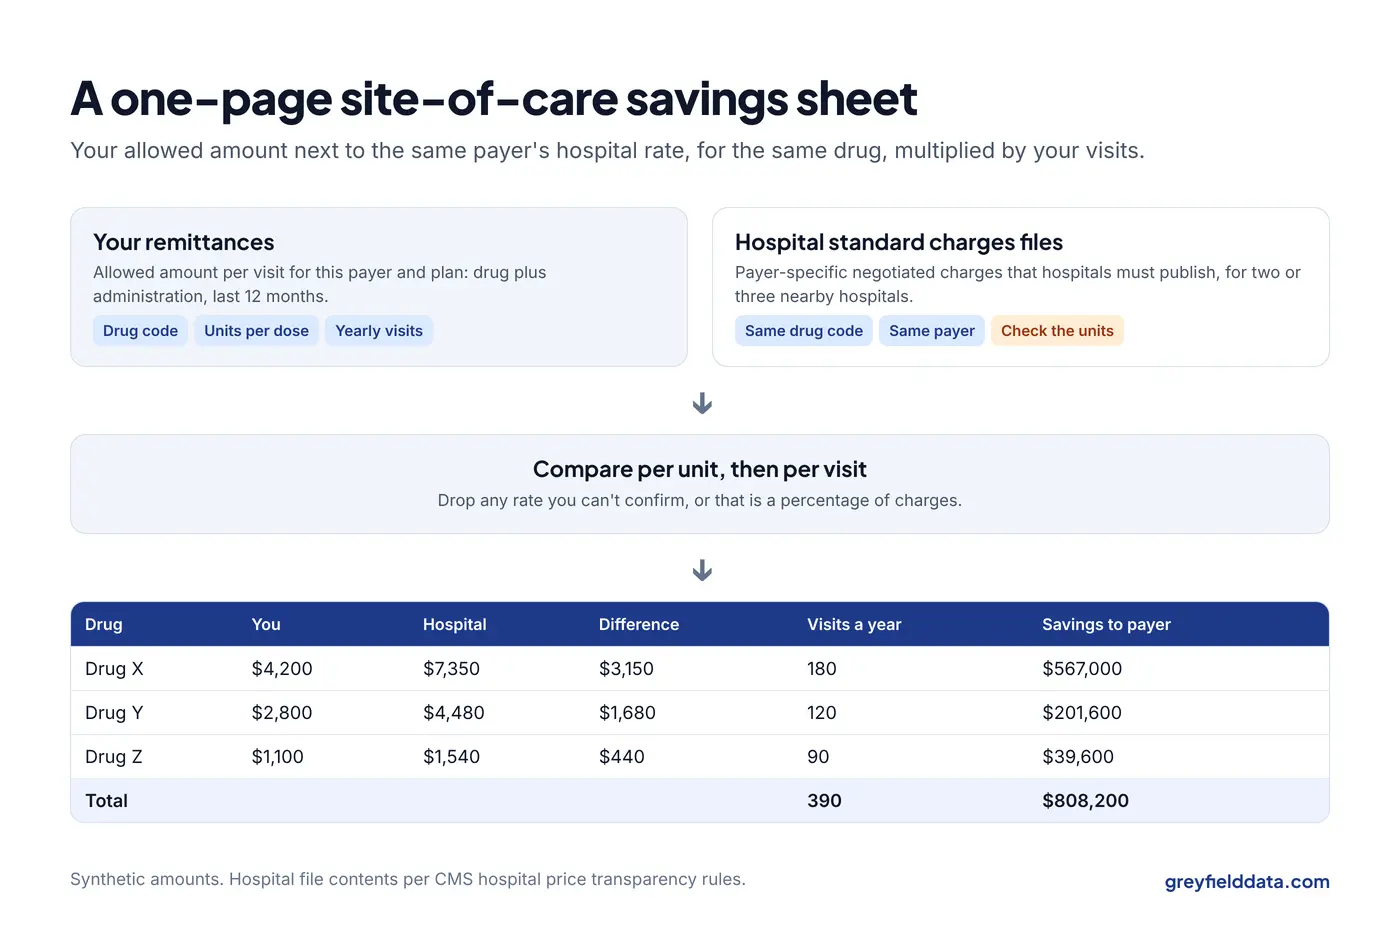
Compare what the payer pays you with what it pays nearby hospitals for the same drug and the same administration code. Four steps:
- Pick your top drugs for that payer. Five to ten drugs usually cover most of your spend with any one payer.
- Pull your allowed amount per visit from your remittances: drug plus administration, for that payer and plan, over the last year. The claims, charges and collections guide explains why allowed, not billed, is the right number.
- Find the hospital's negotiated rate. Hospitals must publish a machine-readable file of standard charges that includes gross charges, discounted cash prices, payer-specific negotiated charges, and the lowest and highest negotiated charges, under CMS's hospital price transparency rules. Look up the same drug code, administration code, and payer for two or three nearby hospitals.
- Multiply the difference by your yearly visits for that payer and drug.
Watch the units
This is where comparisons go wrong. Drug codes are billed in units, and one visit can be many units. Compare per unit first, then multiply by the units in a typical dose. Check the hospital's file for how it expresses the rate: per unit, per service, or as a percentage of charges. If a rate is a percentage, you can't compare it without the charge it applies to. Skip it rather than guess.
What does the comparison look like?
Here is a one-payer comparison for three drugs. All numbers are synthetic: replace them with your own allowed amounts and the hospital rates you find.
| Drug | Your allowed per visit | Nearby hospital negotiated rate per visit | Difference per visit | Your yearly visits with this payer | Yearly savings to the payer |
|---|---|---|---|---|---|
| Drug X | $4,200 | $7,350 | $3,150 | 180 | $567,000 |
| Drug Y | $2,800 | $4,480 | $1,680 | 120 | $201,600 |
| Drug Z | $1,100 | $1,540 | $440 | 90 | $39,600 |
| Total | 390 | $808,200 |
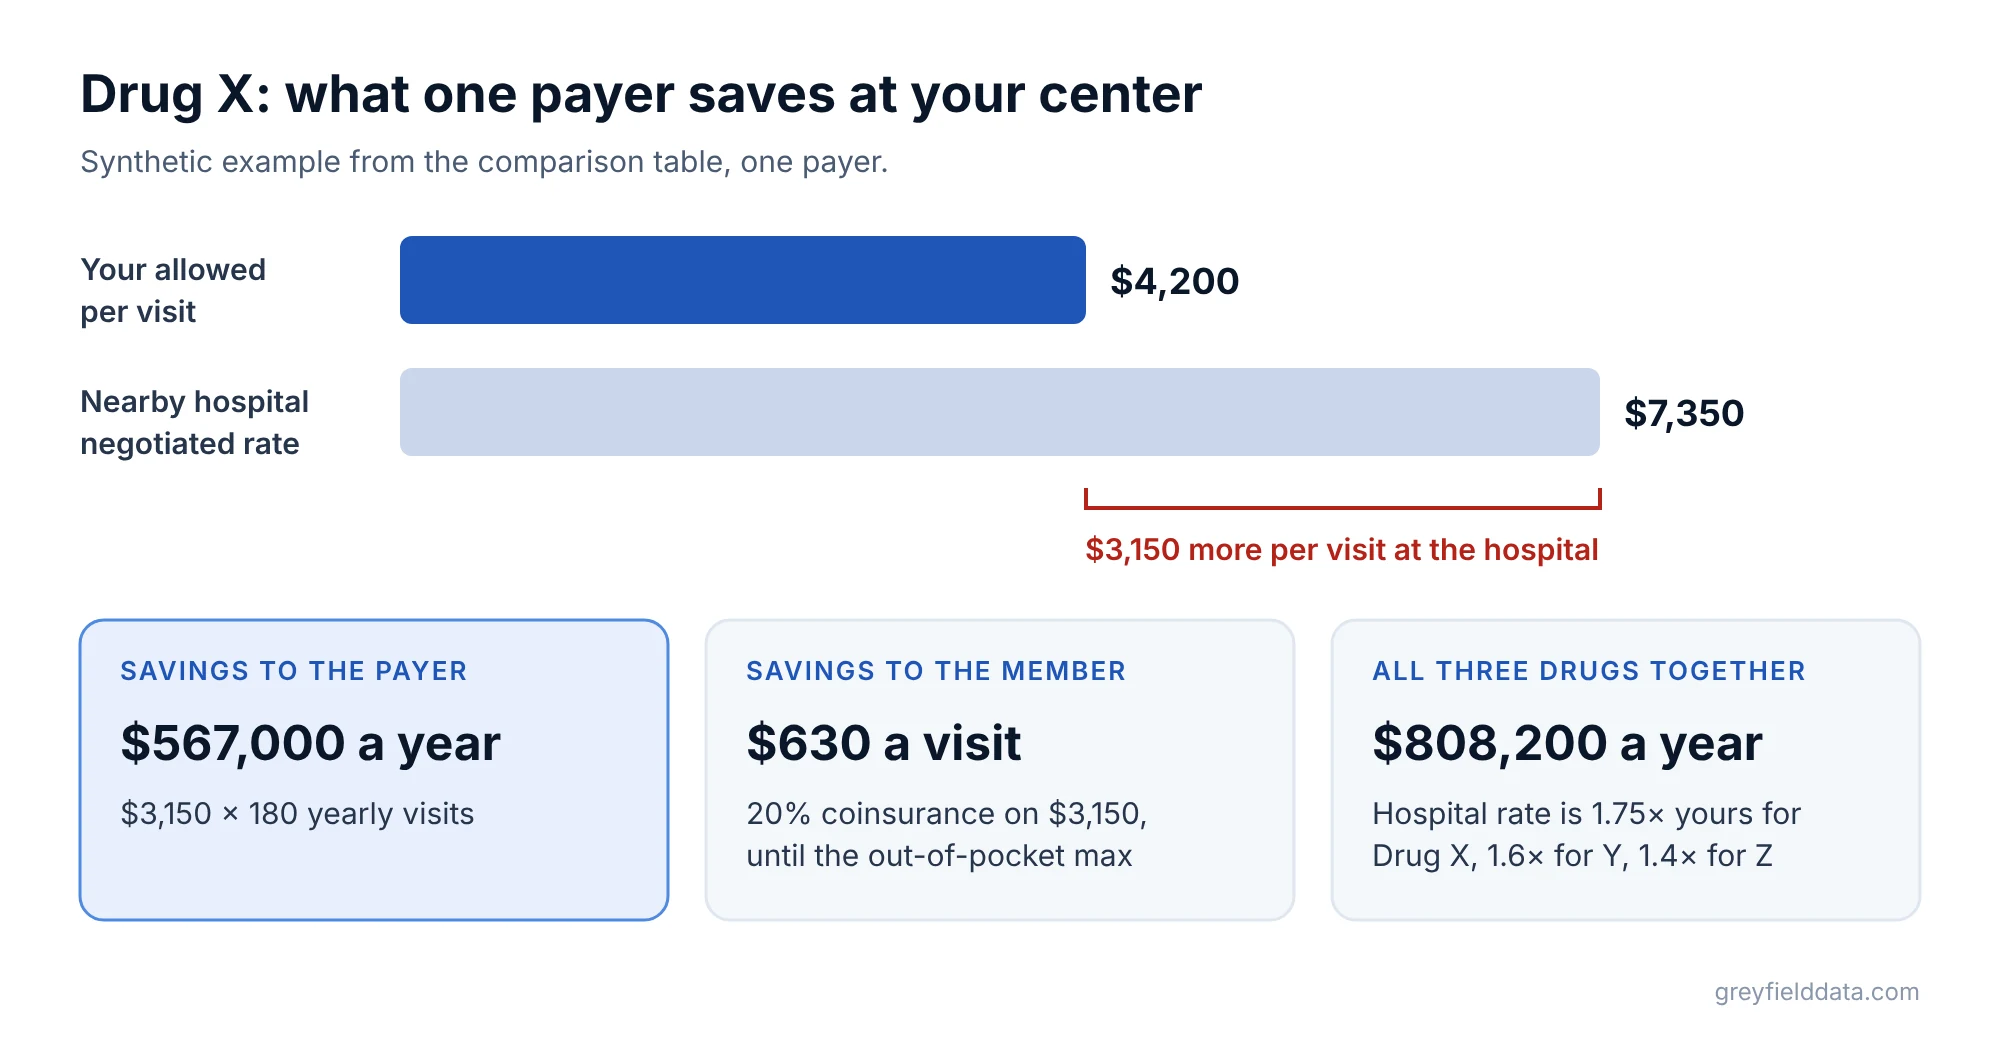
In this example the hospital rate runs 1.75 times yours for Drug X ($7,350 ÷ $4,200), 1.6 times for Drug Y, and 1.4 times for Drug Z. The total is what that payer would have spent if those 390 visits had happened in the hospital. To show a payer the value of each visit in a simpler form, see how to put a dollar value on an infusion visit.
Add what the payer's members save
Members pay coinsurance on the allowed amount until they reach their out-of-pocket maximum. With a synthetic 20% coinsurance, a member on Drug X saves 20% of $3,150, or $630 a visit, until the maximum is reached. Patient savings matter to a payer because members complain about surprise bills. Employers who buy the plan notice too.
What else should the sheet show?
Price is the headline, but payers also want to know you can take the patients. Add a few access numbers from your own records:
- Days from referral to first infusion, by payer. See where referrals stall before the first infusion.
- Days to the next open chair for a new patient. The referral leakage calculator shows what slow access costs in lost referrals.
- Chair capacity you can offer, in visits a month, from your utilization. The chair utilization calculator shows how much room you have.
- Prior authorization turnaround for that payer's members.
Keep the sheet to one page. A contracts lead needs one number per drug and a total, not a dashboard.
Where can this go wrong?
A few honest limits keep the sheet credible:
- Hospital files are messy. Codes, units, and plan names vary. Check every rate you use, and drop any you can't confirm.
- Negotiated rates are not always paid rates. The file shows the contracted rate, which is usually close to what's paid but not always.
- Drug mix matters. Some patients need a hospital setting for clinical reasons. Present savings for patients who are appropriate for your center.
- Your price can change too. Medicare drug payment updates every quarter, and many commercial contracts follow it. See how quarterly ASP updates move your drug margin. For drugs in Medicare price negotiation, the negotiated price exposure calculator estimates the change.
This post is educational and isn't legal or contract advice.
What to do next
Pick one payer you're meeting this quarter and build the three-drug version of the table above.
If the savings are large, ask that payer about its site-of-care program and how centers are chosen. To find the referring practices worth visiting next, see how to find infusion prescribers in Medicare data. The infusion center metrics white paper defines the access numbers payers ask for.
If you'd like the comparison built across all your payers and refreshed when hospitals update their files, book a call with me.
Frequently asked questions
How much more does infusion cost in a hospital outpatient department?
It varies by drug and market. EBRI found hospital outpatient spending averaged 76% higher than physician offices in 2021 across 72 physician-given drugs in commercial claims, with a range of minus 2% to plus 181% across states.
What is a site-of-care program?
It's a payer policy that requires or encourages members on certain infusion drugs to receive them outside a hospital outpatient department, usually in an infusion center, a physician office, or at home.
Where can I find what hospitals charge payers for infusion?
Hospitals must publish a machine-readable file with payer-specific negotiated charges for all items and services under federal price transparency rules. Search each hospital's website for its standard charges file.
How do I prove to a payer that my infusion center saves money?
Compare your allowed amount per visit with the same payer's negotiated hospital rate for the same drug and code, then multiply the difference by your yearly visits. Present one total per drug on one page.
Part of the Infusion analytics guides, a reading path through related articles.
Linus Tse
Founder of Greyfield Data. Built 400+ dashboards. Certified in Sigma, Snowflake, Tableau, and Power BI.
About Linus