How do you choose where to open your next infusion site?
Pick your next infusion site with public Medicare data, your referral concentration, drive times and payer mix, after checking your current sites are ready.

Written by Linus Tse, founder of Greyfield Data
· 8 min read
On this page 7 sections

Choose your next infusion site by checking four things for each candidate market.
- how many patients already get the drugs you give there, which public Medicare data shows
- how many practices could refer to you, and how concentrated they are
- how long patients would drive
- whether you're in network with the payers that cover most local patients
Before any of that, check that your current sites are ready: chairs mostly full, referrals starting treatment in a steady number of days, and reports you trust for each site.
I've built this kind of market view for a multi-state ambulatory infusion center group that was opening sites in new states. It needed to know which local doctors already treated patients on the drugs it gives. If your question is how quickly a new site would fill, model it with the infusion chair utilization calculator.
Key takeaways
- Readiness first. Expand when your current sites run near capacity, referral-to-treatment time is stable, and you can report each site's numbers without a week of spreadsheet work.
- Demand: free CMS files show, by clinician and by area, how many Medicare patients received the drugs you give (Part B by provider and service).
- Referral base: count the practices in the area that treat those patients, and check how much of the volume sits with a few of them. A market that depends on two practices is fragile.
- Access: measure drive time from where patients live, not distance on a map.
- Payers: check the share of local patients in Medicare Advantage (CMS state and county penetration files) and whether you're in network with the big commercial plans there.
How do I know if my infusion organization is ready to expand?
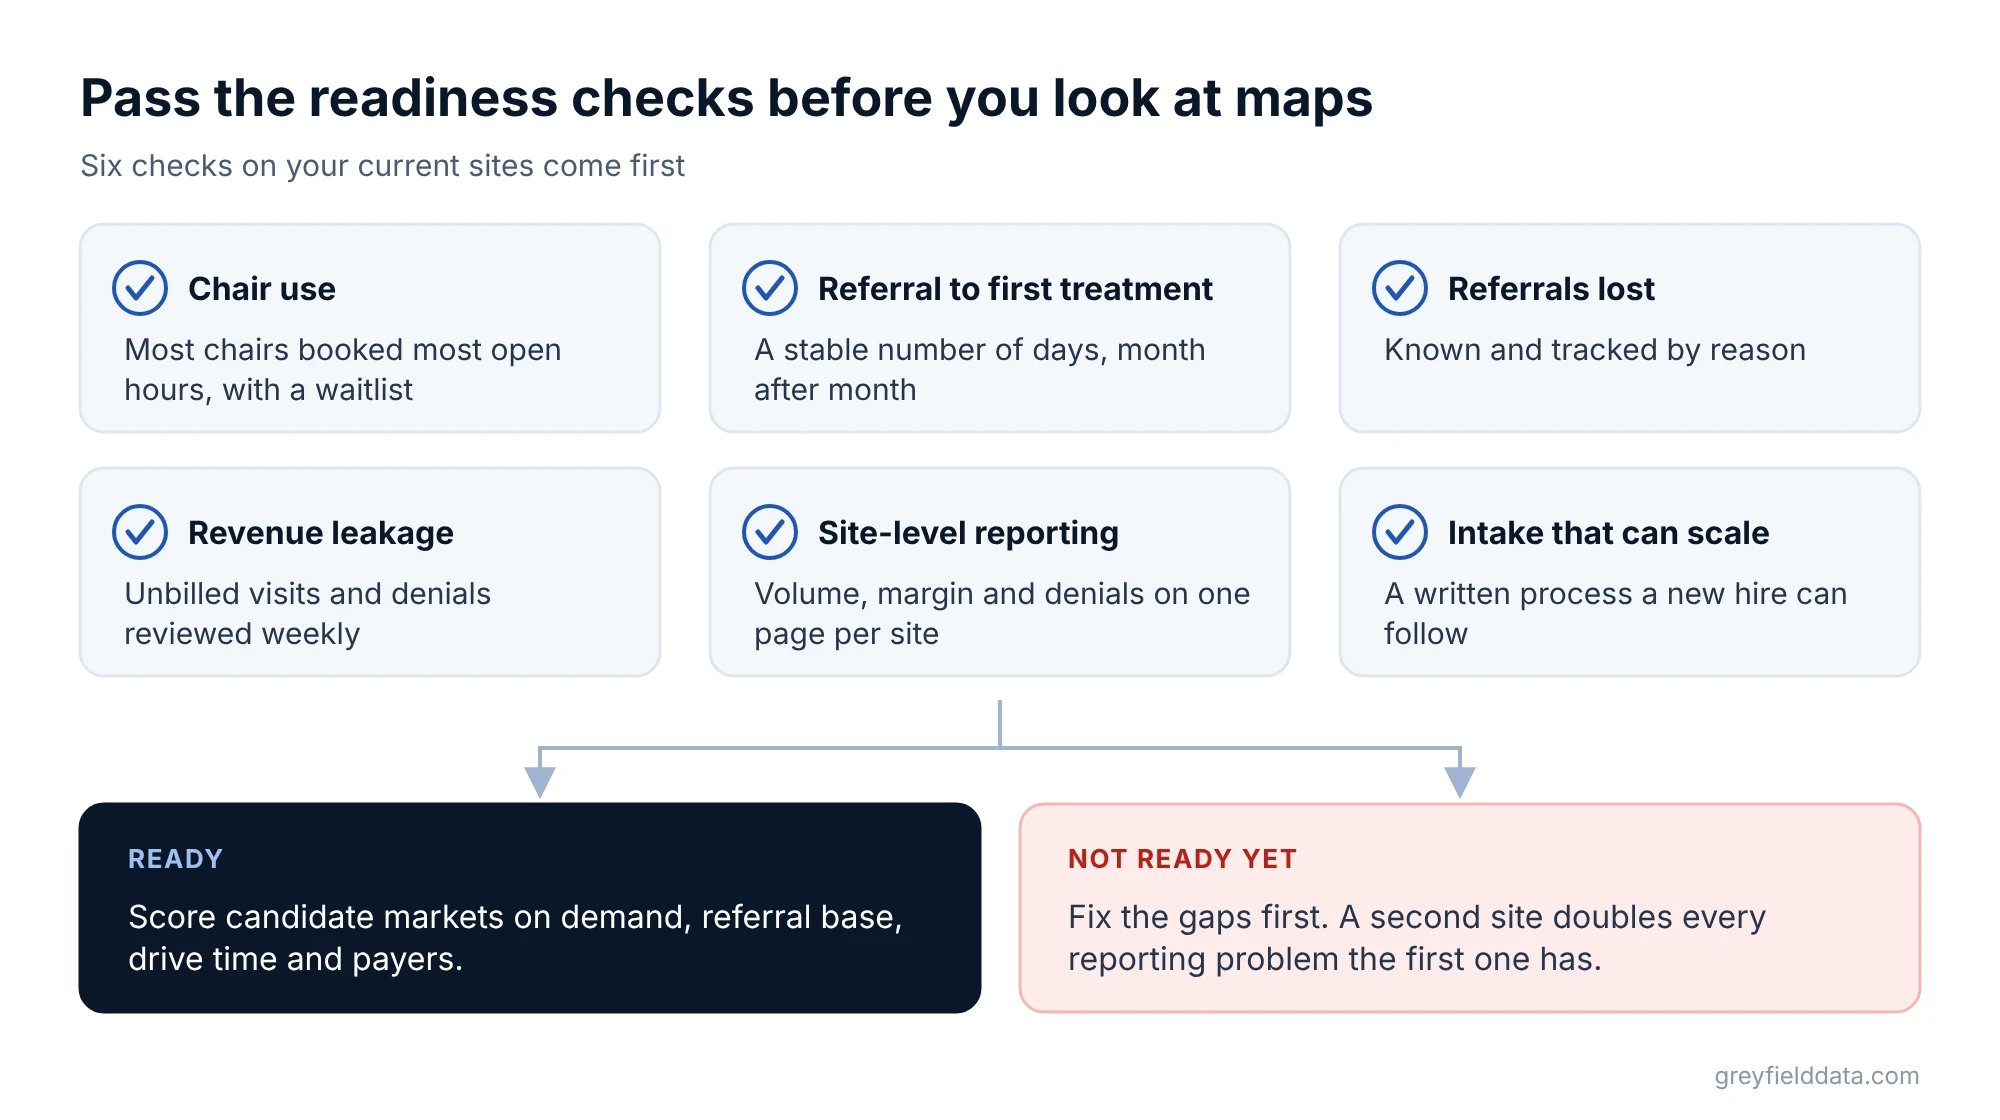
You're ready when your current sites are full enough, steady enough, and measured well enough that a new site won't hide problems you already have. Check these before you look at maps.
| Readiness check | Ready looks like | Where to find it |
|---|---|---|
| Chair use at current sites | Most chairs booked most of the open hours, with a waitlist or turned-away referrals | Schedule; chair utilization calculator |
| Referral to first treatment | A stable number of days, month after month | Referral-to-first-treatment guide |
| Referrals lost before treatment | Known and tracked by reason | Referral leakage calculator |
| Revenue leakage | Unbilled visits and denials reviewed weekly | Revenue leakage guide |
| Site-level reporting | Each site's volume, margin, and denials on one page | Multi-site KPI guide |
| Intake that can scale | A written process a new hire can follow | Your intake team |
If you can't answer most of the "where to find it" column today, fix that first. A second site doubles every reporting problem the first one has.
What data do I need to evaluate a new market?
You need four kinds of data for each candidate market: demand, referral base, access, and payers. Most of the first and last are free.
Demand: patients already receiving your drugs
The Medicare Part B provider file lists, for each clinician, the drug billing codes billed to Medicare, with counts of services and patients (data.cms.gov). Filter it to the drugs you give and to clinicians in the candidate area.
CMS also publishes a version by geography, and a Market Saturation and Utilization file by state and county that compares the number of providers with the number of patients for some service types.
The limits are real: these files cover traditional Medicare only, the newest data year is 2024, and rows from 10 or fewer patients are left out (methodology). Use them to rank markets, not to forecast your volume. The full walk-through is in how to find infusion drug prescribers with free Medicare data.
Referral base: how many practices, and how concentrated
Count the practices that treat patients on your drugs, and see how much of the volume sits with the biggest few. Use the same check on your own referrals at current sites.
Here is a concentration check for one market. All numbers are synthetic.
| Practice | Medicare patients on your drug codes | Share |
|---|---|---|
| Practice A | 120 | 120 ÷ 400 = 30% |
| Practice B | 80 | 20% |
| Practices C to J (8 practices) | 200 | 50% |
| Total | 400 | 100% |
Two practices hold half the volume. If one of them already infuses in its own office or has a relationship with a competitor, your real market is much smaller. Once a practice does refer, a referring provider portal helps keep it, and a fair value per visit keeps your sales team focused on the right practices. Note which large practices bill the drug themselves; the Part B file's place-of-service flag helps.
Access: drive time from where patients live
Patients choose sites they can reach, especially for long infusions every few weeks. Measure drive time from the ZIP codes where likely patients live to each candidate address, at the hours you'd be open.
The Census Bureau publishes ZIP Code Tabulation Areas you can use to group patients by area. For your current sites, check where your patients actually come from and how far they drive today. That's your best guide to how far patients will go in the new market.
Payers: Medicare Advantage share and your networks
Payer mix decides what a visit is worth and whether you can see the patient at all. Check two things:
- Medicare Advantage share. CMS publishes enrollment and penetration by state and county (MA state and county penetration). Where it is high, the free Part B data undercounts demand and your contracts with those plans matter more.
- Your network status. List the largest commercial and Medicare Advantage plans in the area and whether you are, or can get, in network. Credentialing in a new state can take months.
State rules also differ for infusion centers, such as facility licensing and supervision requirements. Check them with counsel before you sign a lease. This post isn't legal advice.
How do you compare candidate markets?
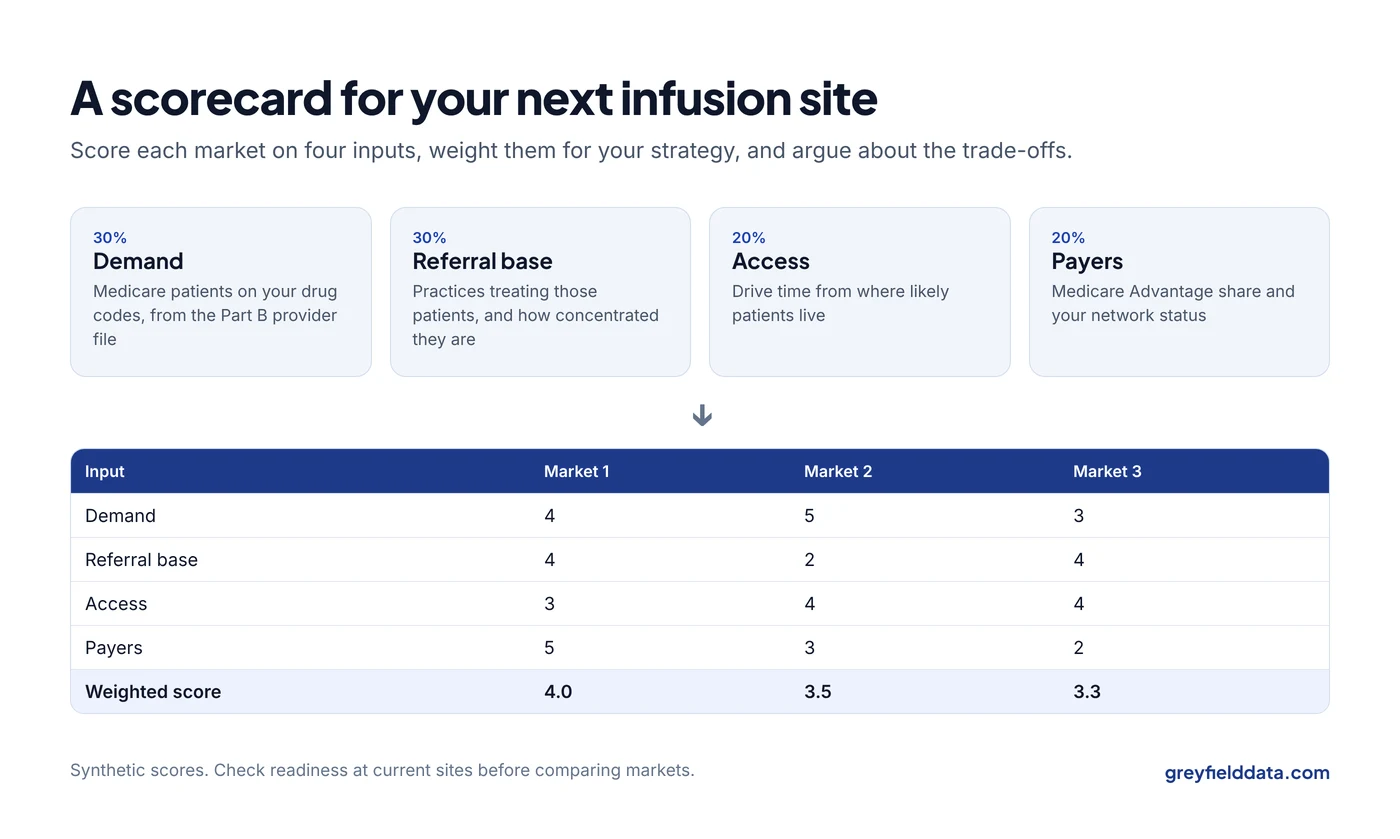
Score each market on the four inputs, weight them for your strategy, and compare. The scores below are synthetic.
| Input (weight) | Market 1 | Market 2 | Market 3 |
|---|---|---|---|
| Demand (30%) | 4 | 5 | 3 |
| Referral base and concentration (30%) | 4 | 2 | 4 |
| Drive time access (20%) | 3 | 4 | 4 |
| Payers and network (20%) | 5 | 3 | 2 |
| Weighted score | 4.0 | 3.5 | 3.3 |
How each score is calculated: Market 1 is 4 × 0.3 + 4 × 0.3 + 3 × 0.2 + 5 × 0.2 = 1.2 + 1.2 + 0.6 + 1.0 = 4.0. Market 2 is 1.5 + 0.6 + 0.8 + 0.6 = 3.5. Market 3 is 0.9 + 1.2 + 0.8 + 0.4 = 3.3.
Market 2 has the most demand but depends on few practices. Market 1 wins because the referral base is broad and you're already in network. Don't treat the score as an answer. Treat it as a way to make the trade-offs visible so the team argues about the right things.
How long does it take for a new infusion site to reach capacity?
There's no reliable public benchmark, because it depends on your referral base, payers, and chair count.
Model it instead: estimate monthly new patients from the practices you expect to refer, how long each patient stays on therapy, and how often they come. The chair utilization calculator shows what share of chair time that fills, and the no-show cost calculator shows what empty chairs cost while you ramp.
Then track the real ramp month by month against the model, and adjust staffing as you go. The new infusion site ramp guide walks through that model, and the infusion staffing planner turns each month's visits into nurse hours.
What to do next
Run the readiness checks on your current sites first. If they pass, pull the Part B provider file for two candidate markets and count practices and patients on your drug codes.
The infusion center metrics playbook defines the site numbers a new location should report from day one. The infusion analytics resource hub links every related guide. If you want the market view built once and kept current, book a call with me. More on this work is on the infusion analytics page.
Frequently asked questions
How do I know if my infusion organization is ready to expand?
You're ready when current sites are mostly full, referral-to-first-treatment time is stable, lost referrals are tracked, and you can report each site's volume, margin, and denials without manual work.
What data do I need to evaluate a new market?
You need demand (public Medicare data on the drugs you give), the referral base and its concentration, drive times from where patients live, and the payer mix and your network status in that area.
How long does it take for a new infusion site to reach capacity?
There's no reliable public benchmark. Model it from expected referrals, therapy length, and dosing frequency, then track the real ramp monthly against the model.
Can public Medicare data show demand for commercial patients?
No. The Part B provider file covers traditional Medicare only. Use it to rank markets, and check Medicare Advantage share and commercial networks separately.
Part of the Infusion analytics guides, a reading path through related articles.
Linus Tse
Founder of Greyfield Data. Built 400+ dashboards. Certified in Sigma, Snowflake, Tableau, and Power BI.
About Linus