The ecommerce data stack, mapped: 57 tools from storefront to dashboard
A map of the ecommerce data stack in 9 categories, from Shopify and Amazon to connectors, warehouses, packaged analytics, and BI, with what each tool does.

Greyfield Data
In this article 14 sections
An ecommerce brand’s numbers start in a dozen systems: storefronts, marketplaces, ad platforms, subscriptions, returns, fulfillment, and accounting. This map sorts 57 common tools by where they sit, from the systems that create the data to the tools that report on it.
If your channel numbers don’t agree, that is the problem Greyfield fixes. See ecommerce data warehouses and reporting, or put a number on the problem with the retention value calculator.
Key takeaways
- The data starts in four groups of systems: sales channels, post-purchase tools, marketing, and operations and finance. Profit needs all four.
- Connectors and a warehouse are what turn those systems into one set of numbers. Packaged analytics tools do the same job with their own definitions.
- Choose packaged analytics when its definitions match how you run the business, and a warehouse when they don’t. Each comparison linked below shows both sides.
- Reporting breaks at the joins: orders counted twice across channels, refunds on the wrong date, and fees that arrive after the sale.
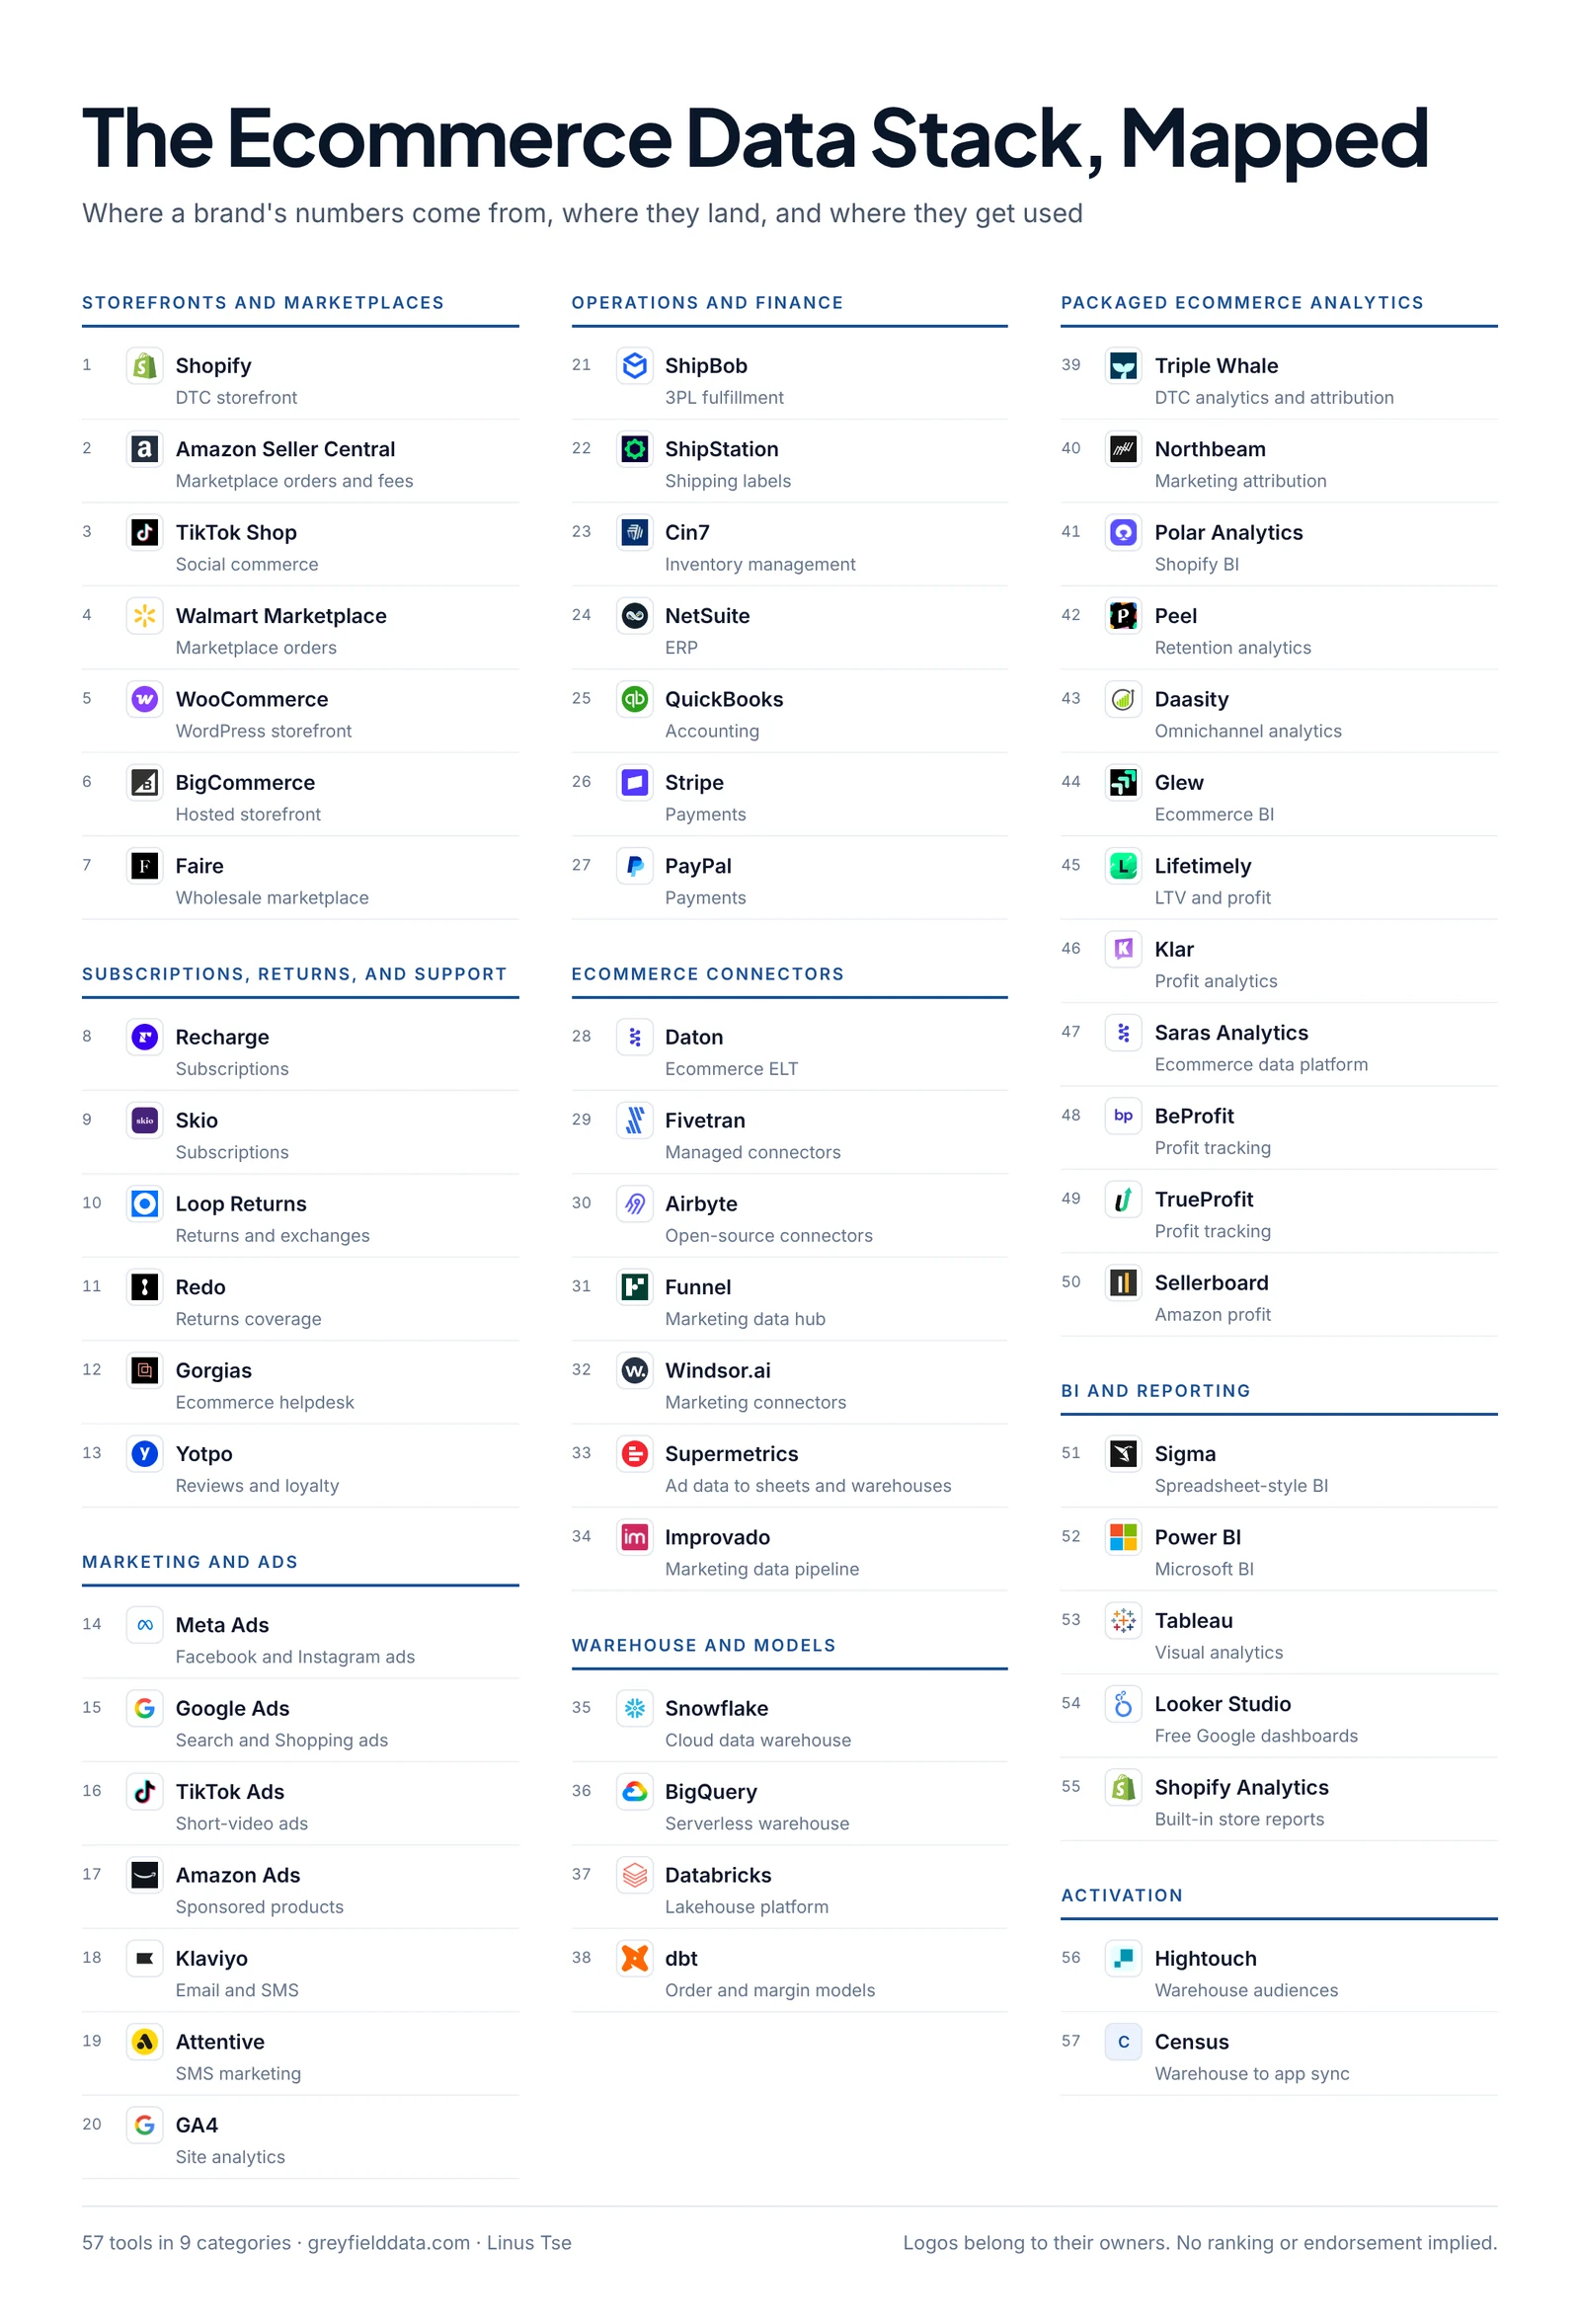
Download the full-size map (PNG)
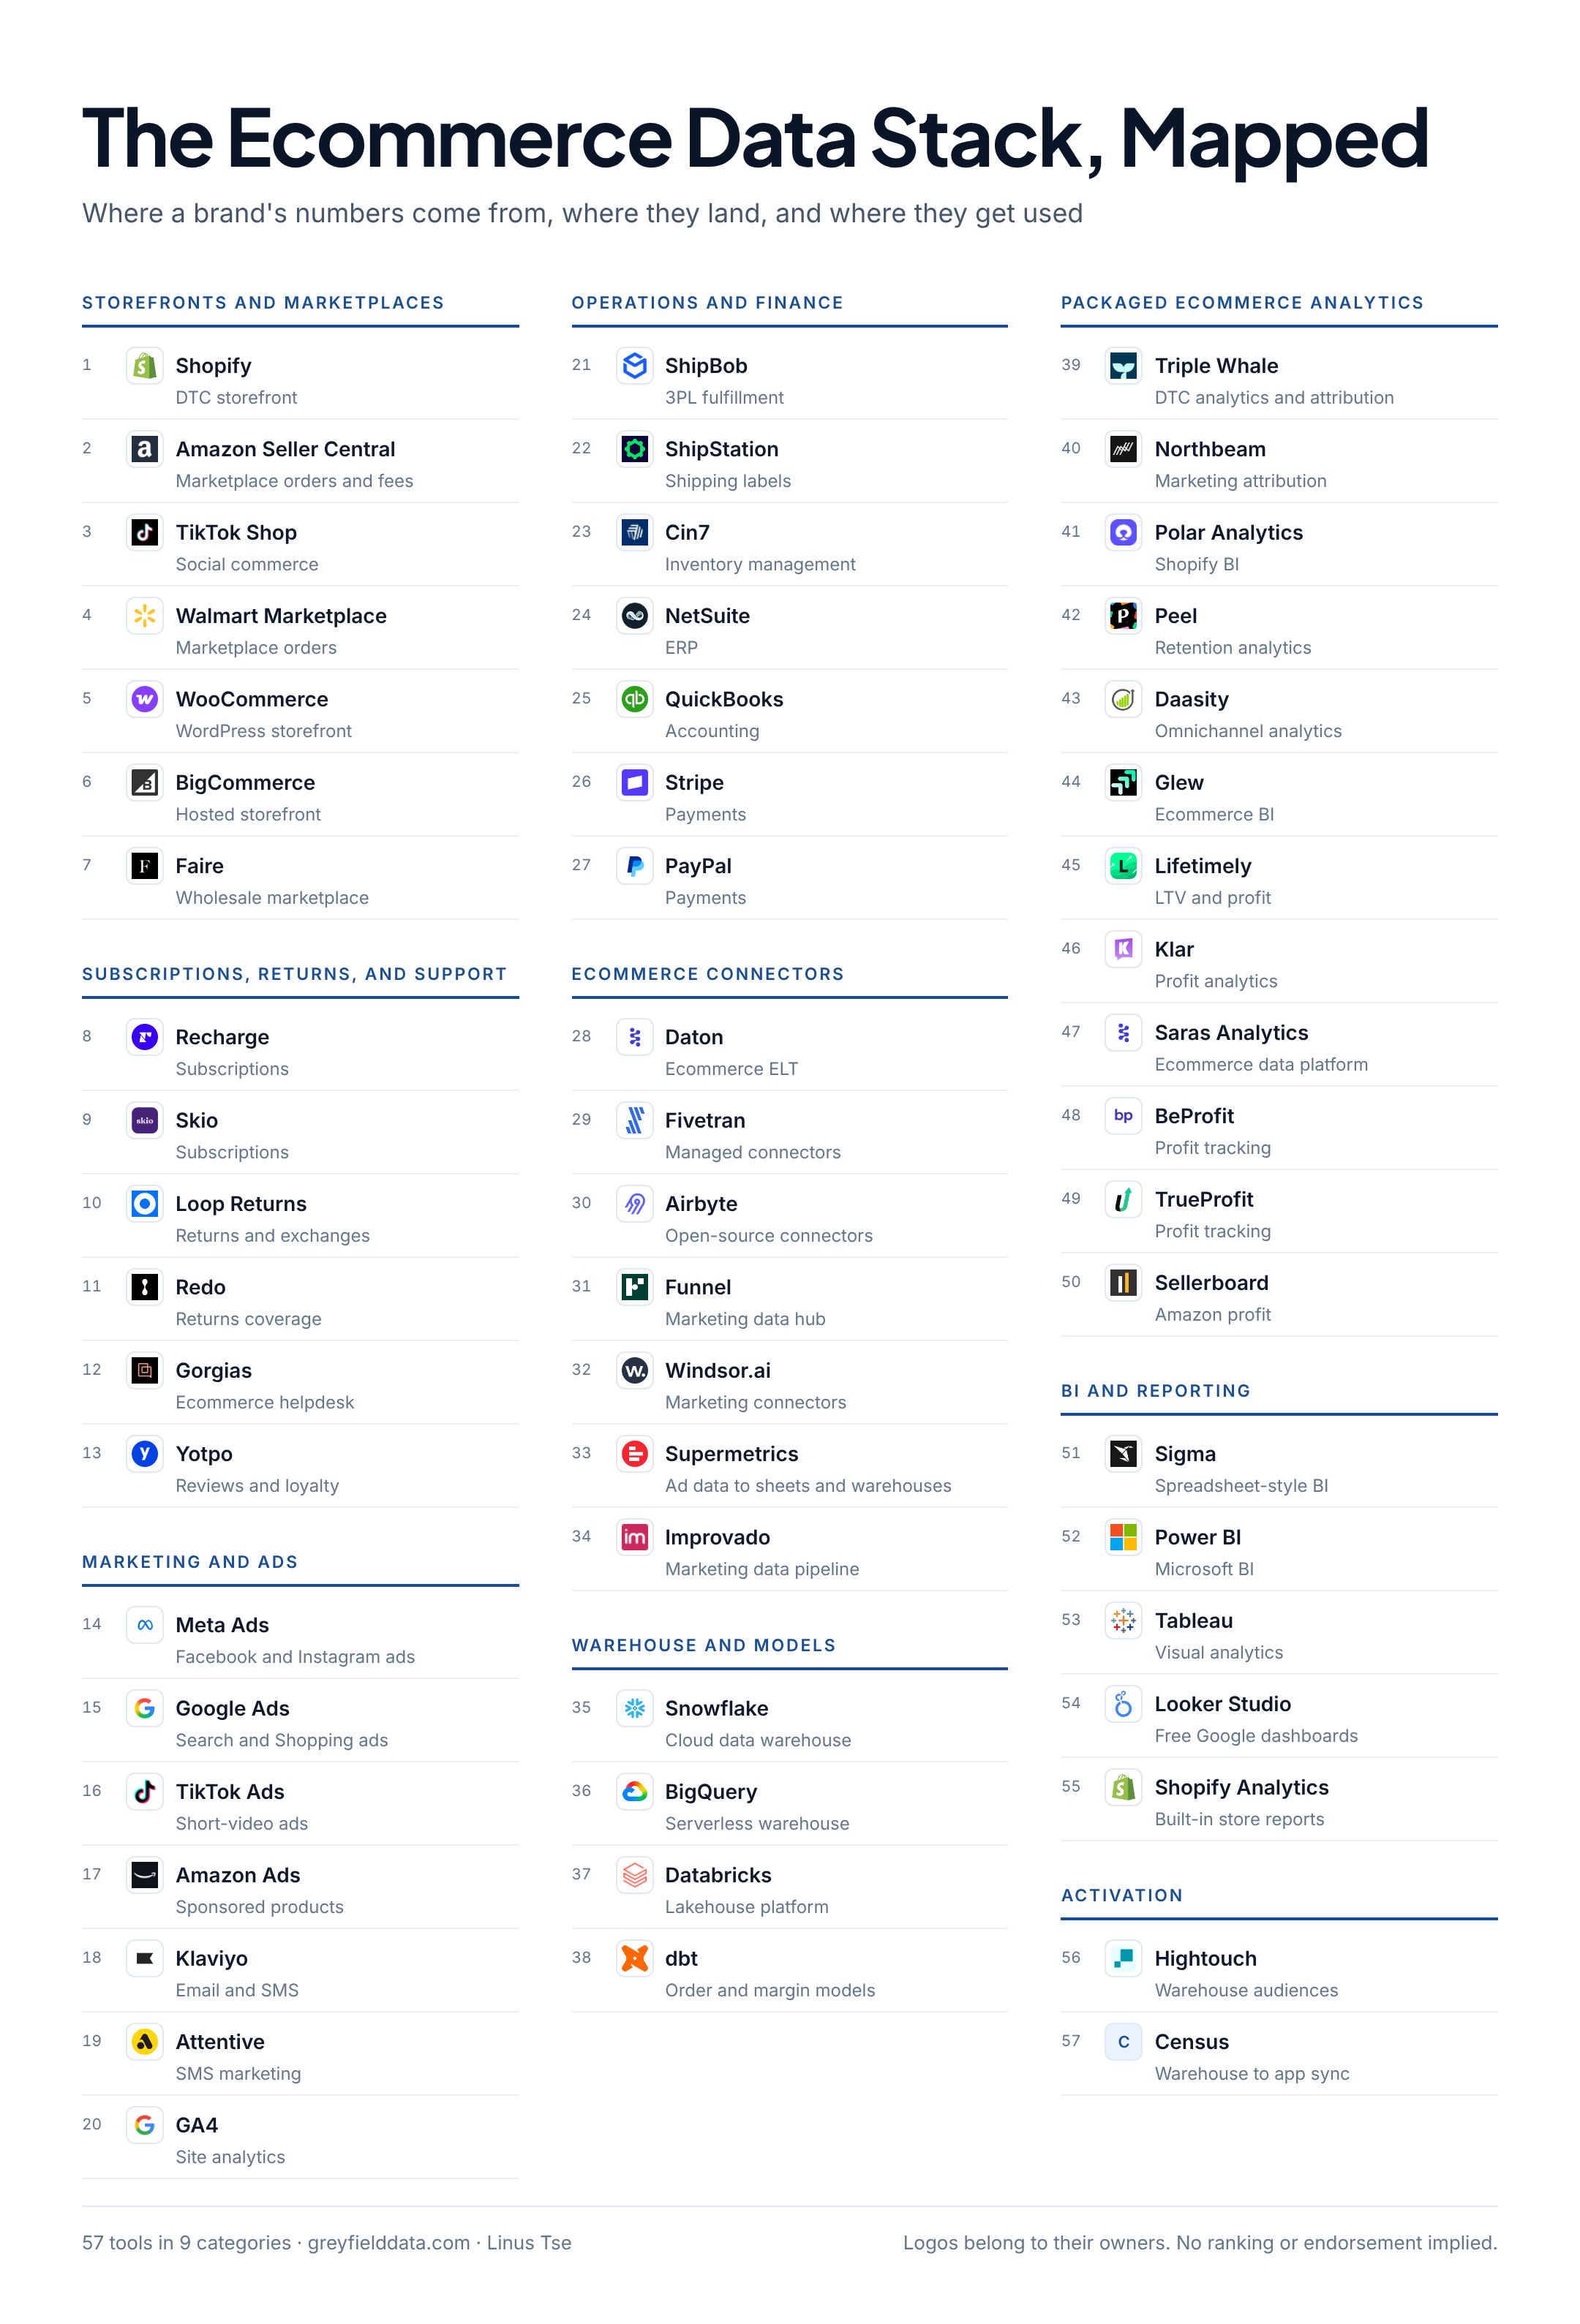
How to read the map
The first four columns are where data is created. Connectors move it, the warehouse and models define it, and the last groups report on it or send it back out. Numbers are for reference, not a ranking, and inclusion isn’t an endorsement.
Storefronts and marketplaces
Every sales channel records orders, refunds, and fees in its own format and on its own dates. This is why channel totals rarely match on their own. See how to avoid double-counting Shopify, Amazon, and TikTok orders.
| # | Tool | What it does | Compare |
|---|---|---|---|
| 1 | Shopify | DTC storefront | |
| 2 | Amazon Seller Central | Marketplace orders and fees | |
| 3 | TikTok Shop | Social commerce | |
| 4 | Walmart Marketplace | Marketplace orders | |
| 5 | WooCommerce | WordPress storefront | |
| 6 | BigCommerce | Hosted storefront | |
| 7 | Faire | Wholesale marketplace |
Subscriptions, returns, and support
These tools hold the second half of the customer story: renewals, returns, exchanges, and complaints. Retention and margin reporting need them joined back to the original order.
| # | Tool | What it does | Compare |
|---|---|---|---|
| 8 | Recharge | Subscriptions | |
| 9 | Skio | Subscriptions | |
| 10 | Loop Returns | Returns and exchanges | |
| 11 | Redo | Returns coverage | |
| 12 | Gorgias | Ecommerce helpdesk | |
| 13 | Yotpo | Reviews and loyalty |
Marketing and ads
Ad platforms report spend and their own view of conversions. Email and SMS tools hold engagement. Put together they explain acquisition cost, but each platform’s attribution counts differently. Four kinds of CAC covers which to use when.
| # | Tool | What it does | Compare |
|---|---|---|---|
| 14 | Meta Ads | Facebook and Instagram ads | |
| 15 | Google Ads | Search and Shopping ads | |
| 16 | TikTok Ads | Short-video ads | |
| 17 | Amazon Ads | Sponsored products | |
| 18 | Klaviyo | Email and SMS | |
| 19 | Attentive | SMS marketing | |
| 20 | GA4 | Site analytics |
Operations and finance
Fulfillment, inventory, payments, and accounting turn revenue into margin. Without shipping and payment fees, profit by order or channel is a guess.
| # | Tool | What it does | Compare |
|---|---|---|---|
| 21 | ShipBob | 3PL fulfillment | |
| 22 | ShipStation | Shipping labels | |
| 23 | Cin7 | Inventory management | |
| 24 | NetSuite | ERP | |
| 25 | QuickBooks | Accounting | |
| 26 | Stripe | Payments | |
| 27 | PayPal | Payments |
Ecommerce connectors
Connectors move data from the systems above into a warehouse or a spreadsheet. Ecommerce-focused tools cover marketplace and ad APIs that general ones may not. Fivetran, Airbyte, and Daton compared.
| # | Tool | What it does | Compare |
|---|---|---|---|
| 28 | Daton | Ecommerce ELT | |
| 29 | Fivetran | Managed connectors | |
| 30 | Airbyte | Open-source connectors | |
| 31 | Funnel | Marketing data hub | Compare with a custom warehouse |
| 32 | Windsor.ai | Marketing connectors | Compare with a custom warehouse |
| 33 | Supermetrics | Ad data to sheets and warehouses | Compare with a custom warehouse |
| 34 | Improvado | Marketing data pipeline | Compare with a custom warehouse |
Warehouse and models
The warehouse stores everything in one place and the models define orders, customers, and margin once. This is the layer that makes numbers agree across teams. See common ecommerce data sources for a warehouse.
| # | Tool | What it does | Compare |
|---|---|---|---|
| 35 | Snowflake | Cloud data warehouse | |
| 36 | BigQuery | Serverless warehouse | |
| 37 | Databricks | Lakehouse platform | |
| 38 | dbt | Order and margin models |
Packaged ecommerce analytics
Packaged tools give you dashboards fast, built around their own definitions. They are a good fit when those definitions match your business; a custom warehouse is a better fit when they don’t. Each comparison below is sourced and shows where the packaged tool is the better choice.
| # | Tool | What it does | Compare |
|---|---|---|---|
| 39 | Triple Whale | DTC analytics and attribution | Compare with a custom warehouse |
| 40 | Northbeam | Marketing attribution | Compare with a custom warehouse |
| 41 | Polar Analytics | Shopify BI | Compare with a custom warehouse |
| 42 | Peel | Retention analytics | Compare with a custom warehouse |
| 43 | Daasity | Omnichannel analytics | Compare with a custom warehouse |
| 44 | Glew | Ecommerce BI | Compare with a custom warehouse |
| 45 | Lifetimely | LTV and profit | Compare with a custom warehouse |
| 46 | Klar | Profit analytics | Compare with a custom warehouse |
| 47 | Saras Analytics | Ecommerce data platform | Compare with a custom warehouse |
| 48 | BeProfit | Profit tracking | Compare with a custom warehouse |
| 49 | TrueProfit | Profit tracking | Compare with a custom warehouse |
| 50 | Sellerboard | Amazon profit | Compare with a custom warehouse |
BI and reporting
BI tools sit on top of the warehouse or packaged tool so teams can build the views they need.
| # | Tool | What it does | Compare |
|---|---|---|---|
| 51 | Sigma | Spreadsheet-style BI | |
| 52 | Power BI | Microsoft BI | Compare with Sigma |
| 53 | Tableau | Visual analytics | Compare with Sigma |
| 54 | Looker Studio | Free Google dashboards | |
| 55 | Shopify Analytics | Built-in store reports | Compare with a custom warehouse |
Activation
Activation tools push warehouse audiences and scores back to marketing platforms, so targeting uses the same definitions as reporting.
| # | Tool | What it does | Compare |
|---|---|---|---|
| 56 | Hightouch | Warehouse audiences | |
| 57 | Census | Warehouse to app sync |
Packaged analytics or your own warehouse?
| Packaged analytics | Warehouse and BI | |
|---|---|---|
| Time to first dashboard | Days | Weeks |
| Metric definitions | The vendor’s | Yours, written down |
| Sources covered | The vendor’s connectors | Any source you can load |
| Best when | Your business fits their model | Channels, fees, or definitions are specific to you |
Many brands use both: a packaged tool for daily marketing views and a warehouse for finance, margin, and anything that has to tie out.
Frequently asked questions
What is an ecommerce data stack?
It is the set of tools that collect, move, store, and report on a brand’s data: sales channels, marketing and operations systems, connectors, a warehouse, and reporting tools.
Do I need a data warehouse for Shopify?
Not at first. Shopify’s reports or a packaged tool can be enough for a single channel. A warehouse earns its place when you sell on several channels, need margin after all fees, or need finance and marketing to agree.
Which numbers usually disagree first?
Revenue across channels, refunds by date, and profit before marketplace fees settle. See refund date vs order date and why Amazon profit changes after the sale.
Where do retention numbers come from?
From joining orders, customers, subscriptions, and returns, then counting only customers who have had time to come back. The customer retention dashboard in Sigma shows how.
What to do next
See the general data stack map for the layers beyond ecommerce, or book a call to talk through your channels and reports.
Part of the Ecommerce reporting guides, a reading path through related articles.
Related

Ecommerce semantic layer: a metric dictionary for gross sales to LTV
Definitions for gross sales, net sales, net revenue, contribution margin, CAC, repeat rate, and LTV, with grain, date, sources, owner, and a free template.
How do you track a customer across Shopify, Klaviyo, Recharge, and your ad platforms?
Build one customer view by stitching IDs into an identity table and loading every touchpoint into one events table. With a schema, SQL, and a working demo.
How do you combine Shopify, Klaviyo, and Recharge data into one customer view?
Join Shopify, Klaviyo, and Recharge on the right keys, count each renewal once, and keep skips as events so one customer timeline holds up.