A customer retention dashboard in Sigma, in five reports
A public Sigma workbook for a consumer brand that answers five retention questions, from who is buying to who came back after a break. Built on synthetic data you can explore.

Greyfield Data
In this article 8 sections
A retention dashboard is only useful if each page answers one question someone actually asks. This Sigma workbook splits retention into five of them: who is buying, do first-time buyers come back, how often do customers buy over two years, what do they buy next, and who returns after a break.
It runs on synthetic data for Willow, a made-up menswear brand, so you can open it and click around: explore the Consumer Brand Retention Starter Pack on Sigma Public.
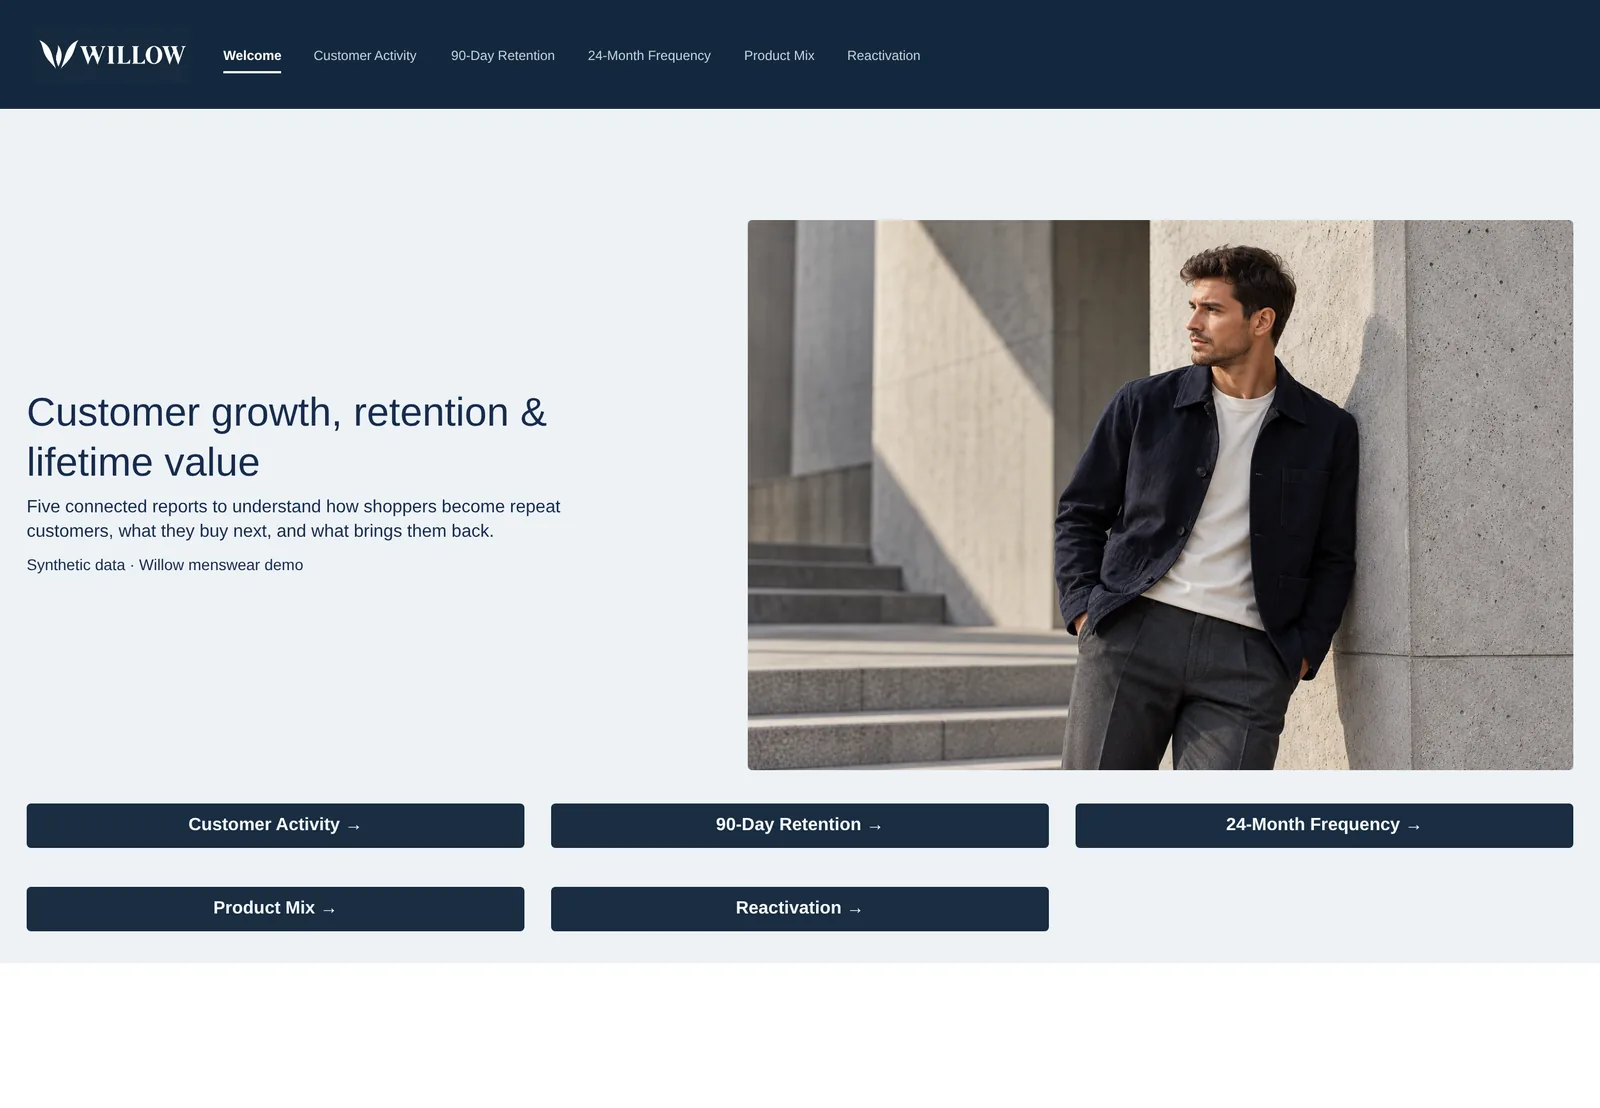
The five questions
| Report | Question it answers | Who is included |
|---|---|---|
| Customer Activity | Where are orders coming from: new, repeat, or returning buyers? | Everyone who ordered in the date range |
| 90-Day Retention | Do first-time buyers come back within 90 days? | Customers with a full 90 days of history |
| 24-Month Frequency | How often do customers buy over two years? | Customers with a full 24 months of history |
| Product Mix | What do customers buy first, next, and later? | A first-order cohort you choose |
| Reactivation | Who returns after a break, and what brings them back? | Customers who ordered again after lapsing |
The "who is included" column matters more than it looks. A customer who first bought last week can't have repeated within 90 days yet. Leaving them in drags the repeat rate down every month, and the newest cohort always looks like the worst one. The 90-day and 24-month reports only include customers who have had the full window to come back.
Customer Activity: where orders come from
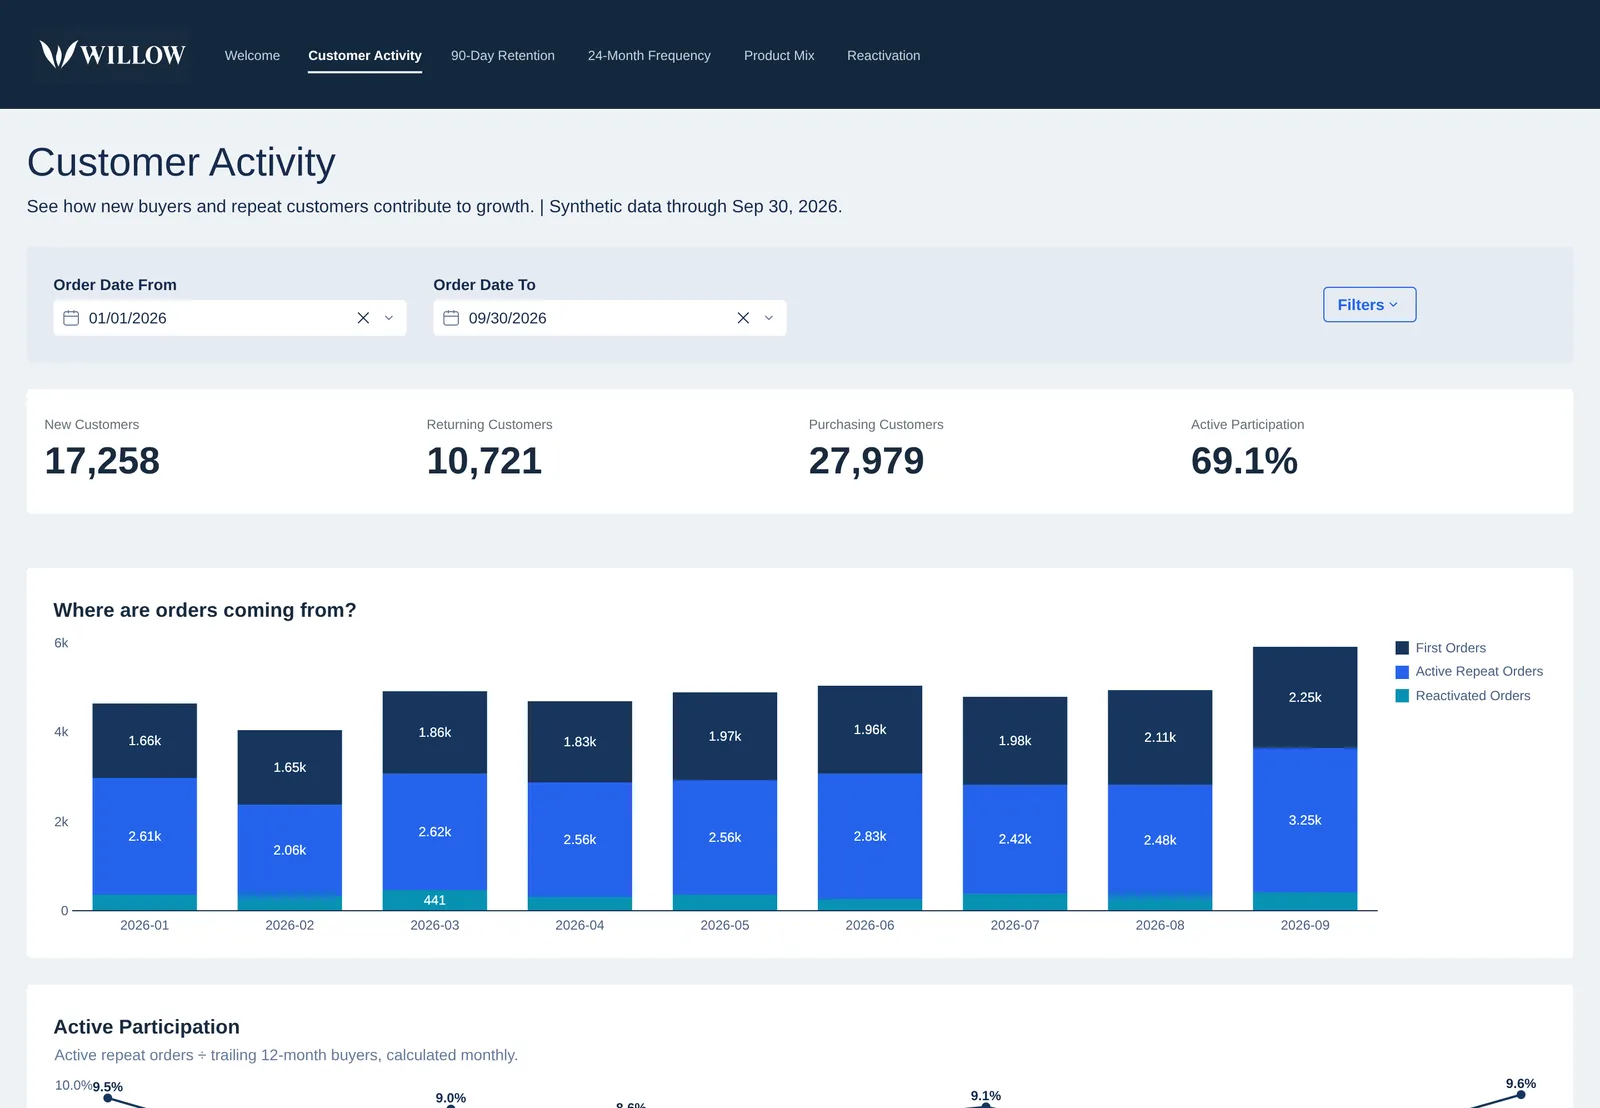
Every order is one of three types: a first order, a repeat order from a customer who is still active, or a reactivated order from a customer coming back after a break. Stacking them by month shows whether growth is coming from new buyers or from people who already know the brand.
The page also tracks active participation: active repeat orders divided by buyers in the trailing 12 months, calculated monthly. It's a steady read on whether more of your recent customer base is still ordering.
90-Day Retention: do first-time buyers come back?
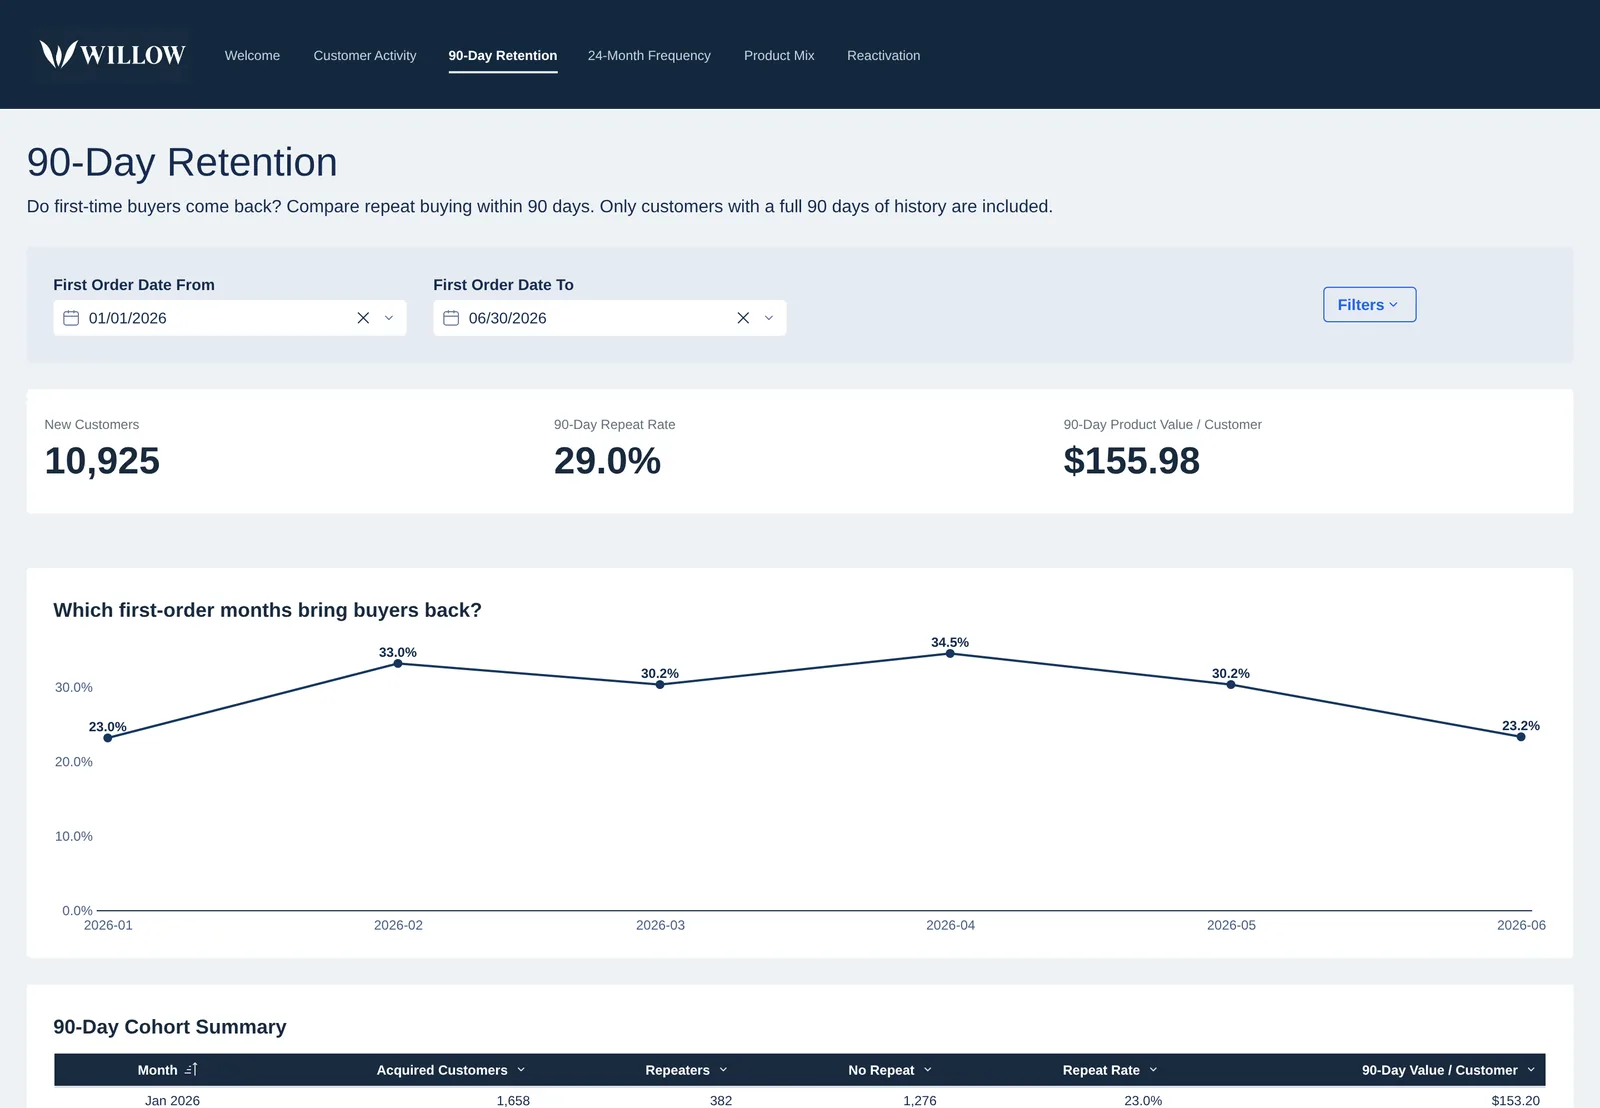
Customers are grouped by the month of their first order. For each group, the report shows how many bought again within 90 days, the repeat rate, and product value per customer over those 90 days. In the synthetic data, January to June 2026 brings in 10,925 new customers with a 29.0% 90-day repeat rate, ranging from 23.0% to 34.5% by month.
Two parts make this page more than a cohort chart:
- First product and repeat buying. It compares repeat rates by what customers bought first, which is often the quickest way to find an entry product worth promoting.
- An independent basket explorer. Pick one product and see what else shows up in the same baskets. The selector is deliberately separate: it doesn't filter the KPIs or cohort tables above it, so nobody reads a filtered number as the brand-wide one.
24-Month Frequency: one order or a habit?
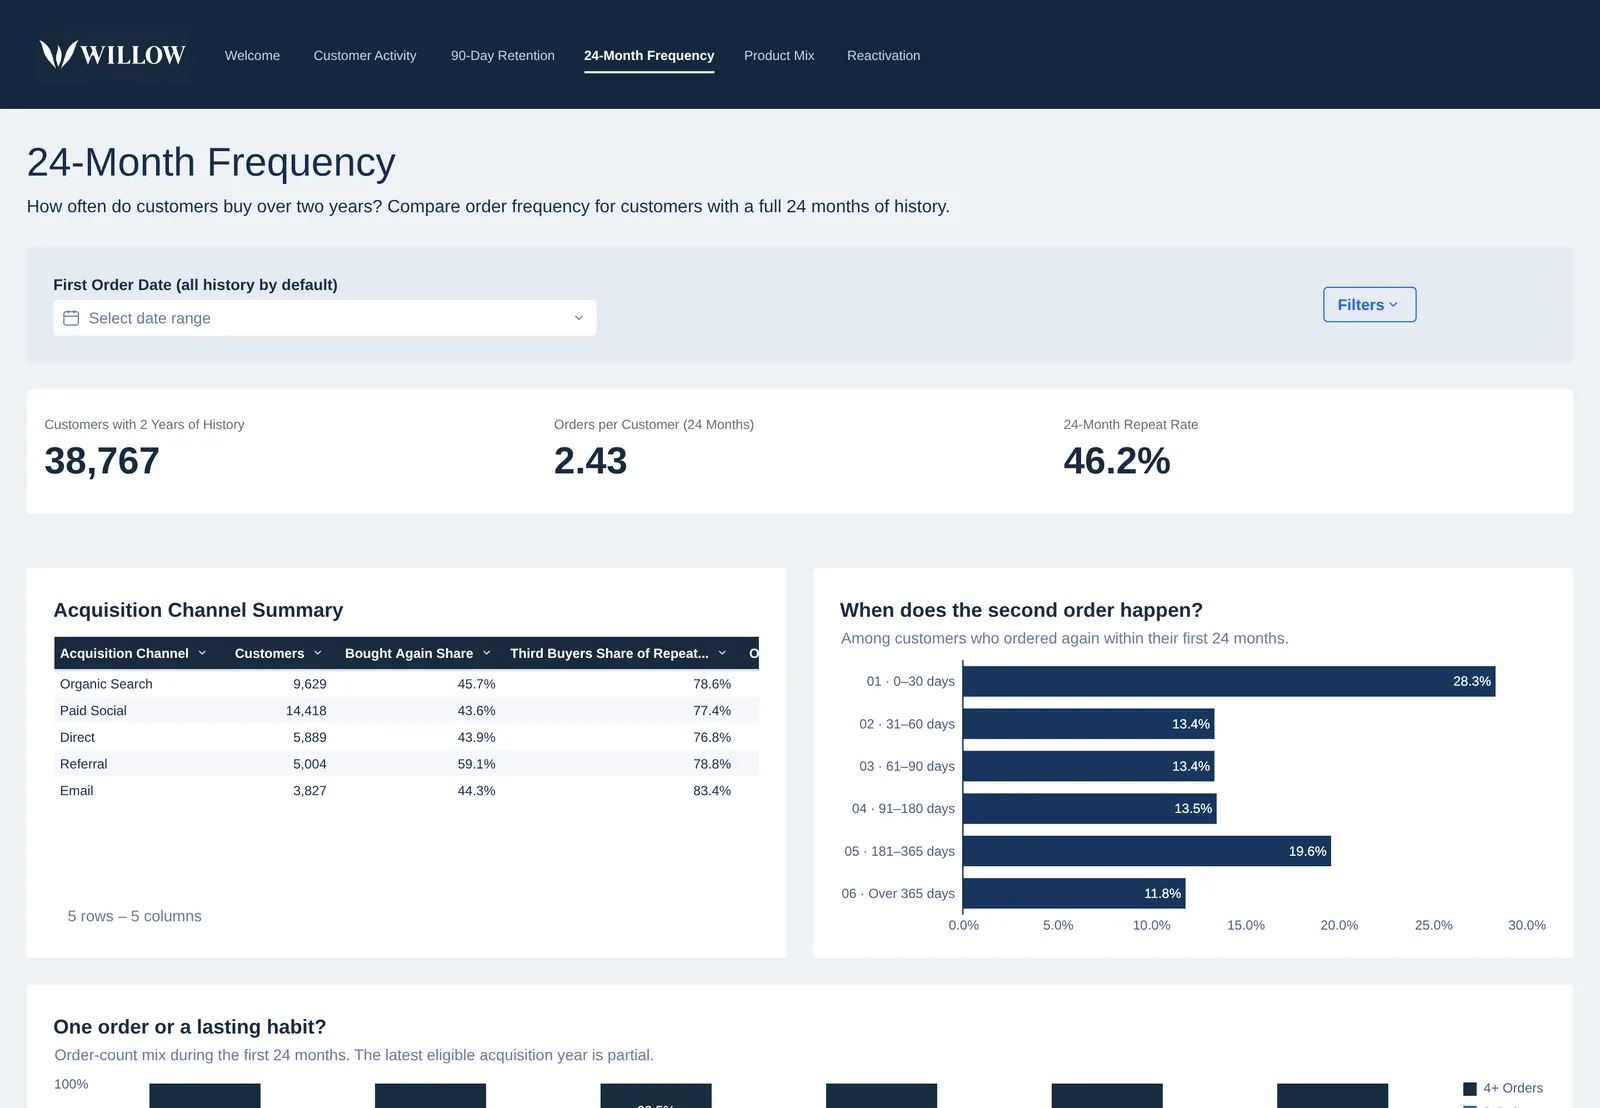
Ninety days tells you whether people come back. Two years tells you whether they keep coming back. This page shows orders per customer over 24 months, the 24-month repeat rate, and how customers split into 1, 2, 3, and 4+ orders.
It also breaks frequency down by acquisition channel and shows when the second order tends to happen. The latest acquisition year that qualifies is always partial, and the page says so rather than leaving people to compare it with full years.
Product Mix: what they buy next
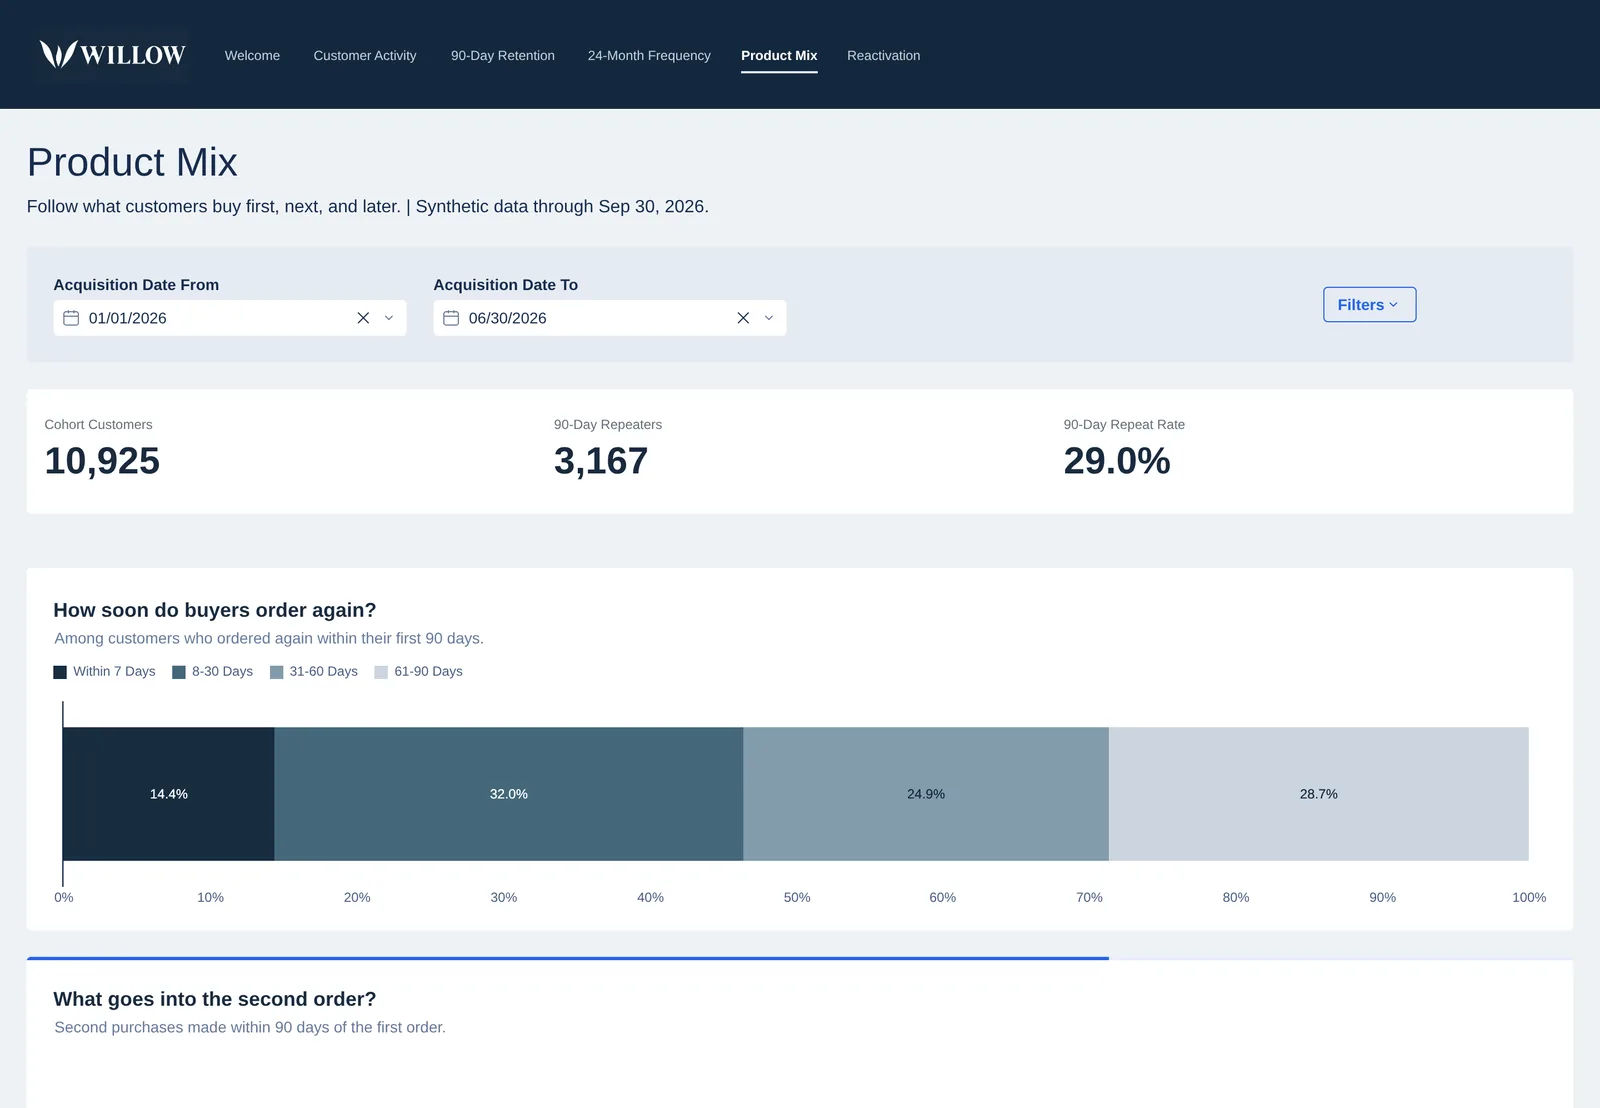
For a first-order cohort, this page shows how soon repeat buyers order again (within 7 days, 8 to 30, 31 to 60, or 61 to 90) and what goes into that second order. It then follows category and product choices across order stages. Shares can overlap because one order can include several categories, and the page notes that too.
For merchandising and email teams, this is the most practical page: it suggests what to recommend after a first purchase, and when to send it.
Reactivation: who comes back after a break
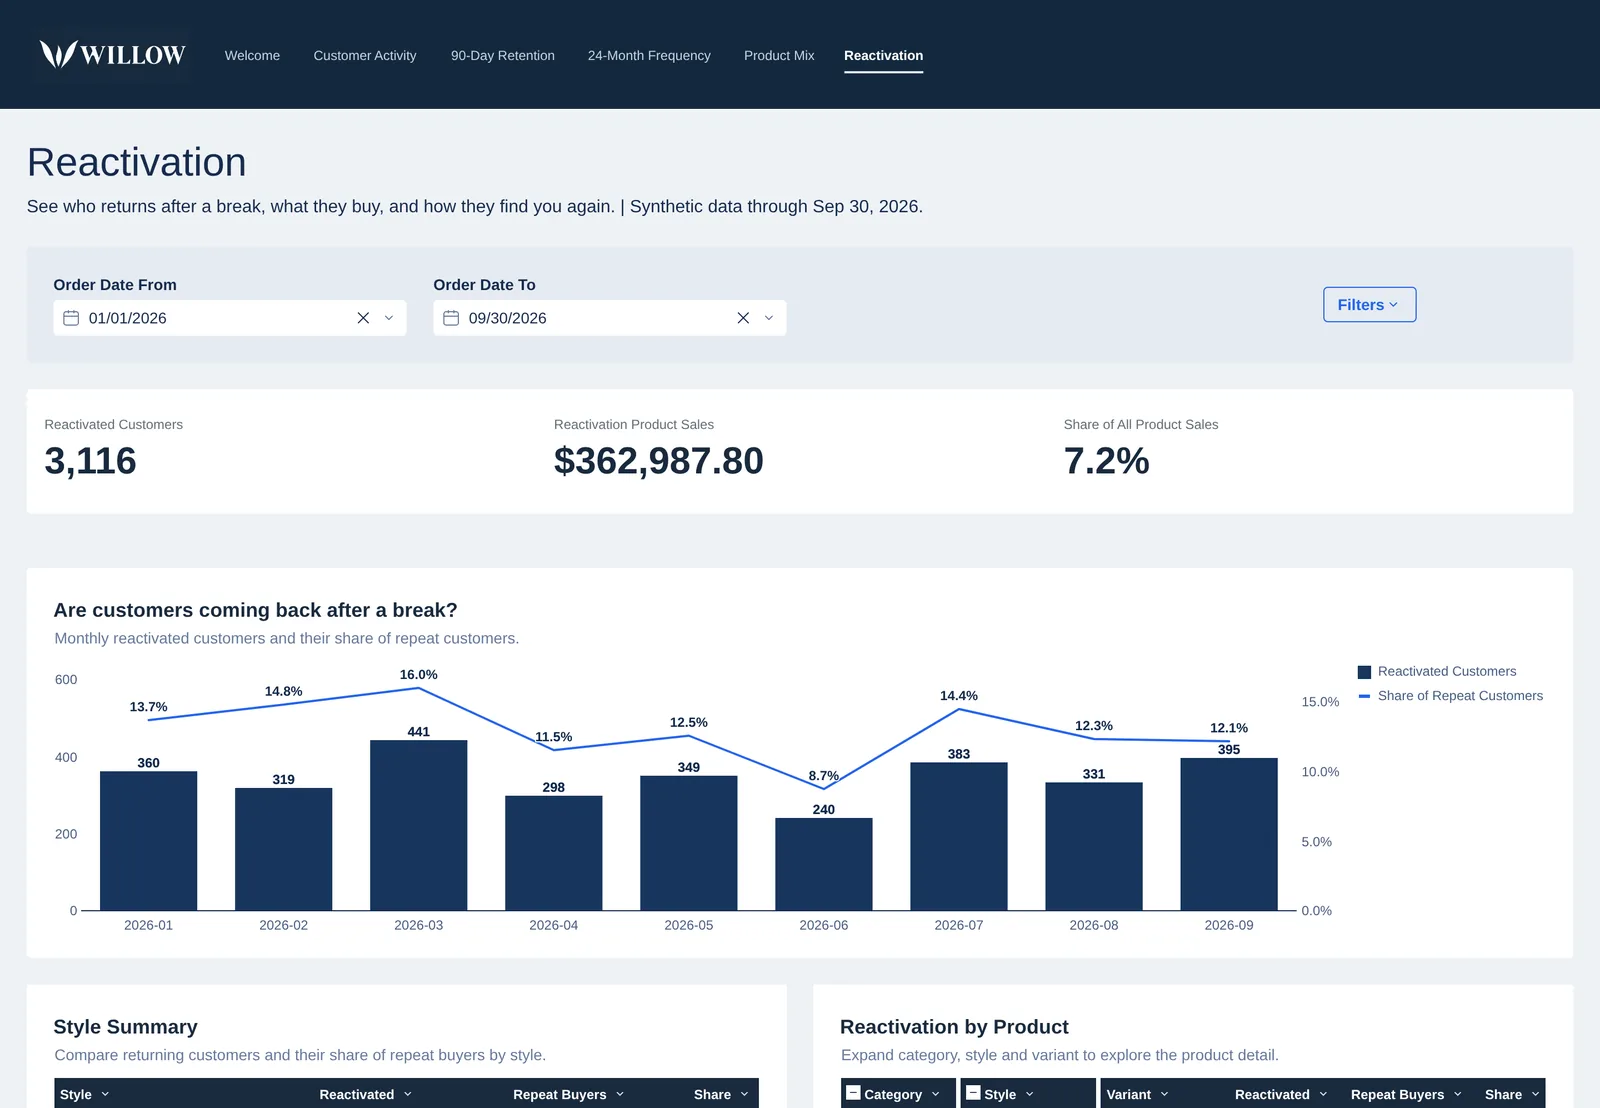
Reactivated customers are easy to lose inside "repeat customers". Here they get their own page: how many came back each month, what share of repeat customers they are, what they bought by style and product, and which channels brought them back. In the synthetic data, 3,116 reactivated customers account for 7.2% of product sales over nine months.
If that share is meaningful for your brand, a win-back program can be measured on its own instead of being folded into overall retention.
What to take from it for your own reporting
- Write down who each metric includes. "Repeat rate" changes meaning depending on whether customers had time to repeat.
- Keep one question per page. Five focused reports are easier to trust than one page with every chart.
- Say when a period is partial. A note on the chart prevents the most common wrong comparison.
- Keep exploratory controls separate from the headline numbers. The basket explorer shows how.
Retention numbers are only as good as the order and customer data underneath. If your repeat rate changes depending on who you ask, start with why Shopify, finance, and marketing report different revenue and avoiding double-counted orders across channels. For channel-level value, see contribution margin LTV by acquisition channel.
You can find this workbook and the other demos on the demos page.
Download the white paper
The same material is in a 13-page PDF you can share with your team: the five questions, the formula and "who is included" rule for each metric, a metric dictionary, the data you need, a common mistakes checklist, and how to put a dollar value on retention. Every number in it is synthetic Willow data.
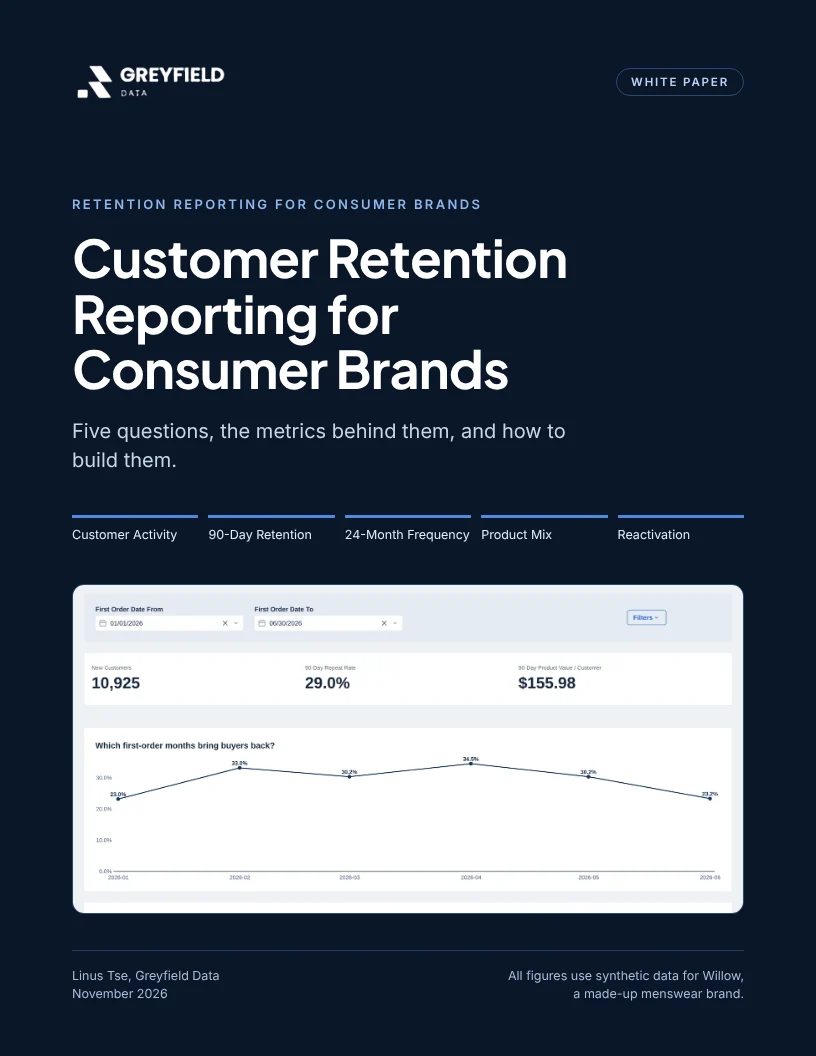
Customer Retention Reporting for Consumer Brands: five questions, the metrics behind them, and how to build them.
Part of the Sigma guides, a reading path through related articles.
Related
How to avoid double-counting Shopify, Amazon and TikTok orders
Separate the sales channel from the fulfillment provider, link mirrored orders, and reconcile revenue before combining Shopify, Amazon and TikTok Shop reports.
Map SKUs across Shopify, Amazon and TikTok without breaking margin
Build a product crosswalk with source IDs, dated mappings and explicit bundle quantities. Catch duplicate joins and missing costs before calculating product margin.
Shopify refund date vs order date: why monthly sales differ
A refund processed this month can belong to last month's order. Learn how event-date and order-cohort reporting differ and reconcile both without double counting.