Why do Shopify, finance, and marketing report different revenue numbers?
Each team counts a different thing on a different date. An ecommerce semantic layer names each revenue metric, its grain, time zone, and owner.

Greyfield Data
In this article 6 sections
Shopify, finance, and marketing report different revenue because they count different things on different dates. Shopify reports sales activity. Finance reports revenue under its accounting policy. Marketing reports revenue credited to its channels. Often, none of them is wrong.
A semantic layer doesn't force those numbers into one. It gives each number a name, a written definition, and an owner, so reports and AI tools use the same logic.
Here's how.
What is a semantic layer?
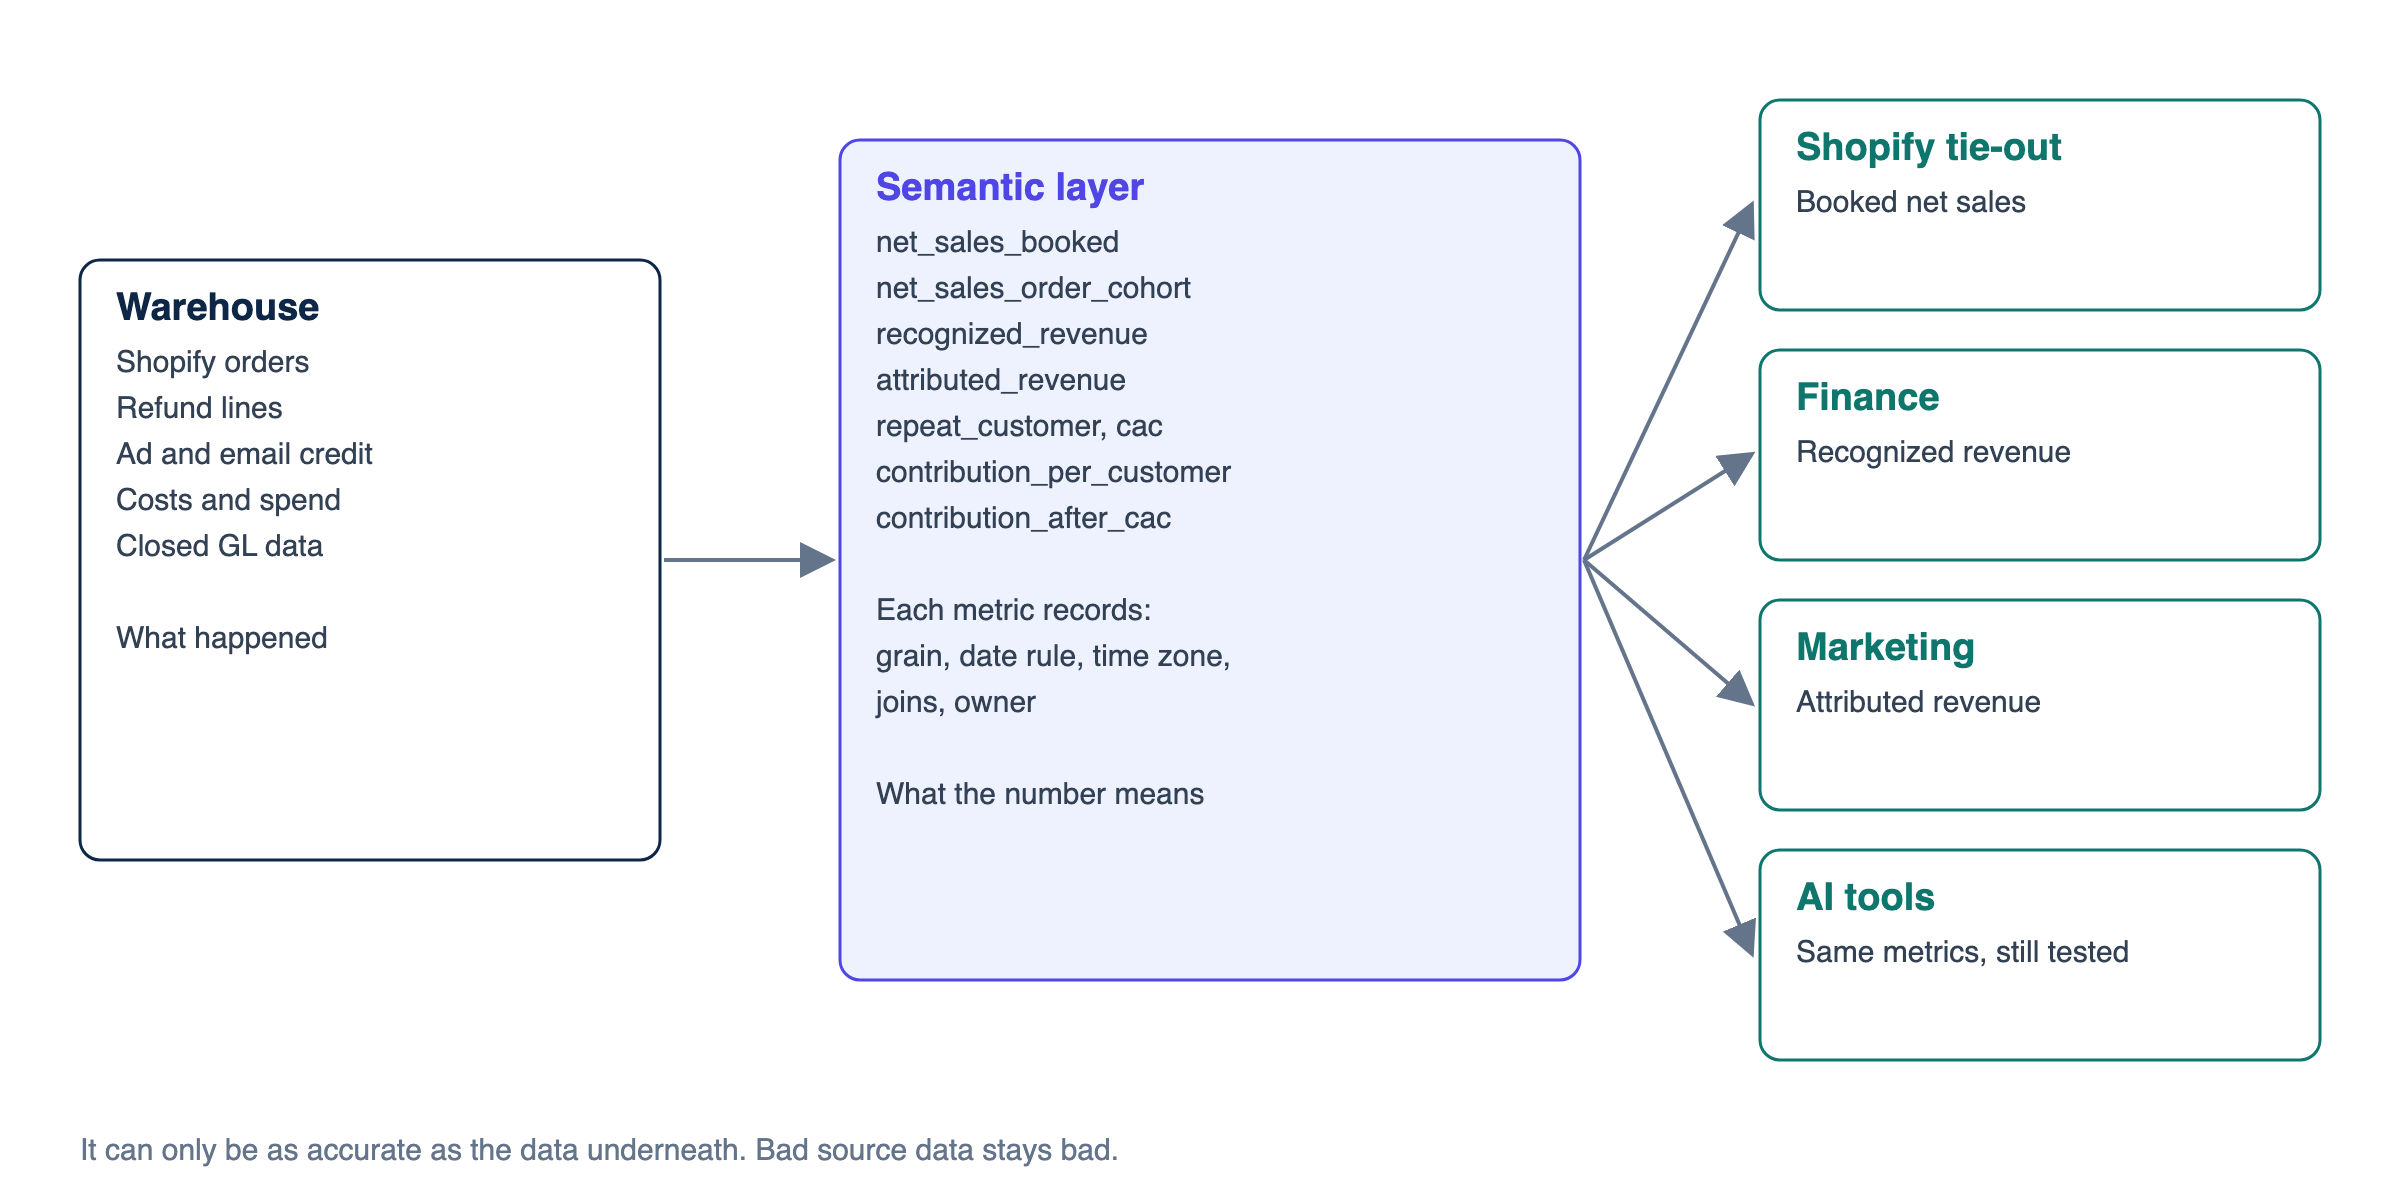
A semantic layer is a shared set of business definitions that sits between your warehouse tables and the tools people use. It holds metrics, dimensions, and the joins between tables.
Snowflake's semantic view docs use net revenue as an example of a concept you can define once, so it isn't recalculated differently in each report. The dbt Semantic Layer moves metric definitions out of BI tools and into the modeling layer. Sigma's data model metrics keep reusable formulas in the data source. Sigma limits these to one data source, so shared logic may need defining more than once.
| Layer | Its job | Question it answers |
|---|---|---|
| Warehouse | Stores and models the data | What happened? |
| Semantic layer | Defines metrics and joins | What does this number mean? |
| Dashboard | Shows results | How are we doing? |
It doesn't replace the warehouse, and it won't fix bad source data. If a cost is missing or a connector drops refunds, the semantic layer will calculate the wrong answer consistently.
A worked example: five answers for October
Here's a made-up store in New York with five orders. These are the amounts:
| Order | Placed (store time) | Shipped | Item sales | Shipping and tax | Item sales refund |
|---|---|---|---|---|---|
| A | Sep 28 | Sep 29 | $80 | $15 | $30 on Oct 3 |
| B | Sep 30 | Oct 1 | $60 | $11 | None |
| C | Oct 10 | Oct 11 | $100 | $18 | None |
| D | Oct 20 | Oct 21 | $200 | $16 | $50 on Nov 4 |
| E | Oct 31, 11:30 PM | Nov 2 | $120 | $20 | None |
Refunds here are merchandise only; real refunds can include shipping, tax, or fees.
Ask "What was October revenue?" and you can get five answers:
| Definition | Calculation | October |
|---|---|---|
| Booked net sales, store time | $420 of October sales, minus the $30 refund processed in October | $390 |
| Same calculation, UTC months | Order E moves to November, so $300 minus $30 | $270 |
| Net sales of October orders | $420 minus the $50 refund on Order D, as of Nov 30 | $370 |
| Shipped item sales, refunds on processing date | Orders B, C, and D, minus the $30 refund | $330 |
| Sum of platform reports | Ads credits C, D, and E. Email credits C. Uses order totals. | $592 |
This query aggregates refunds first so an order with two refunds doesn't count twice:
select sum(o.item_sales - coalesce(r.refunded, 0))
from orders o
left join (
  select order_id, sum(amount) as refunded
  from refunds
  where refunded_store_date <= '2026-11-30'
  group by order_id
) r on r.order_id = o.order_id
where o.placed_store_date
  between '2026-10-01' and '2026-10-31'
I ran each calculation in SQLite on these rows, and the results match. The shipped item sales row is a sample policy, not accounting advice. Your finance team's policy decides that number.
The first four answers can each be right for their own job. The $592 can't. It's attribution credit, not company revenue: it counts Order C twice, so it's never a valid deduplicated revenue number. The numbers differ for five reasons.
Refund timing. Shopify's sales reports show a sale on the day it was made and a reversal on the day it was processed. So Order A's refund lowers October even though the sale was in September. Order D's refund doesn't lower October, but it will lower October orders if you tie it back to the order. Shopify's discrepancy guide also notes that the Sales reports include returns, while the Payments finance report includes refunds.
Time zones. Order E was placed on Oct 31 in New York, which is Nov 1 in UTC. Shopify exposes the store's zone as ianaTimezone. Don't assume every report uses it. Shopify warns that Finance reports and payout exports may use different date ranges or time zones than its Payments activity report.
What counts as revenue. Shopify defines net sales as gross sales minus discounts and sales reversals. Total sales adds shipping, taxes, duties, and fees. Those are different metrics, even when people call both of them revenue.
Credit. Platforms report the orders they claim. Order C appears twice in the last row because two platforms credit it. That's why adding up platform reports can overshoot real sales.
Recognition. The shipped row moves revenue to the date goods left, a sample of the kind of policy finance may use. That's Order B in and Order E out.
Define the shared metrics
Don't start with a tool. Start with a table your team agrees on. Each metric needs a grain, a date rule, a time zone, and an owner. Here's a starting point. Change it to fit your business.
| Metric | Definition | Grain | Date rule | Owner |
|---|---|---|---|---|
net_sales_booked |
Item sales minus discounts and refunds | Order line and refund line | Sale date and refund date | Finance and data |
net_sales_order_cohort |
Same, with refunds tied to the order | Order line | Order date, restated | Data |
recognized_revenue |
Taken from the accounting close | GL line | Finance policy | Finance |
attributed_revenue |
Credit under a named model | Order and platform | Conversion date | Marketing |
repeat_customer |
Two or more qualifying orders | Customer | Second order date | Growth |
contribution_per_customer |
Cumulative contribution per customer at a stated age, before CAC | Customer cohort | Months since first order | Finance and growth |
cac |
Spend divided by new customers | Channel and month | Spend month | Marketing and finance |
contribution_after_cac |
contribution_per_customer minus cac |
Customer cohort and channel | Months since first order | Finance and growth |
Use one reporting time zone for shared metrics, usually the store's. Store UTC timestamps too, and convert with a named rule. With several stores, decide whether each one reports in local time or a single company time zone.
Write down the edge cases. Does a fully refunded order count toward a repeat customer? Does a subscription renewal count as an order? Do test orders and staff orders get excluded? Are gift cards revenue when sold or when redeemed? If this isn't decided in advance, someone decides it inside a dashboard.
Grain matters too. Refunds, line items, and discounts sit at different levels. Join them carelessly and one order can fan out into several rows, which inflates revenue. Declare the joins in one place, and test the totals.
How to set one up
- Pick the five or so numbers leadership argues about.
- Tie each one to a source total, such as a Shopify report or the closed month.
- Write the definition table and get an owner to sign off.
- Build the metrics in the tool you already use, whether that's Snowflake semantic views, dbt, or your BI tool's model.
- Point one dashboard at them and retire the duplicate calculations.
- Show the metric name and definition next to the number.
Check totals every month. A definition can be right while a source breaks.
What about AI querying?
AI tools need the same definitions, or they'll guess. Snowflake says Cortex Analyst uses semantic views to understand data and generate SQL. It's also limited to questions that SQL can answer.
A semantic layer can reduce guessing. It doesn't guarantee a correct answer. If someone asks for "revenue" and you have four metrics, the tool still has to pick one, so say in your descriptions which metric to use by default and when to ask.
Test it with real questions. Snowflake's modeling guidance suggests a set of about ten, starting small, and treating clear descriptions as a top priority for accuracy. For this store, try "What was October revenue?" and check which of the five answers comes back. Keep access rules in place too, since a helpful answer shouldn't expose margin data to the wrong team. If you're connecting an assistant directly, start with a narrow role.
I built this example with sample data and checked the arithmetic locally. It wasn't run in a Snowflake semantic view, and your definitions will differ. If you've handled refund restatement in a cleaner way, I'd like to hear it. If your teams are arguing over which number is right, the ecommerce data warehouse page shows how I'd start.
Check the underlying records
For the date-model details, see Shopify refund date versus order date. For cross-platform duplication, see one purchase across Shopify, Amazon and TikTok records. These are separate checks: a consistent revenue definition can still produce the wrong total if an operational copy is counted as another sale.
Related
How do you combine Shopify, Klaviyo, and Recharge data into one customer view?
Join Shopify, Klaviyo, and Recharge on the right keys, count each renewal once, and keep skips as events so one customer timeline holds up.
EcommerceBronze, silver, and gold data layers explained with an ecommerce order
Bronze keeps the data as it arrived, silver cleans and matches it, and gold shapes it for business use. Follow one order, a duplicate, and a late refund.
Ecommerce9 ecommerce data sources worth connecting to a warehouse
Nine source types to consider for an ecommerce warehouse, with the question each answers, its useful key, a caveat, and when it's worth connecting.