Shopify refund date vs order date: why monthly sales differ
A refund processed this month can belong to last month's order. Learn how event-date and order-cohort reporting differ and reconcile both without double counting.

Greyfield Data
In this article 5 sections
A refund processed in February can reduce February's activity while changing the eventual value of an order placed in January. Both views can be useful. They answer different questions, and they shouldn't share an unlabeled date filter.
For Shopify reconciliation, start with the current sales report definitions. Shopify distinguishes sales reversals from physical returns. Sales are recorded on the sale date and reversals on the date processed. Its sales reports are not a record of cash moving between you and the customer.
That distinction explains why filtering an order export to January isn't enough to reproduce every January sales-report measure.
One order, two valid timelines
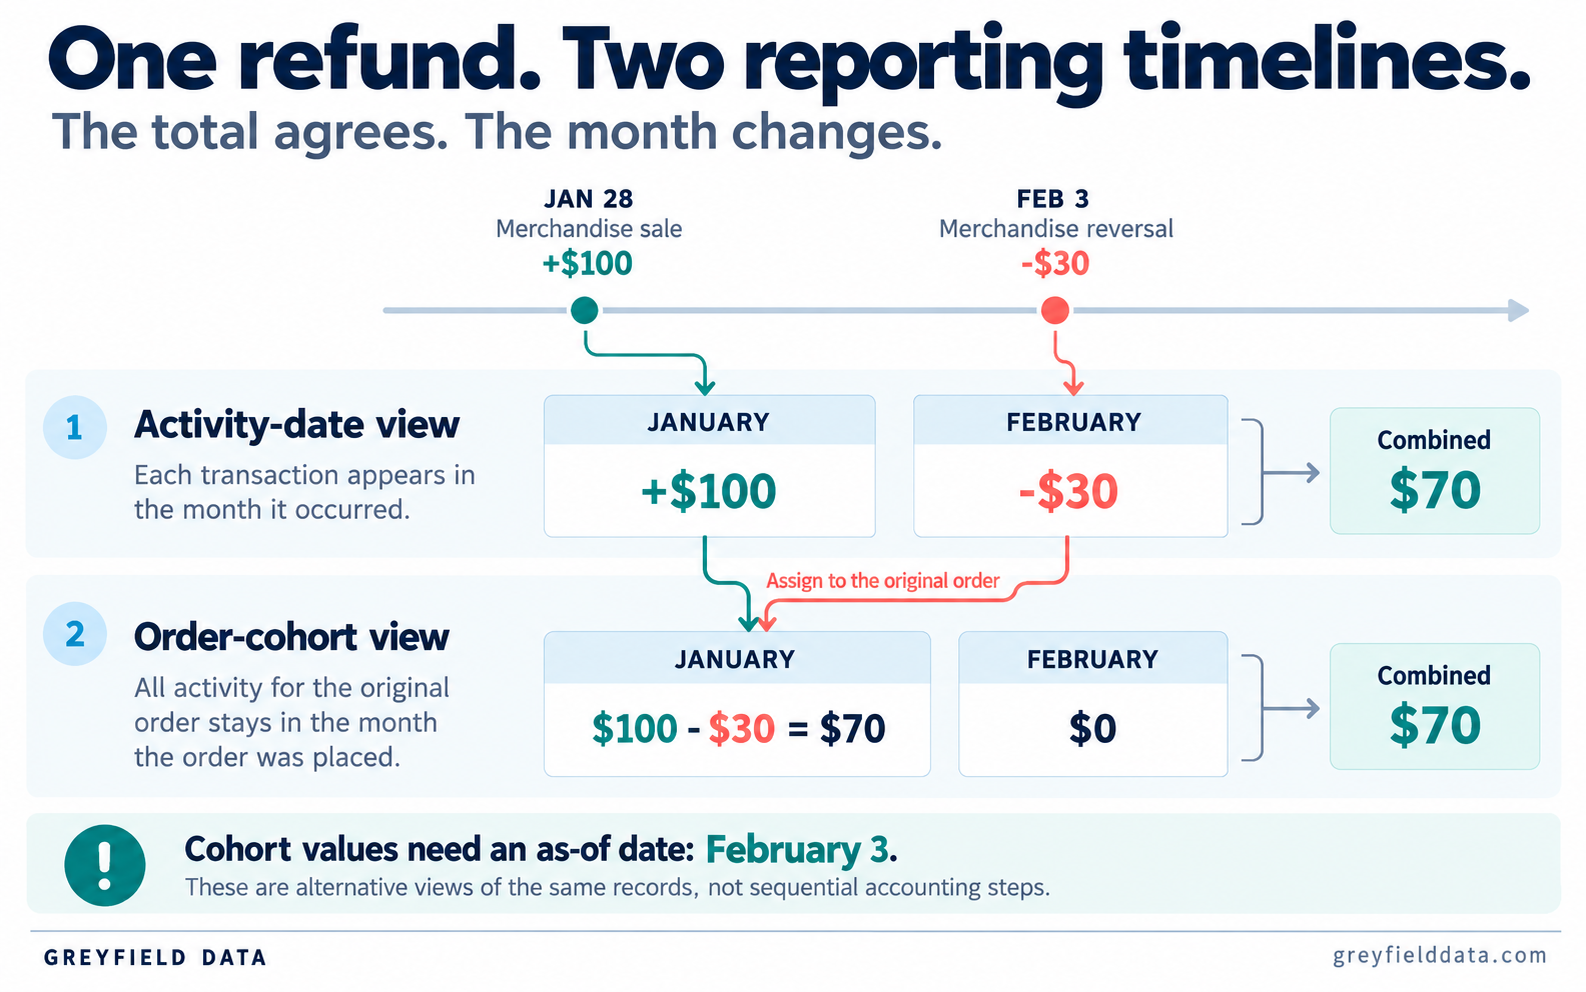
Consider an illustrative order with $100 of merchandise sales after discounts on January 28. On February 3, the merchant processes a $30 merchandise refund that creates a matching sales reversal. There are no taxes, shipping charges or other adjustments in this example.
| Reporting view | January | February | Combined |
|---|---|---|---|
| Sales activity by event date | $100 | -$30 | $70 |
| January order cohort, as of February 3 | $70 | $0 | $70 |
The first view asks what sales activity happened in each month. The second asks what the January order is worth after the later adjustment. They agree across the full example but put the reduction in different places.
The cohort's $70 is an as-of value. It could change again if another adjustment arrives. It wasn't information available on January 28.
Keep the dates instead of choosing one
Preserve order timestamp, sales or adjustment event timestamp, refund processing timestamp, physical return timestamps where available, and warehouse load timestamp. Keep their time zones too.
An order date supports cohort analysis. An adjustment date supports activity reporting. A load date helps diagnose freshness. Replacing all three with one generic date makes the report easier to build and harder to explain.
For a monthly activity table, a practical design is one row per eligible sales or reversal event, with its amount and event date. Retain the parent order ID so you can also group the same events back to their originating orders. Define which adjustments belong in each measure before summing them.
Don't stamp every event with the parent order date just because that date is available on the joined order table. That choice restates the order cohort rather than reproducing period activity.
A return isn't automatically a refund
A physical item can come back before money is refunded. A customer can receive a refund without sending an item back. An exchange can involve new items and several monetary adjustments.
Keep inventory movement, merchandise reversal, shipping adjustment and payment movement distinguishable. If your merchandise sales measure excludes shipping, subtracting a shipping refund from that measure understates it. If two integrations describe the same shipping refund, adding both understates it again.
Shopify's terminology now uses sales reversals for negative order adjustments; the older monetary Returns term is deprecated. Don't assume an old column called returns is a count of physically returned units. Inspect the source definition before relabeling it in a dashboard.
Reconcile one month with an adjustment bridge
Start with the source report, its exact measure, its date range and its filters. Record the store's reporting time zone. Then build a small bridge from source events to the warehouse result.
- Sum eligible positive merchandise sales in the period after the chosen discount treatment.
- Subtract eligible merchandise reversals processed in that period, including reversals for older orders.
- Keep shipping, tax and other components in their own reconciliation columns.
- Check duplicates at event level, including events received through more than one integration.
- List missing or late events separately and rerun the same bridge after the next successful load.
Use the source event identifier when available. Don't deduplicate solely by order ID, since one order can legitimately have several partial refunds. Don't deduplicate solely by amount either, since two equal partial refunds can both be real.
If the numbers still differ, compare the population of orders and adjustments, not just the formula. A custom paid-order dashboard and a platform sales report may include different statuses. Shopify's sales discrepancy guide is a useful starting point for that comparison.
Name both measures in the dashboard
Use labels such as “Net merchandise sales by activity date” and “Order-cohort net merchandise value, as of refresh.” Put the date basis and included components in the metric description.
In Sigma, reusable metrics let you define aggregate calculations for shared sources. Define the activity and cohort measures deliberately; reusing a formula won't correct the wrong date relationship underneath it.
For the morning scorecard, show period activity and data freshness. For customer value or acquisition analysis, use the appropriate order cohort and an explicit observation window. Our daily KPI guide and revenue definitions article cover those broader choices.
The useful question isn't which month is universally correct. It's whether the report's date, population and adjustment rules match the decision someone is making. Write those rules beside the metric before trying to make two totals agree.
Related
How to avoid double-counting Shopify, Amazon and TikTok orders
Separate the sales channel from the fulfillment provider, link mirrored orders, and reconcile revenue before combining Shopify, Amazon and TikTok Shop reports.
GuideMap SKUs across Shopify, Amazon and TikTok without breaking margin
Build a product crosswalk with source IDs, dated mappings and explicit bundle quantities. Catch duplicate joins and missing costs before calculating product margin.
GuideWhy Amazon profit changes after a sale: estimated vs actual fees
Amazon fee events can arrive after the order. Build a margin report that replaces estimates by fee component, exposes missing costs, and explains later changes.