Daily ecommerce KPIs by channel: what belongs in the morning scorecard?
A daily ecommerce scorecard needs net sales, orders, new customers, ad spend, refunds, and data freshness by channel, each with a written denominator and cutoff.

Greyfield Data
In this article 9 sections
A morning ecommerce scorecard should show net sales, orders, net sales per order, new customers, ad spend, CAC, sales per ad dollar, processed refund rate, and how fresh the data is. Show one row per measure, split by sales channel, for yesterday, week to date, and month to date.
The list is the easy part. The hard part is making each number comparable. Here's what to define, and what to do when a number moves.
A sample scorecard
This is a made-up store, read on a Thursday morning. The 6 AM ET refresh reports through Wednesday midnight ET. This sample shows week-to-date totals only. The week-to-date columns cover Monday through Wednesday, and each one is compared with the same three days last week.
| Measure | DTC, Wed | Marketplace, Wed | Wholesale, Wed | Total, Wed | Total, Mon to Wed | Same days last week |
|---|---|---|---|---|---|---|
| Net sales | $8,400 | $3,000 | $2,000 | $13,400 | $40,530 | $40,770 |
| Orders | 120 | 75 | 2 | 197 | 597 | 618 |
| Net sales per order | $70.00 | $40.00 | $1,000.00 | $68.02 | $67.89 | $65.97 |
| New customers | 48 | 30 new to brand | Not measured | Not combined | Not combined | Not combined |
| Orders with a customer ID | 96% (115 of 120) | Not measured | 100% (2 of 2) | Not combined | Not combined | Not combined |
| Ad spend | $2,100 | $600 | n/a | $2,700 | $8,100 | $7,600 |
| CAC | $43.75 | $20.00 | n/a | Not combined | Not combined | Not combined |
| Sales per ad dollar | $4.00 | $5.00 | n/a | $4.22 | $4.28 | $4.60 |
| Processed refund rate | 4.5% | 4.8% | 0.0% | 3.9% | 4.2% | 4.1% |
Add a month-to-date column the same way, and compare it with the same number of days last month.
n/a means the measure doesn't apply, because wholesale runs no ads here. Not measured means it may exist, but this sample doesn't have it. The Total column's sales per ad dollar covers DTC and marketplace only. Every value came from one tested sample file, and the image below shows the same numbers for a quick read.
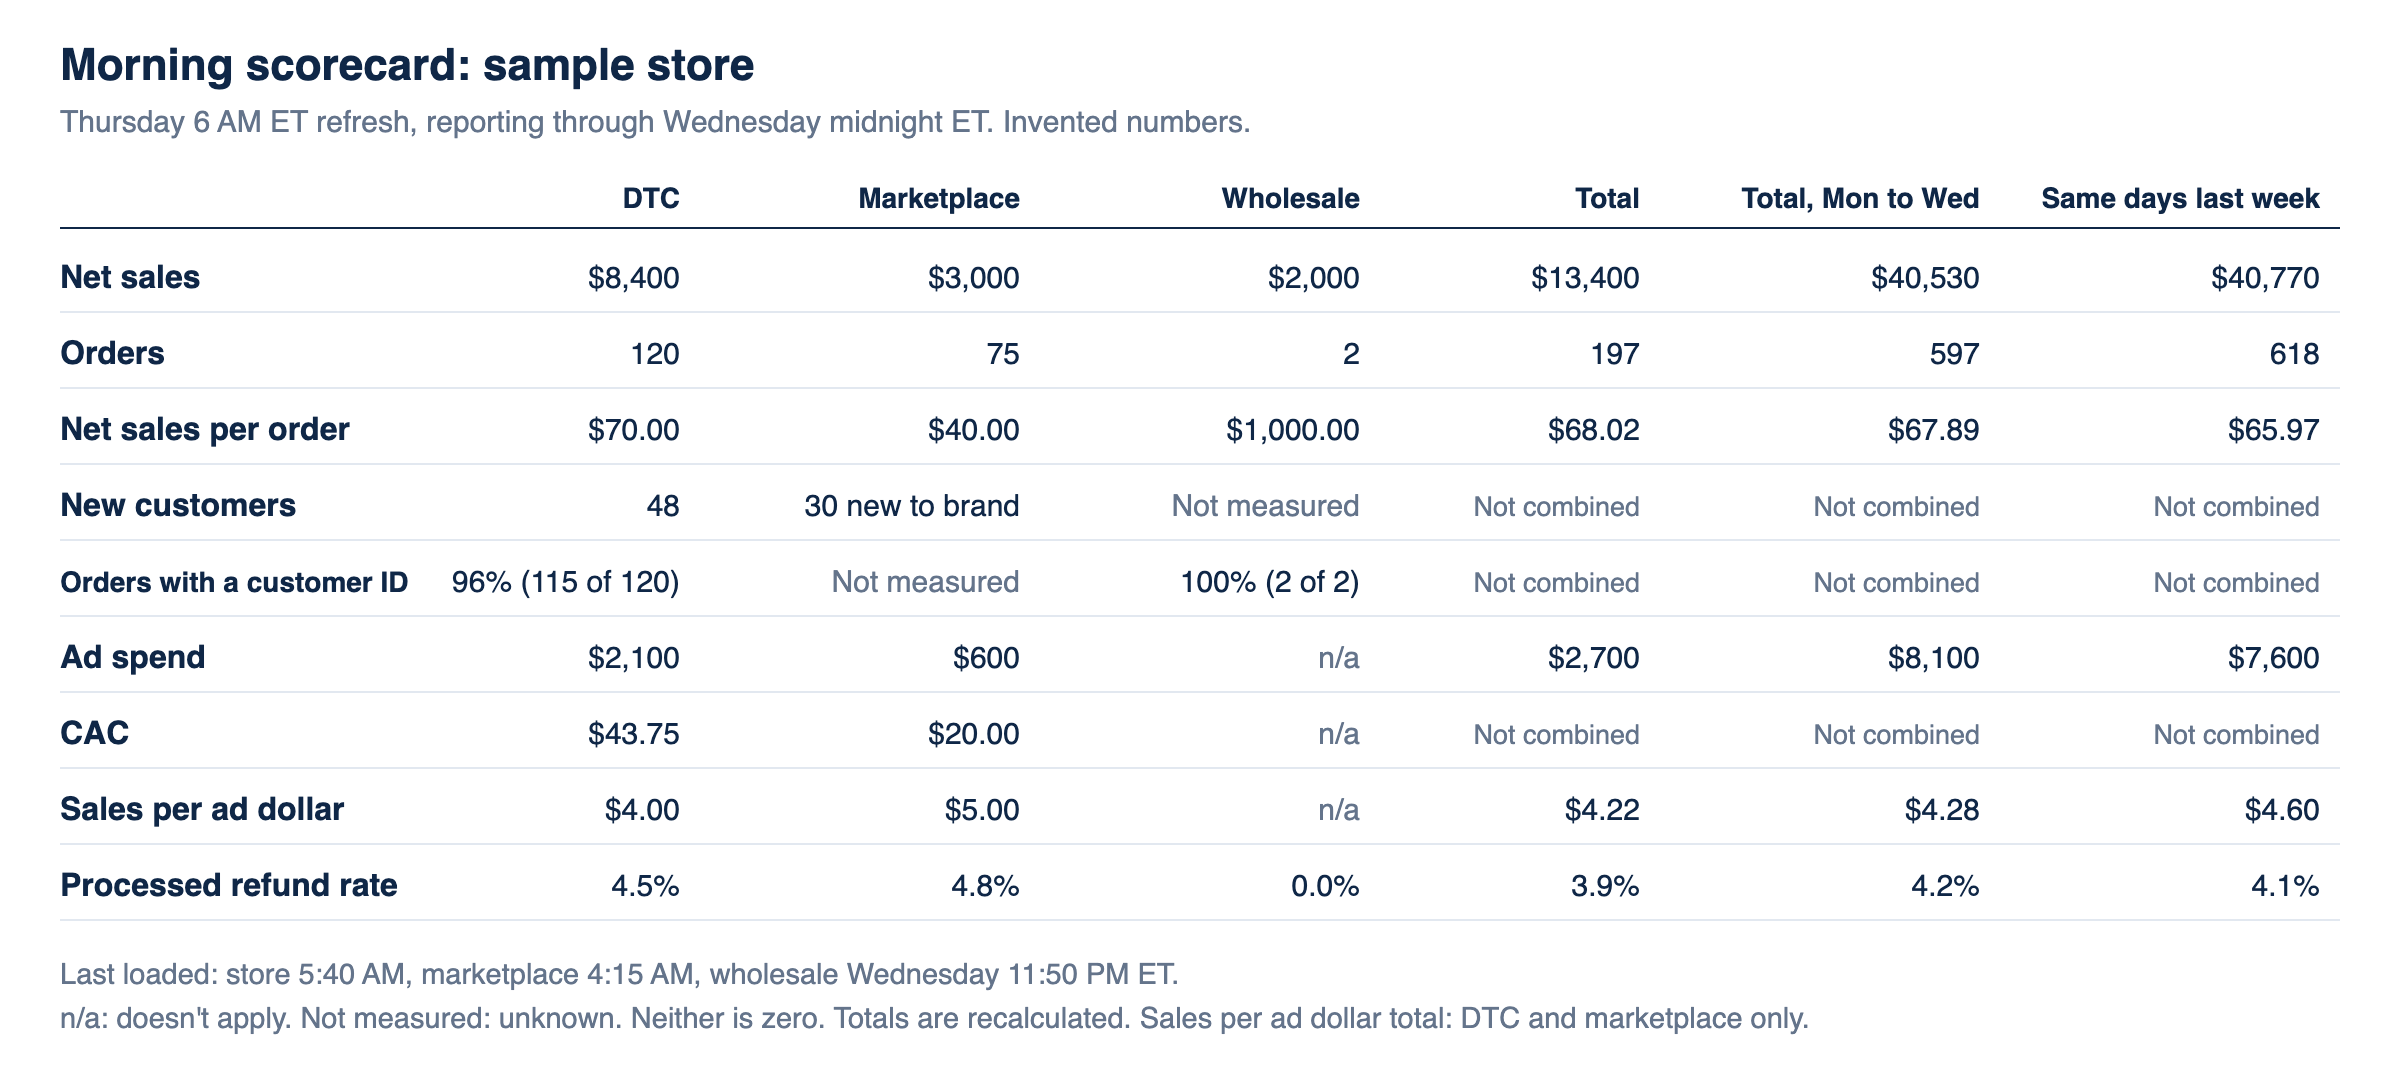
Last loaded: store 5:40 AM, marketplace 4:15 AM, wholesale Wednesday 11:50 PM ET.
Write down these definitions
Sales channel versus acquisition channel. DTC, marketplace, and wholesale say where the sale happened. Search, social, and email say how someone may have arrived. Keep them on separate axes. An ad can send someone to a marketplace, and a table with one "channel" column can't show that. In this sample, DTC ad spend is spend that sends people to the store, and marketplace ad spend is the marketplace's own retail media. Spend that could drive both needs its own stated rule.
Net sales. Pick one definition and keep it. In this sample, it's item sales after discounts, minus merchandise refunds processed that day. Shipping and tax refunds aren't subtracted, because they were never in item sales. Shopify's own net sales subtracts discounts and sales reversals. Refund timing is one reason teams report different revenue.
Net sales per order. This isn't Shopify's average order value. Shopify defines AOV as gross sales minus discounts, divided by orders, excluding post-order adjustments. This scorecard's measure includes refunds. It's a daily flow measure, for the same reason as processed refund rate: a refund processed Wednesday can belong to an older order. Give yours a name that says which one it is.
Cutoff and time zone. Say when the day ends, and in which time zone. A morning report with one store's day ending at midnight Eastern and another source reporting in UTC isn't comparing the same day.
Currency. Convert with a stated rule, or keep currencies apart.
Data freshness. Show the last loaded time for each source. If one source is behind, the number should say so.
Recalculate totals. Don't average ratios.
Total ratios come from total numerators and denominators.
In the sample, the three channels show net sales per order of $70, $40, and $1,000. Averaging them gives $370. The correct total is $13,400 divided by 197 orders, which is $68.02.
Sales per ad dollar works the same way, and it also needs a stated scope. This sample's scope is DTC plus marketplace: $11,400 on $2,700, which is $4.22. Averaging $4 and $5 gives $4.50, which is wrong for any scope.
Company-wide sales per ad dollar is a different measure, not a mistake. With wholesale included, it's $13,400 on $2,700, or $4.96. Some teams call that a marketing efficiency ratio. Pick your scope in advance, label it, and keep it fixed. Don't drop a channel because it spent nothing that day, or choose a scope because of how the revenue looks.
Processed refund rate here is merchandise refunds processed, divided by item sales after discounts for the same period. That's $550 on $13,950, or 3.9%. This is a flow measure. A refund processed Wednesday can belong to an older order, so it isn't the refund rate of Wednesday's orders. Use a matured cohort for that.
Keep unknown apart from zero
Zero means you measured it and got nothing. n/a means the measure doesn't apply. Not measured means you don't know. Those are three different cells.
That matters in formulas. Treat a blank as zero and CAC can look free. CAC is $0 only when spend is a known $0 and new customers is a known number above zero. If spend or new customers is unknown, CAC is unknown. If new customers is zero, CAC is undefined.
Show one more line beside new customers: identity coverage. If some orders have no customer ID, your new-customer count is an estimate. Report the share of orders you could match.
New customers don't mean the same thing everywhere
That's why the sample doesn't add them up.
On Shopify, new customers are those placing a first order with your store. On Amazon, new-to-brand checks whether a shopper bought from the brand on Amazon during the previous 12 months. So someone who bought on your site last month can be new to brand on Amazon, and someone who bought on Amazon two years ago can count again.
Marketplaces also limit what buyer data you can see. Amazon restricts buyer PII to applications with the appropriate roles. Don't claim a single cross-channel customer count unless you've proved the match, and show the two counts side by side.
The same goes for CAC. DTC at $43.75 and marketplace at $20 use different definitions of new, so they're signals to watch over time, not a fair contest.
Sales per ad dollar isn't causal ROAS
The measure is sales divided by spend. It includes people who would've bought anyway. It's fine for spotting change, but it can't tell you what the ads caused. For that, read blended, attributed, incremental, and marginal CAC.
What to do when a number moves
Compare like with like. Wednesday goes against last Wednesday, and Monday through Wednesday goes against the same days last week. Marketplace made $9,450 Monday through Wednesday. Against all of last week, $25,620, that looks down 63%. Against the same three days, $10,620, it's down 11%.
In the sample, marketplace net sales were $3,000 against $3,740 last Wednesday, down 20%. Work through it in order:
- Is the data complete? Check the load time first. A late file can look like a bad day.
- Is it orders or order size? Orders fell from 92 to 75, while net sales per order barely moved, from $40.65 to $40.00. So the drop is mostly explained arithmetically by fewer orders. Similar order size doesn't rule out price and mix changes that offset each other, so check those too.
- Did spend change? It stayed at $600, and sales per ad dollar fell from $6.23 to $5.00.
- Who checks what? The marketplace owner looks at stock, listing status, and traffic.
The scorecard doesn't tell you why. It tells you where to look, and who should look. Write down what you found, so the next person doesn't start over.
Keep it short
If nobody would act on a row, take it off. Rate-based rows such as conversion rate depend on how sessions are counted, so add them only if you can compare them over time.
The sample shows the structure, and your cutoffs and definitions will be your own. If you're trying to get a scorecard like this running from several sources, the ecommerce data warehouse page covers where to begin.
Trace the reporting exceptions
Before combining channel totals, check whether Shopify, Amazon and TikTok records describe the same purchase. Keep the sales channel separate from the fulfillment provider. For refund-heavy periods, compare activity date with order-cohort date before interpreting the movement.
Once those rules reconcile, Sigma metrics can provide reusable aggregate calculations for shared sources. Put the date basis, included components and coverage in the metric description.
Related
How to avoid double-counting Shopify, Amazon and TikTok orders
Separate the sales channel from the fulfillment provider, link mirrored orders, and reconcile revenue before combining Shopify, Amazon and TikTok Shop reports.
GuideMap SKUs across Shopify, Amazon and TikTok without breaking margin
Build a product crosswalk with source IDs, dated mappings and explicit bundle quantities. Catch duplicate joins and missing costs before calculating product margin.
GuideShopify refund date vs order date: why monthly sales differ
A refund processed this month can belong to last month's order. Learn how event-date and order-cohort reporting differ and reconcile both without double counting.