Blended, attributed, incremental, and marginal CAC: which one guides the next dollar?
Blended CAC describes the whole business, attributed CAC assigns credit, incremental CAC estimates cause, and marginal CAC asks what the next dollar buys.

Greyfield Data
In this article 8 sections
Marginal CAC is the one built for the next dollar, because it compares extra spend with extra customers. You can estimate it from controlled spend changes or a response model. In this sample, the measure is marginal CAC estimated over the next $10,000. True marginal CAC is the local slope of the response curve, so a $10,000 step is an approximation. The other three are averages. You can report or forecast those too, but an average can't tell you what the next dollar buys.
Blended CAC is total spend divided by all new customers. Attributed CAC is spend divided by the customers a model credits to a channel. Incremental CAC is spend divided by the customers that channel actually caused. Marginal CAC is the extra spend divided by the extra customers it brings.
They can point in opposite directions. Here's a worked example.
The sample month
A made-up store spends $60,000 across three channels and gets 1,500 new customers. Every number below is illustrative. The lift and response figures are assumptions, and no test was run.
| Channel | Spend | Credited by the platform | Credited after dedup model |
|---|---|---|---|
| Search | $20,000 | 700 | 600 |
| Social | $30,000 | 900 | 800 |
| Video | $10,000 | 100 | 100 |
| Total | $60,000 | 1,700 | 1,500 |
Blended CAC
$60,000 divided by 1,500 customers is $40.
This is a good health check, and it doesn't need a model. But it can't tell you which channel to change. It also rises and falls with customers who'd have come anyway.
Attributed CAC
Attribution assigns credit. The platforms here claim 1,700 customers, which is more than the store got. Their credit overlaps, so never add it up.
The dedup column allocates each customer once. That gives $33.33 for search, $37.50 for social, and $100 for video.
| Channel | Dedup credit CAC |
|---|---|
| Search | $33.33 |
| Social | $37.50 |
| Video | $100.00 |
On this view, video looks like the one to cut. But a chosen allocation is a rule, not a discovery. Giving video more credit for "halo" just moves customers between rows, and it doesn't prove the halo exists. Model settings matter too. Google Ads, for example, offers data-driven and last click models, which can credit the same conversion differently.
Attribution still has uses, like comparing campaigns inside a channel. UTMs and discount codes improve the tracking. They don't show what would've happened otherwise.
Incremental CAC
Incremental CAC asks how many customers the channel caused. Controlled tests give the most direct estimate, and causal response models can estimate it under stronger assumptions. Google's Conversion Lift compares people who saw ads with a group who didn't, and defines incremental cost per action as spend divided by incremental conversions.
Assume these lift results, which are inputs to the example:
| Channel | Spend | Assumed incremental customers | Incremental CAC |
|---|---|---|---|
| Social | $30,000 | 400 | $75.00 |
| Video | $10,000 | 150 | $66.67 |
Search has no assumed result, so it stays unknown. Don't fill it in with its attributed number.
Under these assumptions, the story flips. Social's credit was 800, but it's assumed to have caused 400. Video's credit was 100, but it's assumed to have caused 150. That can happen when buyers reached by video later come through search or social, and attribution credits those channels.
A warning on combining vendor models: blending three attribution tools doesn't make a causal estimate. It gives you an average of three sets of credit.
Marginal CAC
Incremental CAC is an average across all the money you spent. The next dollar doesn't behave like the average, because channels saturate. The cheapest reachable customers tend to go first.
So marginal CAC looks at the change. Assume these response curves, which are illustrative, not measured:
| Channel | Now | Next $10,000 adds | Average incremental CAC | Marginal CAC estimated over the next $10,000 |
|---|---|---|---|---|
| Social | $30,000, 400 customers | 80 | $75.00 | $125.00 |
| Video | $10,000, 150 customers | 130 | $66.67 | $76.92 |
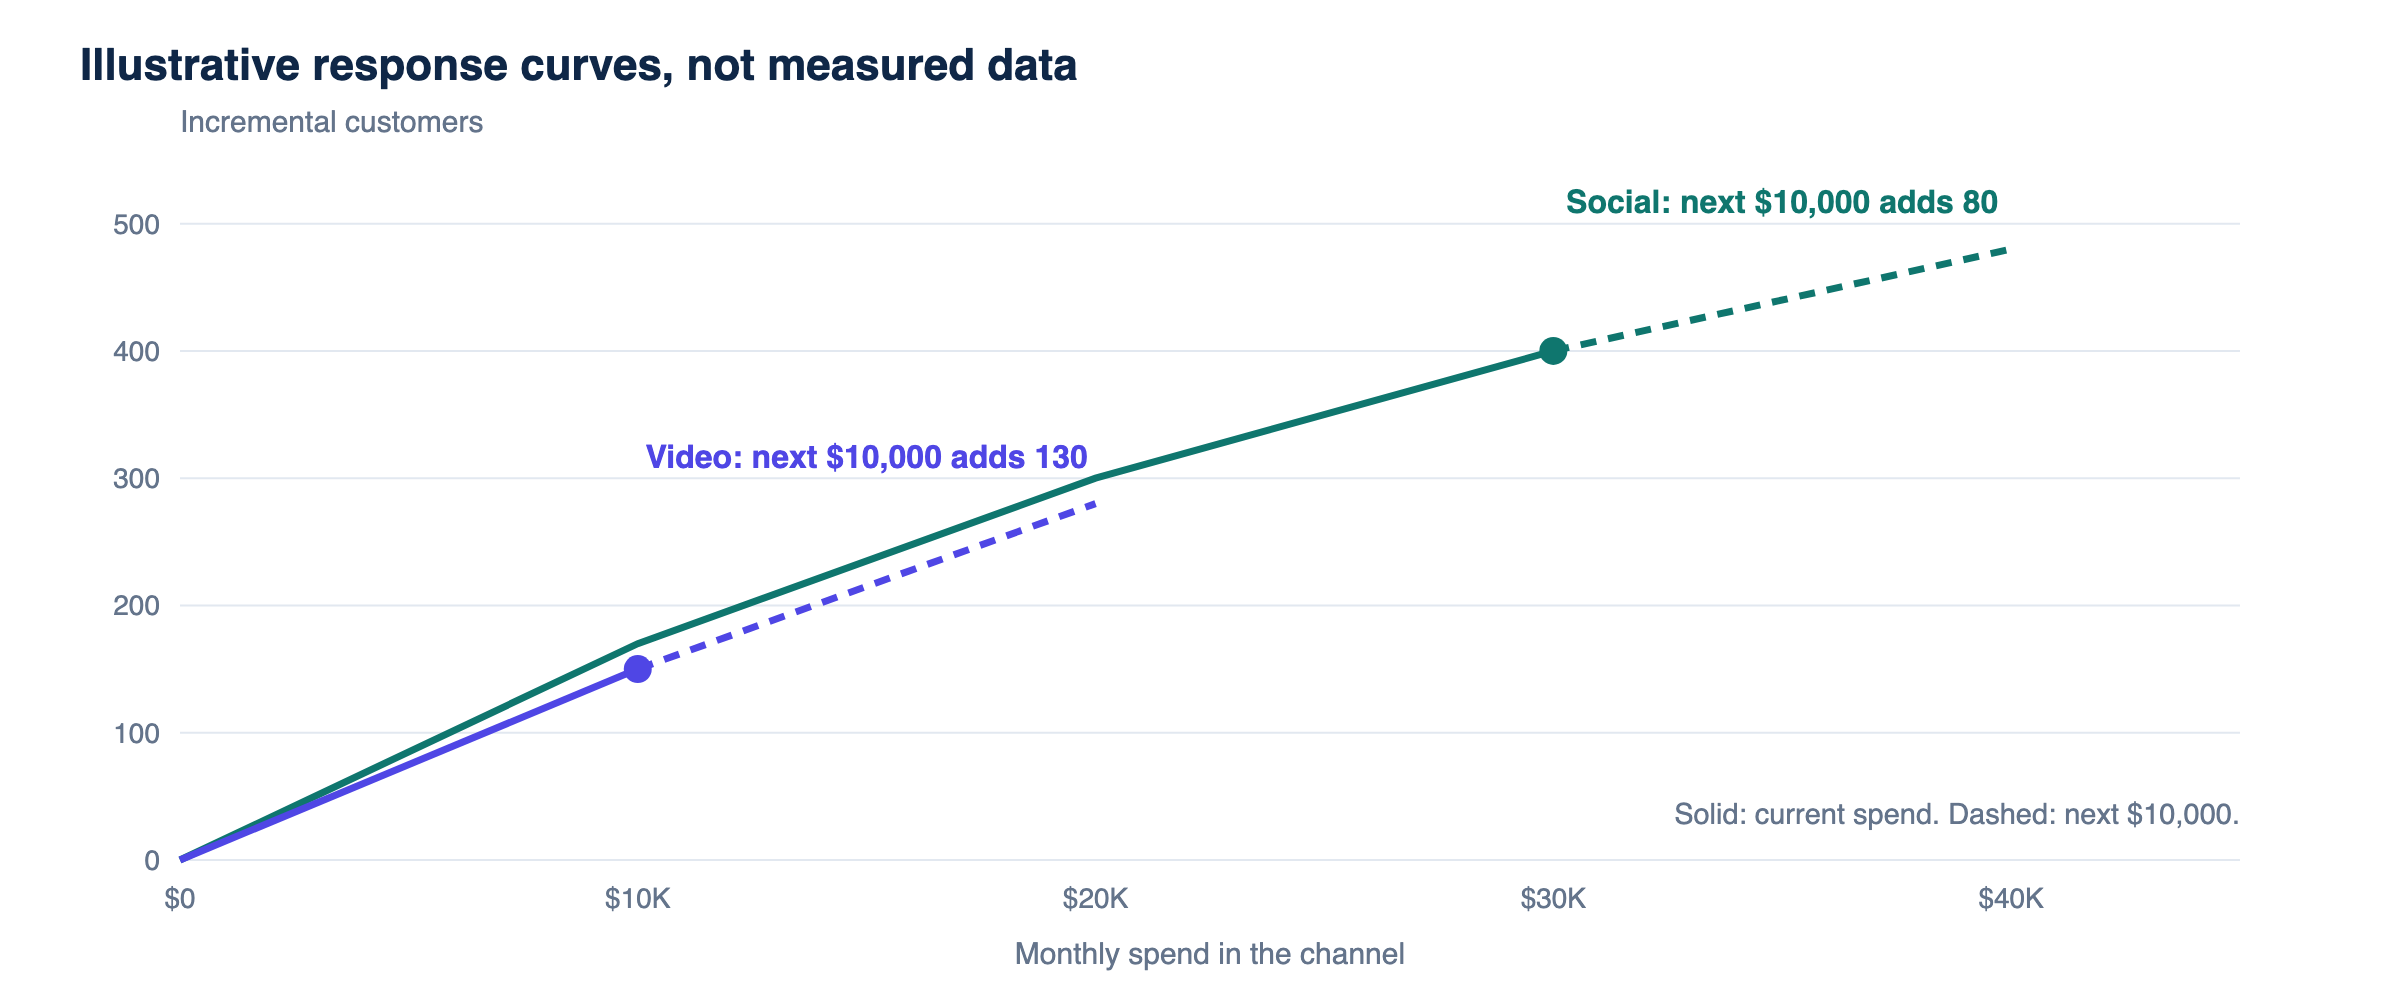
Where do curves come from? Usually from spend tests at different levels, or from a marketing mix model. Google's open-source Meridian tool reports marginal ROI, described as the return from an additional unit of spend, and marks where returns start to diminish. A model's curve is an estimate that depends on its priors and data, so check it against experiments when you can.
Make the decision
Say each incremental customer brings $100 of contribution over 12 months. That's cumulative contribution before CAC, again an assumption.
| View | What it suggests |
|---|---|
| Blended, $40 | Business looks healthy against $100 |
| Attributed | Cut video, keep social |
| Incremental | Both pay back on average |
| Marginal CAC estimated over the next $10,000 | Video's next $10,000 clears $100, social's doesn't |
In the next $10,000, social's added customers cost $125 each against $100 of contribution. Video's cost $76.92. Between these two options, the next $10,000 goes to video. Search stays unranked because it has no assumed result.
That doesn't show social's current spend is losing money. On the same assumed curve, its last $10,000 added 100 customers at $100 each, which only breaks even on that $100 of contribution. If you want to know what cutting social would do, test a reduction.
The attributed view gave the opposite answer. That's why the question matters as much as the number.
Keep the comparison fair
Use the same horizon. Compare CAC with contribution at one stated age. If lift was measured over 30 days and contribution over 12 months, say so. Slow channels can look worse in short windows.
Count the same customers. Don't mix new-to-brand with first-order, or lift on all conversions with CAC on new customers.
State the costs. Decide whether CAC includes agency fees and creative, then use it everywhere.
Allocate spend once. Each media dollar belongs in one row, including shared brand or TV budgets.
Don't overread small tests. Confidence intervals can be wide, and a result can age as creative and season change. Google's Conversion Lift isn't available for every account, and a small channel may lack the volume to read.
What to do next
You'll usually have blended and attributed CAC, and need to work for incremental and marginal CAC. Start with a test on your biggest channel, since that's where a wrong number costs most. Put these on your daily scorecard only if each is labelled, so nobody reads a blended number as a causal one.
All of these numbers are made up, and your own curves will look different. If your warehouse doesn't yet hold spend and orders in one place, the ecommerce data warehouse page shows how I'd set that up.
Related
How to avoid double-counting Shopify, Amazon and TikTok orders
Separate the sales channel from the fulfillment provider, link mirrored orders, and reconcile revenue before combining Shopify, Amazon and TikTok Shop reports.
GuideMap SKUs across Shopify, Amazon and TikTok without breaking margin
Build a product crosswalk with source IDs, dated mappings and explicit bundle quantities. Catch duplicate joins and missing costs before calculating product margin.
GuideShopify refund date vs order date: why monthly sales differ
A refund processed this month can belong to last month's order. Learn how event-date and order-cohort reporting differ and reconcile both without double counting.