The data stack, mapped: 61 tools by the job they do
A map of the modern data stack in 11 categories, from ingestion and warehouses to semantic layers, BI, and AI, with what each tool does and how to choose.

Greyfield Data
In this article 16 sections
A data stack is a set of jobs, not a set of logos: get data in, store it, clean it, define it, show it, and keep it trustworthy. This map sorts 61 common tools by the job they do, so you can see which layer you are actually shopping for.
If you are setting up or fixing the Snowflake, dbt, and BI layers, that is the work Greyfield does. See Snowflake consulting or Sigma consulting.
Key takeaways
- Most teams need four layers to start: ingestion, a warehouse, transformation, and BI. Everything else solves a problem you may not have yet.
- Transformation and a semantic layer are where numbers start to agree. Skipping them is why dashboards disagree.
- Tools in the same box are not interchangeable. Pricing model, who will run it, and the cloud you already use usually decide.
- Add observability, a catalog, and activation when the number of tables, people, or downstream uses outgrows what a few people can watch.
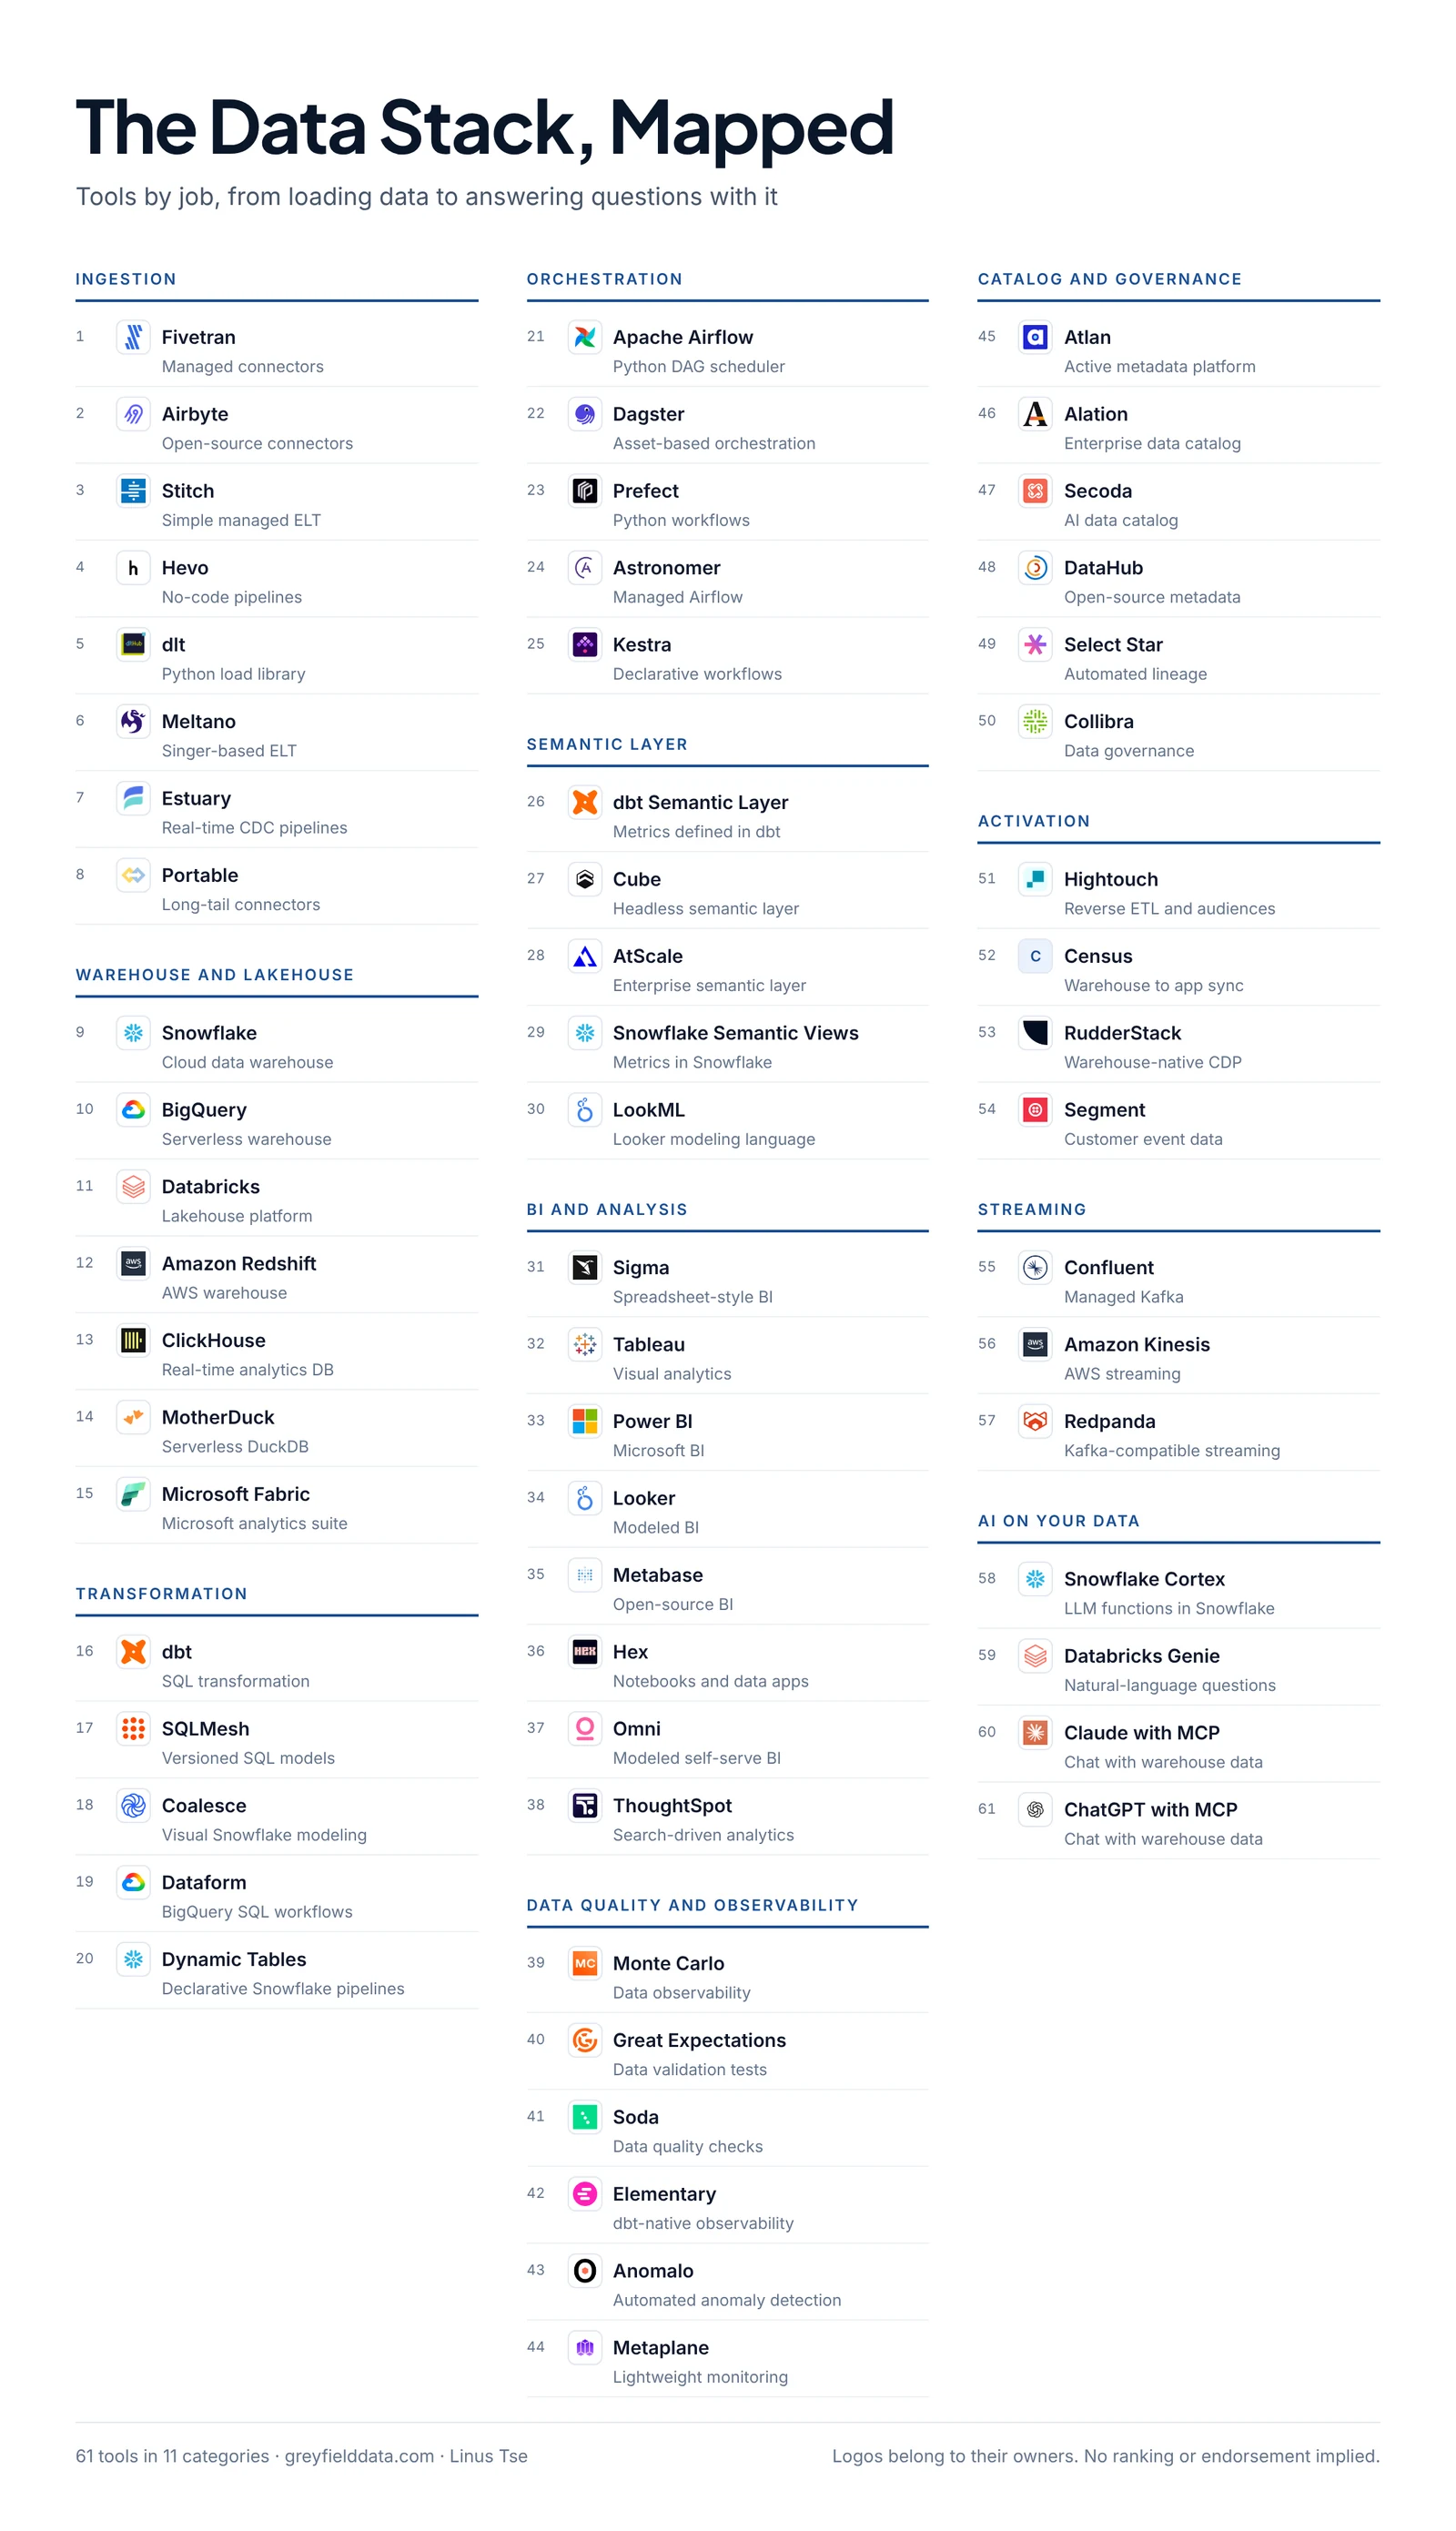
Download the full-size map (PNG)
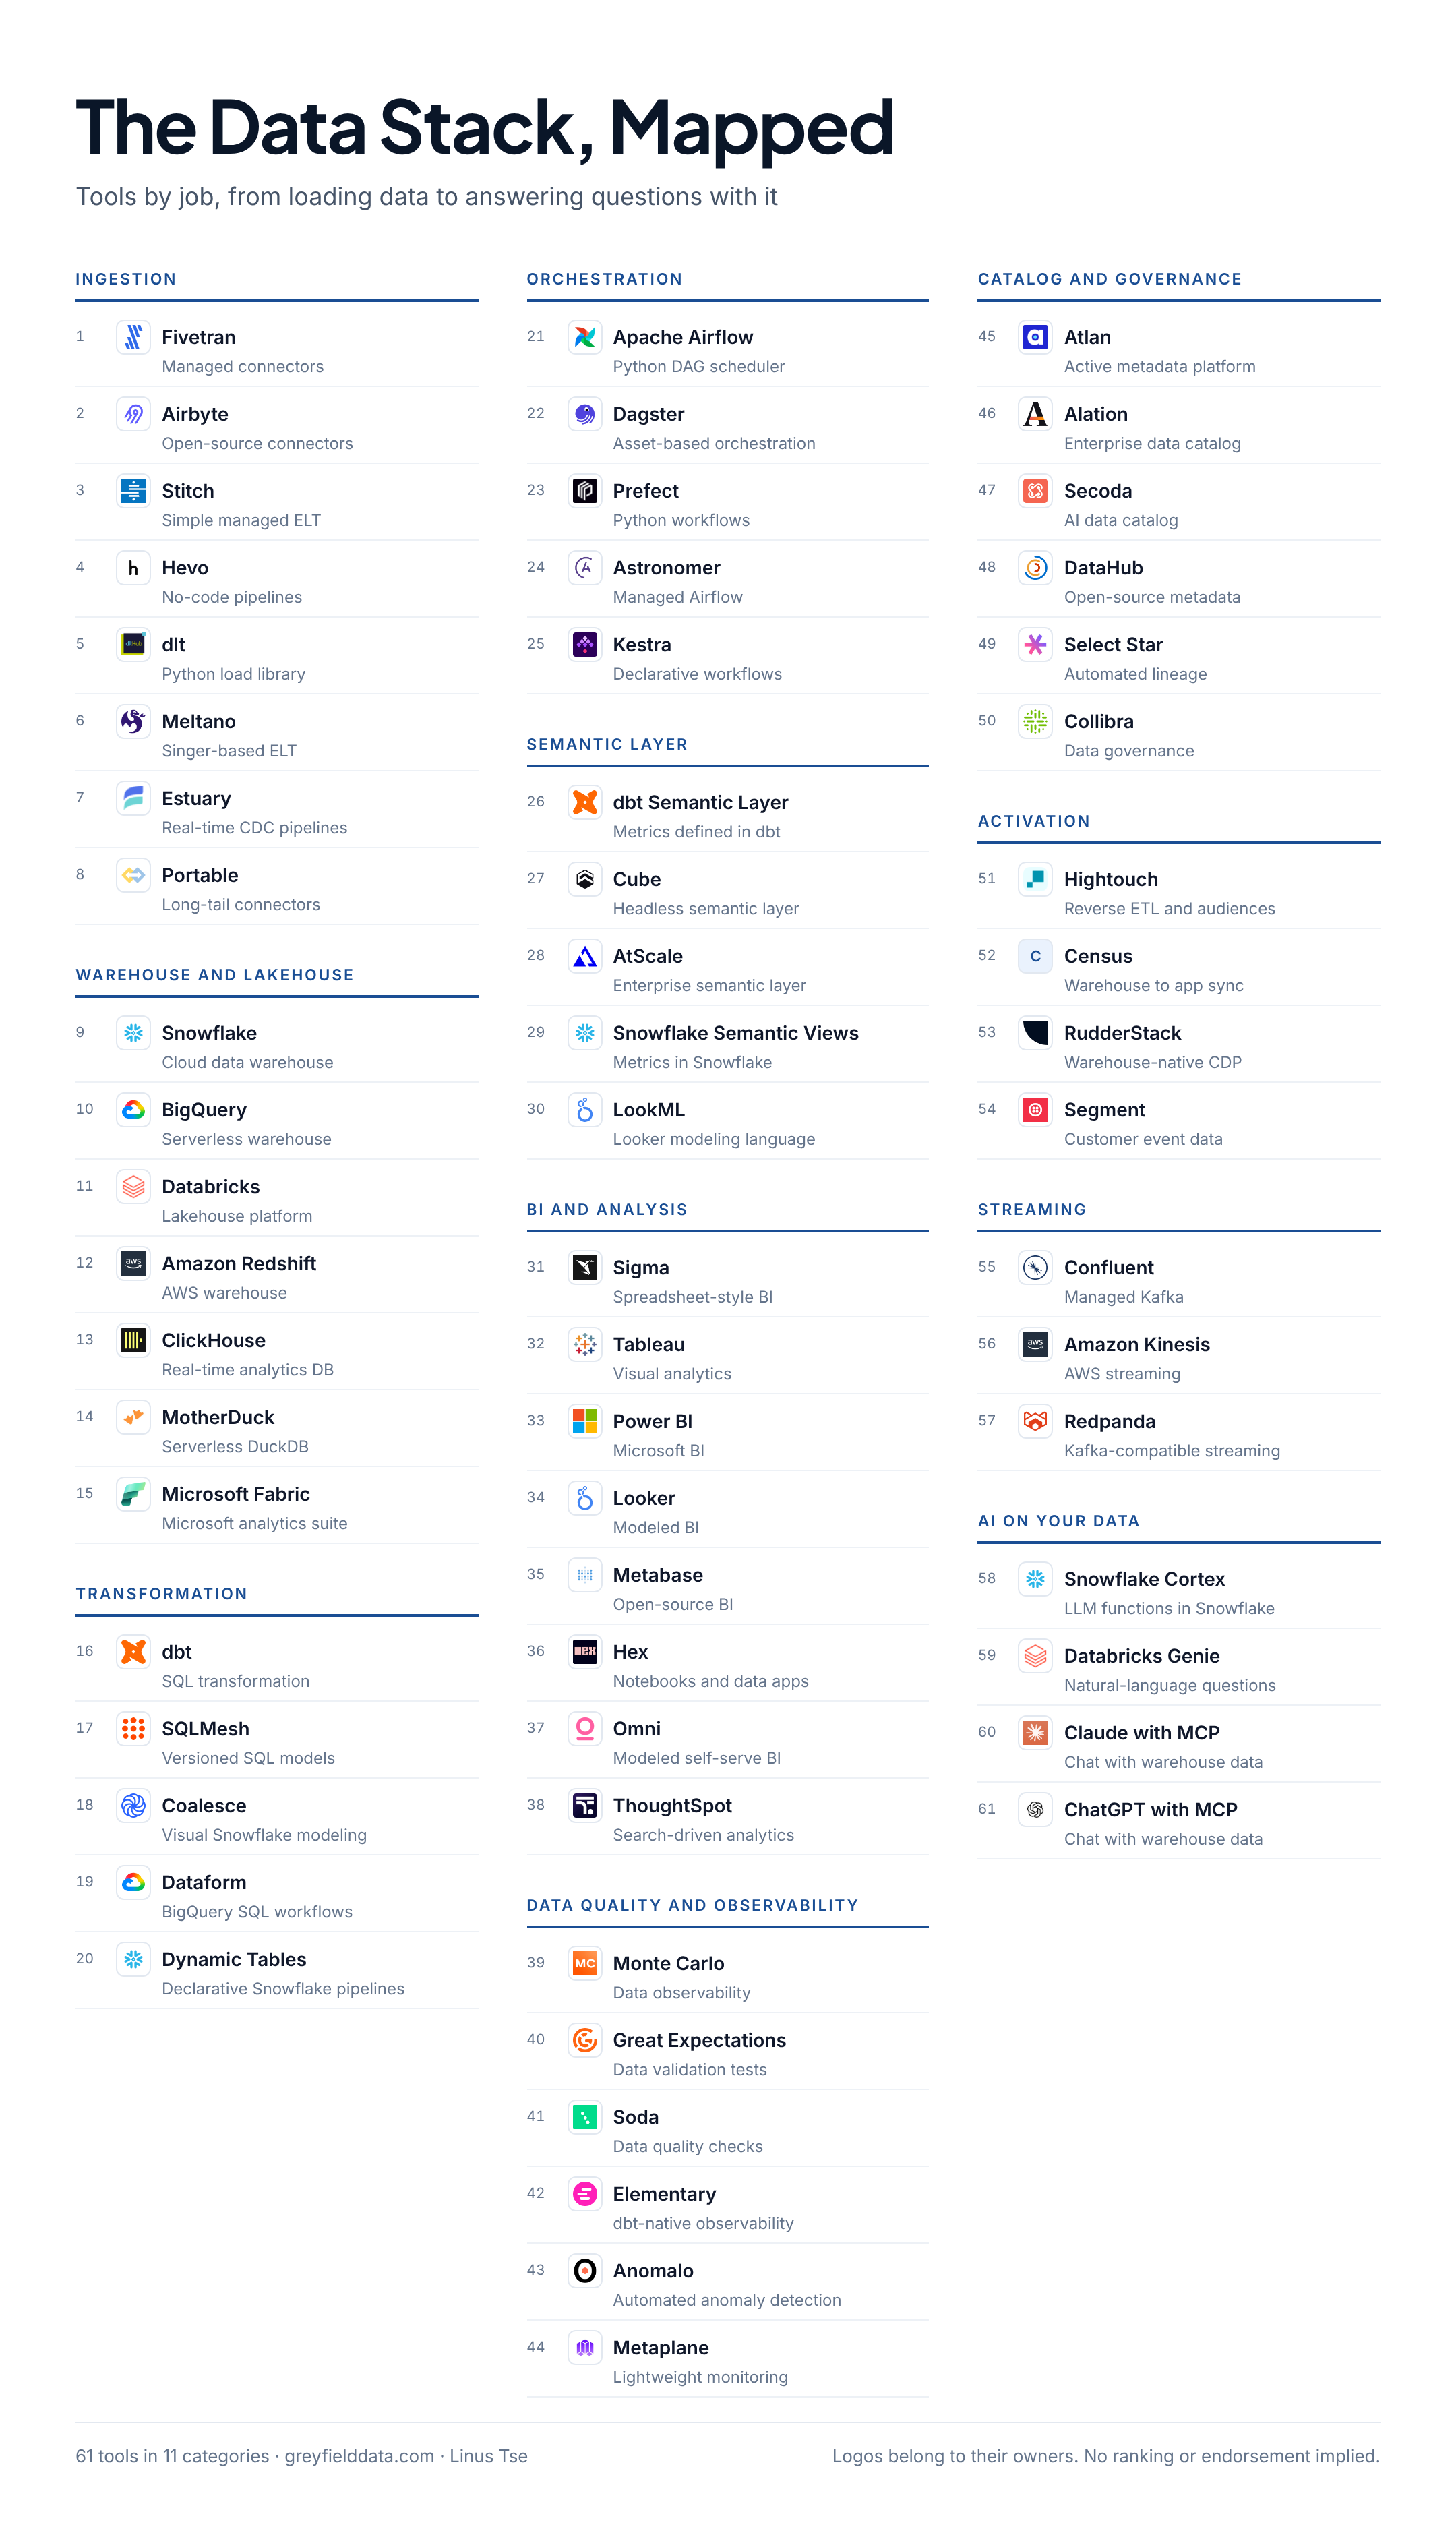
How to read the map
Each column groups tools by the job they do. Numbers are for reference, not a ranking. Many vendors cover more than one box; each tool sits where most teams use it. Inclusion is not an endorsement, and leaving a tool out isn’t a judgment either.
Ingestion
Ingestion tools copy data from apps and databases into your warehouse on a schedule. The real difference between them is connector coverage, how they handle schema changes, and how they price: by rows, by connector, or by compute.
| # | Tool | What it does | Compare |
|---|---|---|---|
| 1 | Fivetran | Managed connectors | |
| 2 | Airbyte | Open-source connectors | |
| 3 | Stitch | Simple managed ELT | |
| 4 | Hevo | No-code pipelines | |
| 5 | dlt | Python load library | |
| 6 | Meltano | Singer-based ELT | |
| 7 | Estuary | Real-time CDC pipelines | |
| 8 | Portable | Long-tail connectors |
Warehouse and lakehouse
This is where the data lives and where the work runs. Pick it once and plan to keep it: everything else connects to it. For a small team the deciding factors are usually the cloud you already use, pricing model, and who will run it. See Snowflake, BigQuery, and Azure compared for ecommerce.
| # | Tool | What it does | Compare |
|---|---|---|---|
| 9 | Snowflake | Cloud data warehouse | |
| 10 | BigQuery | Serverless warehouse | |
| 11 | Databricks | Lakehouse platform | |
| 12 | Amazon Redshift | AWS warehouse | |
| 13 | ClickHouse | Real-time analytics DB | |
| 14 | MotherDuck | Serverless DuckDB | |
| 15 | Microsoft Fabric | Microsoft analytics suite |
Transformation
Transformation turns raw tables into clean, tested models with business names. This is where most of the trust in your numbers is built. If you only adopt one tool from this map beyond a warehouse and a BI tool, make it this layer. The bronze, silver, and gold walkthrough shows what it produces.
| # | Tool | What it does | Compare |
|---|---|---|---|
| 16 | dbt | SQL transformation | |
| 17 | SQLMesh | Versioned SQL models | |
| 18 | Coalesce | Visual Snowflake modeling | |
| 19 | Dataform | BigQuery SQL workflows | |
| 20 | Dynamic Tables | Declarative Snowflake pipelines |
Orchestration
Orchestrators run jobs in order and retry them when they fail. Many small teams don’t need one at first: the loader and dbt schedules are enough until pipelines depend on each other.
| # | Tool | What it does | Compare |
|---|---|---|---|
| 21 | Apache Airflow | Python DAG scheduler | |
| 22 | Dagster | Asset-based orchestration | |
| 23 | Prefect | Python workflows | |
| 24 | Astronomer | Managed Airflow | |
| 25 | Kestra | Declarative workflows |
Semantic layer
A semantic layer defines each metric once, so dashboards, spreadsheets, and AI tools all use the same logic. Why Shopify, finance, and marketing report different revenue explains why that matters.
| # | Tool | What it does | Compare |
|---|---|---|---|
| 26 | dbt Semantic Layer | Metrics defined in dbt | |
| 27 | Cube | Headless semantic layer | |
| 28 | AtScale | Enterprise semantic layer | |
| 29 | Snowflake Semantic Views | Metrics in Snowflake | |
| 30 | LookML | Looker modeling language |
BI and analysis
BI tools are where people see and question the numbers. The fit depends on who builds reports and who reads them: analysts writing SQL, finance teams who think in spreadsheets, or executives who want a fixed dashboard.
| # | Tool | What it does | Compare |
|---|---|---|---|
| 31 | Sigma | Spreadsheet-style BI | |
| 32 | Tableau | Visual analytics | Compare with Sigma |
| 33 | Power BI | Microsoft BI | Compare with Sigma |
| 34 | Looker | Modeled BI | Compare with Sigma |
| 35 | Metabase | Open-source BI | Compare with Sigma |
| 36 | Hex | Notebooks and data apps | Compare with Sigma |
| 37 | Omni | Modeled self-serve BI | Compare with Sigma |
| 38 | ThoughtSpot | Search-driven analytics |
Data quality and observability
These tools catch broken pipelines and odd numbers before a stakeholder does. Start with tests in your transformation layer; add an observability tool when there are more tables than people watching them.
| # | Tool | What it does | Compare |
|---|---|---|---|
| 39 | Monte Carlo | Data observability | |
| 40 | Great Expectations | Data validation tests | |
| 41 | Soda | Data quality checks | |
| 42 | Elementary | dbt-native observability | |
| 43 | Anomalo | Automated anomaly detection | |
| 44 | Metaplane | Lightweight monitoring |
Catalog and governance
Catalogs document what each table and column means, who owns it, and where it came from. They matter more as the number of people and tables grows.
| # | Tool | What it does | Compare |
|---|---|---|---|
| 45 | Atlan | Active metadata platform | |
| 46 | Alation | Enterprise data catalog | |
| 47 | Secoda | AI data catalog | |
| 48 | DataHub | Open-source metadata | |
| 49 | Select Star | Automated lineage | |
| 50 | Collibra | Data governance |
Activation
Activation tools send modeled data back out of the warehouse: audiences to ad platforms, scores to a CRM, events to marketing tools.
| # | Tool | What it does | Compare |
|---|---|---|---|
| 51 | Hightouch | Reverse ETL and audiences | |
| 52 | Census | Warehouse to app sync | |
| 53 | RudderStack | Warehouse-native CDP | |
| 54 | Segment | Customer event data |
Streaming
Streaming moves events in seconds instead of hours. Most reporting doesn’t need it; operational use cases like fraud checks or live inventory sometimes do.
| # | Tool | What it does | Compare |
|---|---|---|---|
| 55 | Confluent | Managed Kafka | |
| 56 | Amazon Kinesis | AWS streaming | |
| 57 | Redpanda | Kafka-compatible streaming |
AI on your data
The newest layer lets people ask questions in plain language against governed data. It works best on top of a clean semantic layer. Setup guides: Claude and ChatGPT with Snowflake.
| # | Tool | What it does | Compare |
|---|---|---|---|
| 58 | Snowflake Cortex | LLM functions in Snowflake | |
| 59 | Databricks Genie | Natural-language questions | |
| 60 | Claude with MCP | Chat with warehouse data | |
| 61 | ChatGPT with MCP | Chat with warehouse data |
Which layers do you need first?
| Stage | Layers to have | Usually wait on |
|---|---|---|
| First warehouse | Ingestion, warehouse, transformation, BI | Orchestration, catalog, observability, streaming |
| A few analysts, many reports | Add tests, a semantic layer, and scheduling | Streaming, enterprise governance |
| Many teams and tables | Add observability, a catalog, and access rules | Anything nobody owns |
| Data used outside reporting | Add activation and AI on governed data | Real-time, unless a use case needs it |
A stack that is smaller and owned beats one that is complete and abandoned. Before buying a tool for a layer, name the person who will run it.
Frequently asked questions
What is the modern data stack?
It is a set of cloud tools, each doing one job: loading data, storing it in a warehouse, transforming it with SQL, and showing it in BI. The layers connect through the warehouse, so you can swap one tool without rebuilding the rest.
What is the minimum data stack for a small team?
An ingestion tool, a warehouse, a transformation layer such as dbt, and a BI tool. That covers getting data in, cleaning it once, and letting people use it.
Do I need a semantic layer?
You need consistent definitions. A semantic layer is one way to get them, and it becomes more valuable as more tools, people, and AI assistants read the same metrics.
Where does Sigma fit?
Sigma is a BI tool that works like a spreadsheet on top of the warehouse. It suits finance and operations teams who think in spreadsheets but need governed, live data. See Sigma compared with Tableau, Power BI, Looker, and others.
What to do next
If you are choosing a warehouse, start with Snowflake, BigQuery, and Azure compared. If your reports already disagree, read why teams report different revenue. To talk through your stack, book a call.
Part of the Snowflake guides, a reading path through related articles.
Related
What is a semantic layer? A plain-English guide
A semantic layer is a data dictionary with the metrics defined. It holds business definitions of metrics, dimensions, and joins that every tool reads from.
How do you build a semantic layer in Snowflake with semantic views?
A worked CREATE SEMANTIC VIEW example on an orders and customers model, how to query it, how Cortex Analyst uses it, and the limits to plan for.
Ecommerce semantic layer: a metric dictionary for gross sales to LTV
Definitions for gross sales, net sales, net revenue, contribution margin, CAC, repeat rate, and LTV, with grain, date, sources, owner, and a free template.