How do you build a semantic layer in Snowflake with semantic views?
A worked CREATE SEMANTIC VIEW example on an orders and customers model, how to query it, how Cortex Analyst uses it, and the limits to plan for.

Greyfield Data
In this article 11 sections
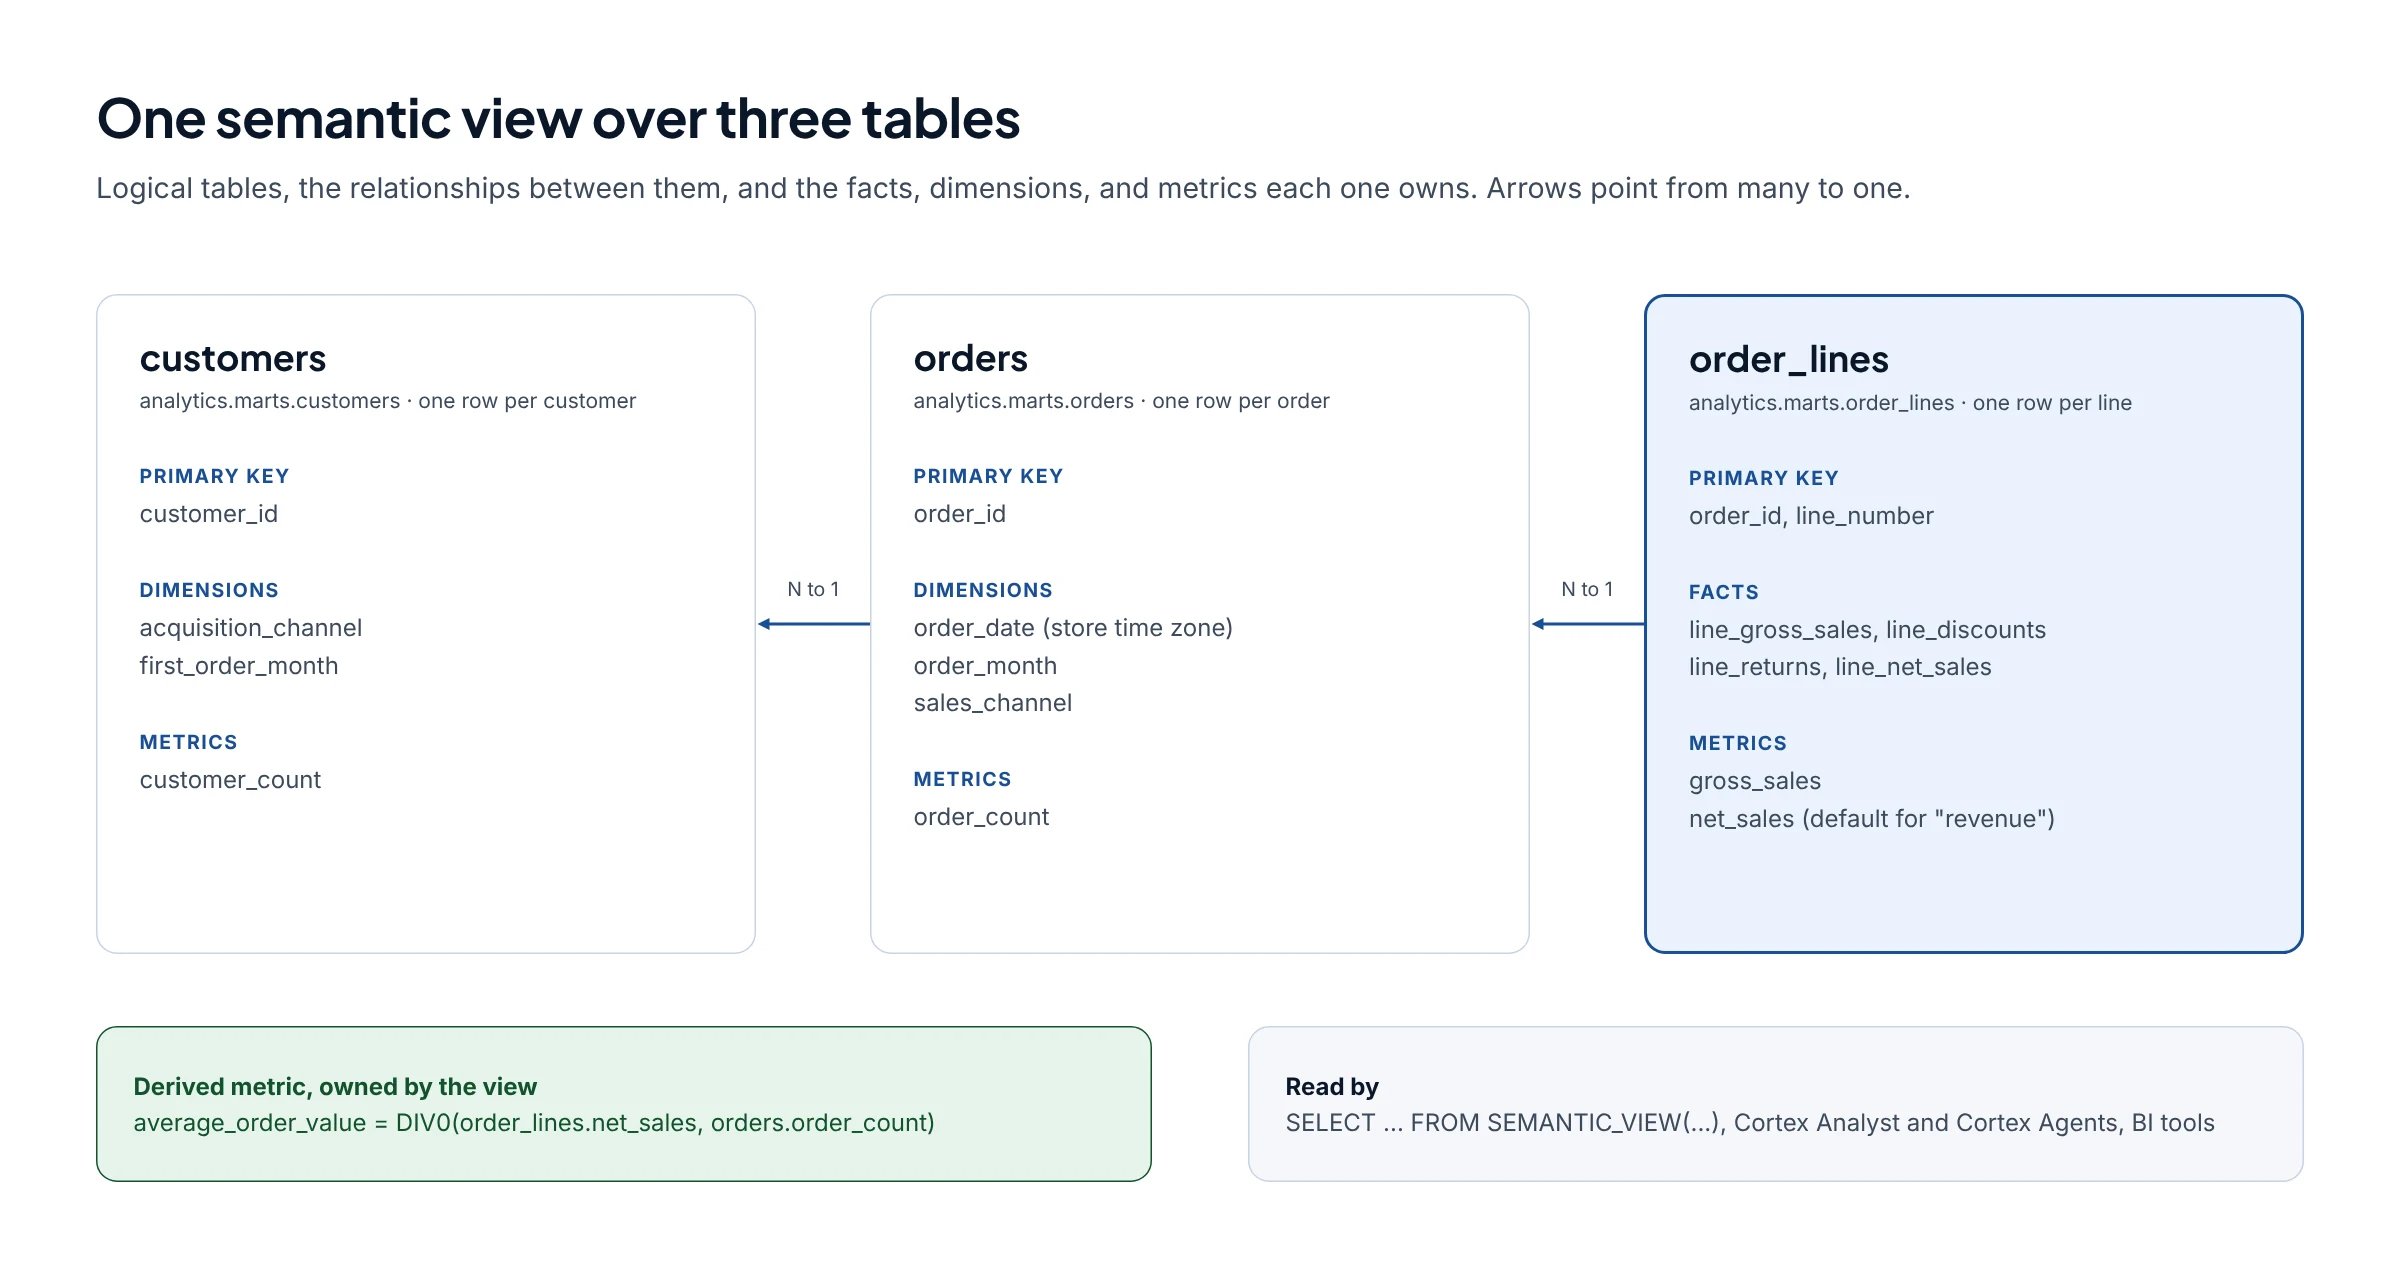
A Snowflake semantic view is a schema-level object that stores your business definitions next to the data: logical tables, the relationships between them, and the facts, dimensions, and metrics built on top. In plain words, it's a data dictionary that has the metrics defined, and Snowflake can run it.
This guide builds one on an orders and customers model, with SQL checked against Snowflake's CREATE SEMANTIC VIEW reference. If you'd rather have it built and tested on your own account, see Snowflake consulting.
Key takeaways
CREATE SEMANTIC VIEWtakes aTABLESclause plus optionalRELATIONSHIPS,FACTS,DIMENSIONS, andMETRICS, in that order. You need at least one dimension or metric.- Facts and dimensions are row-level. Metrics are aggregates. A metric that combines metrics from two tables is a derived metric, written without a table name.
- You query it with
SELECT * FROM SEMANTIC_VIEW(...), or by naming the view inFROMand wrapping metrics inAGG(). - A dimension can only be returned with a metric if its table is at the same or a coarser grain.
SHOW SEMANTIC DIMENSIONS ... FOR METRIClists the safe ones. - Cortex Analyst reads the view's descriptions to write SQL. Snowflake's own guidance says descriptions matter most for accuracy, and it now recommends Cortex Agents for new work.
What is a Snowflake semantic view?
It's Snowflake's built-in semantic layer. Snowflake describes it as a way to store business concepts directly in the database, so a metric like net revenue has one definition instead of a different calculation in every report.
A semantic view has five building blocks:
| Block | What it is | Example in this guide |
|---|---|---|
| Logical table | A business entity mapped to a table or view, with a primary key | orders on analytics.marts.orders |
| Relationship | A join from one logical table to another's primary key | orders (customer_id) REFERENCES customers |
| Fact | A row-level value, often a helper for metrics | line_net_sales per order line |
| Dimension | A row-level attribute to group or filter by | order_month, sales_channel |
| Metric | An aggregate across rows | net_sales = SUM(line_net_sales) |
You can build one with SQL, with a wizard in Snowsight, or in Semantic Studio. This guide uses SQL, because it's easy to review and keep in version control. For the bigger picture, including other tools, see what a semantic layer is.
What does the example model look like?
Three tables, already cleaned in the warehouse (by dbt or similar). Each has one clear grain:
CREATE TABLE analytics.marts.customers (
  customer_id          VARCHAR,
  first_order_date     DATE,      -- store time zone
  first_order_channel  VARCHAR
);

CREATE TABLE analytics.marts.orders (
  order_id     VARCHAR,
  customer_id  VARCHAR,
  placed_date  DATE,              -- store time zone
  channel      VARCHAR            -- shopify, amazon, tiktok_shop
);

CREATE TABLE analytics.marts.order_lines (
  order_id         VARCHAR,
  line_number      INTEGER,
  gross_amount     NUMBER(12,2),  -- unit price x quantity
  discount_amount  NUMBER(12,2),
  refunded_amount  NUMBER(12,2)   -- item value refunded so far
);
Do the time zone conversion before this point. A semantic view doesn't know your store's time zone, so placed_date should already be the local date you report on. The ecommerce metric dictionary explains why that choice moves monthly totals.
How do you write CREATE SEMANTIC VIEW?
Here's the full statement. Each clause is explained below it.
CREATE OR REPLACE SEMANTIC VIEW analytics.semantic.ecommerce_sales

  TABLES (
    customers AS analytics.marts.customers
      PRIMARY KEY (customer_id)
      COMMENT = 'One row per customer who has placed at least one order.',
    orders AS analytics.marts.orders
      PRIMARY KEY (order_id)
      COMMENT = 'One row per order. Test and staff orders are removed upstream. Dates are in the store time zone, America/New_York.',
    order_lines AS analytics.marts.order_lines
      PRIMARY KEY (order_id, line_number)
      COMMENT = 'One row per order line. Amounts in USD, excluding tax and shipping.'
  )

  RELATIONSHIPS (
    orders_to_customers AS
      orders (customer_id) REFERENCES customers,
    lines_to_orders AS
      order_lines (order_id) REFERENCES orders
  )

  FACTS (
    order_lines.line_gross_sales AS gross_amount
      COMMENT = 'Unit price times quantity, before discounts and returns',
    order_lines.line_discounts AS discount_amount,
    order_lines.line_returns AS refunded_amount
      COMMENT = 'Item value refunded on this line so far, counted against the order date',
    order_lines.line_net_sales AS gross_amount - discount_amount - refunded_amount
  )

  DIMENSIONS (
    customers.acquisition_channel AS first_order_channel
      COMMENT = 'Channel that acquired the customer, from the first order',
    customers.first_order_month AS DATE_TRUNC('MONTH', first_order_date)
      COMMENT = 'Month of the first order, store time zone',
    orders.order_date AS placed_date
      COMMENT = 'Date the order was placed, store time zone',
    orders.order_month AS DATE_TRUNC('MONTH', placed_date)
      COMMENT = 'Month the order was placed, store time zone',
    orders.sales_channel AS channel
      COMMENT = 'Where the order was placed: shopify, amazon, or tiktok_shop'
  )

  METRICS (
    order_lines.gross_sales AS SUM(order_lines.line_gross_sales)
      COMMENT = 'Item sales before discounts and returns',
    order_lines.net_sales AS SUM(order_lines.line_net_sales)
      COMMENT = 'Default metric for revenue or sales. Gross sales minus discounts and returns, by order date. Excludes tax and shipping.',
    orders.order_count AS COUNT(order_id)
      COMMENT = 'Number of orders',
    customers.customer_count AS COUNT(customer_id)
      COMMENT = 'Number of customers',
    average_order_value AS DIV0(order_lines.net_sales, orders.order_count)
      COMMENT = 'Net sales per order'
  )

  COMMENT = 'Ecommerce sales: orders, order lines, and customers across Shopify, Amazon, and TikTok Shop'

  AI_SQL_GENERATION 'If a question says revenue or sales without more detail, use net_sales. Use order_month for monthly questions. Round currency to 2 decimals.'

  AI_QUESTION_CATEGORIZATION 'If a question asks for profit or margin, explain that this view has no cost data and offer net_sales instead.';
TABLES: one logical table per business entity
Each entry gives an alias, the physical table, and a primary key. A composite key goes in one list, as on order_lines. Once you give an alias, you must use it everywhere else in the view.
The comments aren't decoration. They're what an AI tool reads to understand the table, so put the grain, the exclusions, and the time zone there.
RELATIONSHIPS: joins, declared once
orders (customer_id) REFERENCES customers says many orders belong to one customer. The referenced side must be a primary key or a UNIQUE column. Snowflake also works out indirect paths, so order_lines reaches customers through orders without a third relationship.
Two rules to know: you can't define circular relationships, and a table can't currently reference itself.
FACTS: row-level helpers
Facts live at the grain of their table. line_net_sales is one value per order line. Facts are mainly there to build metrics, and you can mark one PRIVATE if it shouldn't be queried directly.
Note the comment on line_returns: this view counts a refund against the original order date. Shopify's sales reports count it on the date it was processed. Both are valid, but they give different months, so say which one you chose. Refund date vs order date covers the difference.
DIMENSIONS: how people slice the numbers
Dimensions are row-level too, and can use scalar functions like DATE_TRUNC. Dimensions are always public.
METRICS: aggregates, and one derived metric
A regular metric belongs to a table and must use an aggregate. order_lines.net_sales sums line-level facts. orders.order_count counts orders on the orders table, so it's never inflated by line rows.
average_order_value has no table prefix. That makes it a derived metric, scoped to the whole view, which is how you combine metrics from two tables. DIV0 returns 0 instead of an error when there are no orders.
COMMENT, AI_SQL_GENERATION, and AI_QUESTION_CATEGORIZATION
These come after the metrics, in that order. The two AI_ clauses are custom instructions for Cortex Analyst: one for how to write SQL, one for how to classify or reject a question. Keep them specific and test after each change.
How do you query a semantic view?
You name the dimensions and metrics you want, and Snowflake writes the joins and the GROUP BY.
SELECT * FROM SEMANTIC_VIEW(
    analytics.semantic.ecommerce_sales
    DIMENSIONS orders.order_month, orders.sales_channel
    METRICS order_lines.net_sales, orders.order_count, average_order_value
    WHERE orders.order_date >= '2026-01-01'
  )
  ORDER BY order_month, sales_channel;
You can also name the view in FROM like a normal view. Metrics then go inside AGG(), and every dimension in the SELECT list must be in GROUP BY:
SELECT acquisition_channel, AGG(net_sales), AGG(customer_count)
  FROM analytics.semantic.ecommerce_sales
  GROUP BY acquisition_channel;
That second form has limits: no joins, no window function calls, no QUALIFY, and no PIVOT in that statement.
What should the sample data return?
Here are six synthetic order lines across four orders, with the results the first query should give. I calculated them with SQLite using the same rules. I haven't run this view in a Snowflake account, so treat it as a test you can load and check.
| Order | Customer | Placed | Channel | Lines (gross / discount / refunded) |
|---|---|---|---|---|
| O1 | C1 | 2026-01-05 | shopify | 60 / 6 / 0 and 40 / 4 / 0 |
| O2 | C2 | 2026-01-20 | shopify | 80 / 0 / 20 |
| O3 | C1 | 2026-02-10 | amazon | 50 / 0 / 0 |
| O4 | C3 | 2026-02-03 | shopify | 30 / 0 / 0 and 30 / 3 / 0 |
| order_month | sales_channel | net_sales | order_count | average_order_value |
|---|---|---|---|---|
| 2026-01-01 | shopify | 150.00 | 2 | 75.00 |
| 2026-02-01 | amazon | 50.00 | 1 | 50.00 |
| 2026-02-01 | shopify | 57.00 | 1 | 57.00 |
The grain is the point of this test. If you join orders to lines yourself and count rows, January shows 3 orders instead of 2, and average order value drops from $75 to $50. Defining order_count on the orders table avoids that.
Which dimensions can you use with which metric?
A dimension's table must be related to the metric's table and be at the same or a coarser grain. net_sales (order lines) can be split by acquisition_channel (customers), because each line belongs to one customer. But customer_count (customers) can't be split by order_month (orders), because one customer can have orders in many months. Snowflake rejects that query with a compilation error.
To list the dimensions that work for a metric:
USE SCHEMA analytics.semantic;
SHOW SEMANTIC DIMENSIONS IN ecommerce_sales FOR METRIC customer_count;
If you need customers by order month, define a metric for it on purpose, such as distinct ordering customers on the orders table, and name it so nobody confuses it with customer_count.
How does Cortex Analyst use a semantic view?
Cortex Analyst turns a plain-English question into SQL. Snowflake says it uses semantic views to understand your data: the descriptions, the metric formulas, the predefined joins, and any verified example questions.
You point it at the view in the REST API request:
{
  "messages": [
    {
      "role": "user",
      "content": [{ "type": "text", "text": "What was net sales by channel last month?" }]
    }
  ],
  "semantic_view": "ANALYTICS.SEMANTIC.ECOMMERCE_SALES"
}
A few things from Snowflake's docs worth planning around:
- Cortex Agents is the recommended path. The Cortex Analyst page now says Snowflake recommends moving to Cortex Agents, where a semantic view is added as a tool.
- Access. Callers need the
SNOWFLAKE.CORTEX_USERorSNOWFLAKE.CORTEX_ANALYST_USERdatabase role.CORTEX_USERis granted toPUBLICby default, so revoke it if not everyone should have it. - It only answers SQL questions. It won't answer "what trends do you see?", and in a conversation it can't see the results of earlier queries.
- Cost. Analyst is billed per message, and the generated SQL also runs on your warehouse.
To query the view, a role only needs SELECT on the semantic view, not on the tables underneath:
GRANT SELECT ON SEMANTIC VIEW analytics.semantic.ecommerce_sales TO ROLE reporting_reader;
That's useful: you can give a reporting or AI role the definitions without opening every raw column. If an assistant connects to Snowflake directly, give it a narrow role.
What limits and gotchas should you plan for?
Most of these come from Snowflake's validation rules and modeling best practices.
| Gotcha | What happens | What to do |
|---|---|---|
| Clause order | FACTS must come before DIMENSIONS, and so on |
Keep the order in the syntax reference |
| Grain mismatch | A dimension at a finer grain than the metric fails | Check with SHOW SEMANTIC DIMENSIONS ... FOR METRIC |
| Facts and metrics together | You can't put FACTS and METRICS in the same SEMANTIC_VIEW query |
Query them separately |
| Many-to-many joins | Not supported directly | Add a bridge table with two many-to-one relationships |
| Self-joins and cycles | A table can't reference itself; no circular relationships | Model hierarchies as separate tables upstream |
CREATE OR ALTER |
Properties you leave out, like COMMENT, are unset; tags aren't changed |
Always send the full definition from version control |
| Time zones | The view uses whatever dates you give it | Convert to the reporting time zone in the tables underneath |
| Size | No hard limit, but Snowflake suggests starting with 5 to 10 tables and staying under about 100,000 tokens | One view per business domain |
| Synonyms | Current guidance is to avoid them unless terms are internal or unusual | Put the meaning in descriptions instead |
| Comments are metadata | Snowflake says not to put personal or sensitive data in metadata | Describe columns, not customers |
One more: Snowflake suggests starting with a lower-stakes domain like sales or marketing, not finance, where answers need to be near perfect. I'd add that the revenue definitions still need finance's sign-off before anyone sees them in a dashboard.
How should you test it before people use it?
- Load a small set of rows where you know the answer, like the sample above.
- Run each metric by each dimension you expect people to use, and compare with a plain SQL query or a source report.
- Write about ten real questions from the business and the answer you expect for each. Snowflake suggests the same size of evaluation set.
- Ask Cortex Analyst or an agent each question and check which metric it chose, not just the number.
- When an answer is wrong, fix the description first. Add verified queries for the questions that still go wrong.
Frequently asked questions
What is the difference between a semantic view and a regular view?
A regular view returns fixed columns from one query. A semantic view stores definitions, and each query picks the dimensions and metrics it needs. Snowflake then writes the joins and grouping for that combination.
Do I need Cortex Analyst to use a semantic view?
No. You can query it with SQL using SEMANTIC_VIEW(...) or by naming it in FROM. Cortex Analyst and Cortex Agents are one way to use it for plain-English questions.
Can I create a semantic view from YAML?
Yes. Snowflake has a SYSTEM$CREATE_SEMANTIC_VIEW_FROM_YAML function and a YAML specification for semantic views. This guide uses SQL because it's easier to read in a review.
Can BI tools query Snowflake semantic views?
Snowflake lists BI as a use case, and the querying docs note that BI tools reading SHOW COLUMNS can query names like "orders.revenue". Support varies by tool, so test yours.
Should I still use dbt if I use semantic views?
Usually yes. dbt (or a similar tool) builds the clean tables with a clear grain. The semantic view sits on top and defines the metrics. See where the semantic layer fits in the data stack.
What to do next
Copy the example, swap in your own tables, and run the sample rows first. For which ecommerce metrics to define and who should own them, read the ecommerce metric dictionary. If you want a second pair of eyes on your model, book a call.
Part of the Snowflake guides, a reading path through related articles.
Related
What is a semantic layer? A plain-English guide
A semantic layer is a data dictionary with the metrics defined. It holds business definitions of metrics, dimensions, and joins that every tool reads from.
The data stack, mapped: 61 tools by the job they do
A map of the modern data stack in 11 categories, from ingestion and warehouses to semantic layers, BI, and AI, with what each tool does and how to choose.
Ecommerce semantic layer: a metric dictionary for gross sales to LTV
Definitions for gross sales, net sales, net revenue, contribution margin, CAC, repeat rate, and LTV, with grain, date, sources, owner, and a free template.