10 mistakes to avoid when building a data team
Building a data team for a DTC brand? Avoid these 10 mistakes, from the cheapest hire and dashboards before definitions to no plan for keeping it running.

Written by Linus Tse, founder of Greyfield Data
· 10 min read
On this page 15 sections
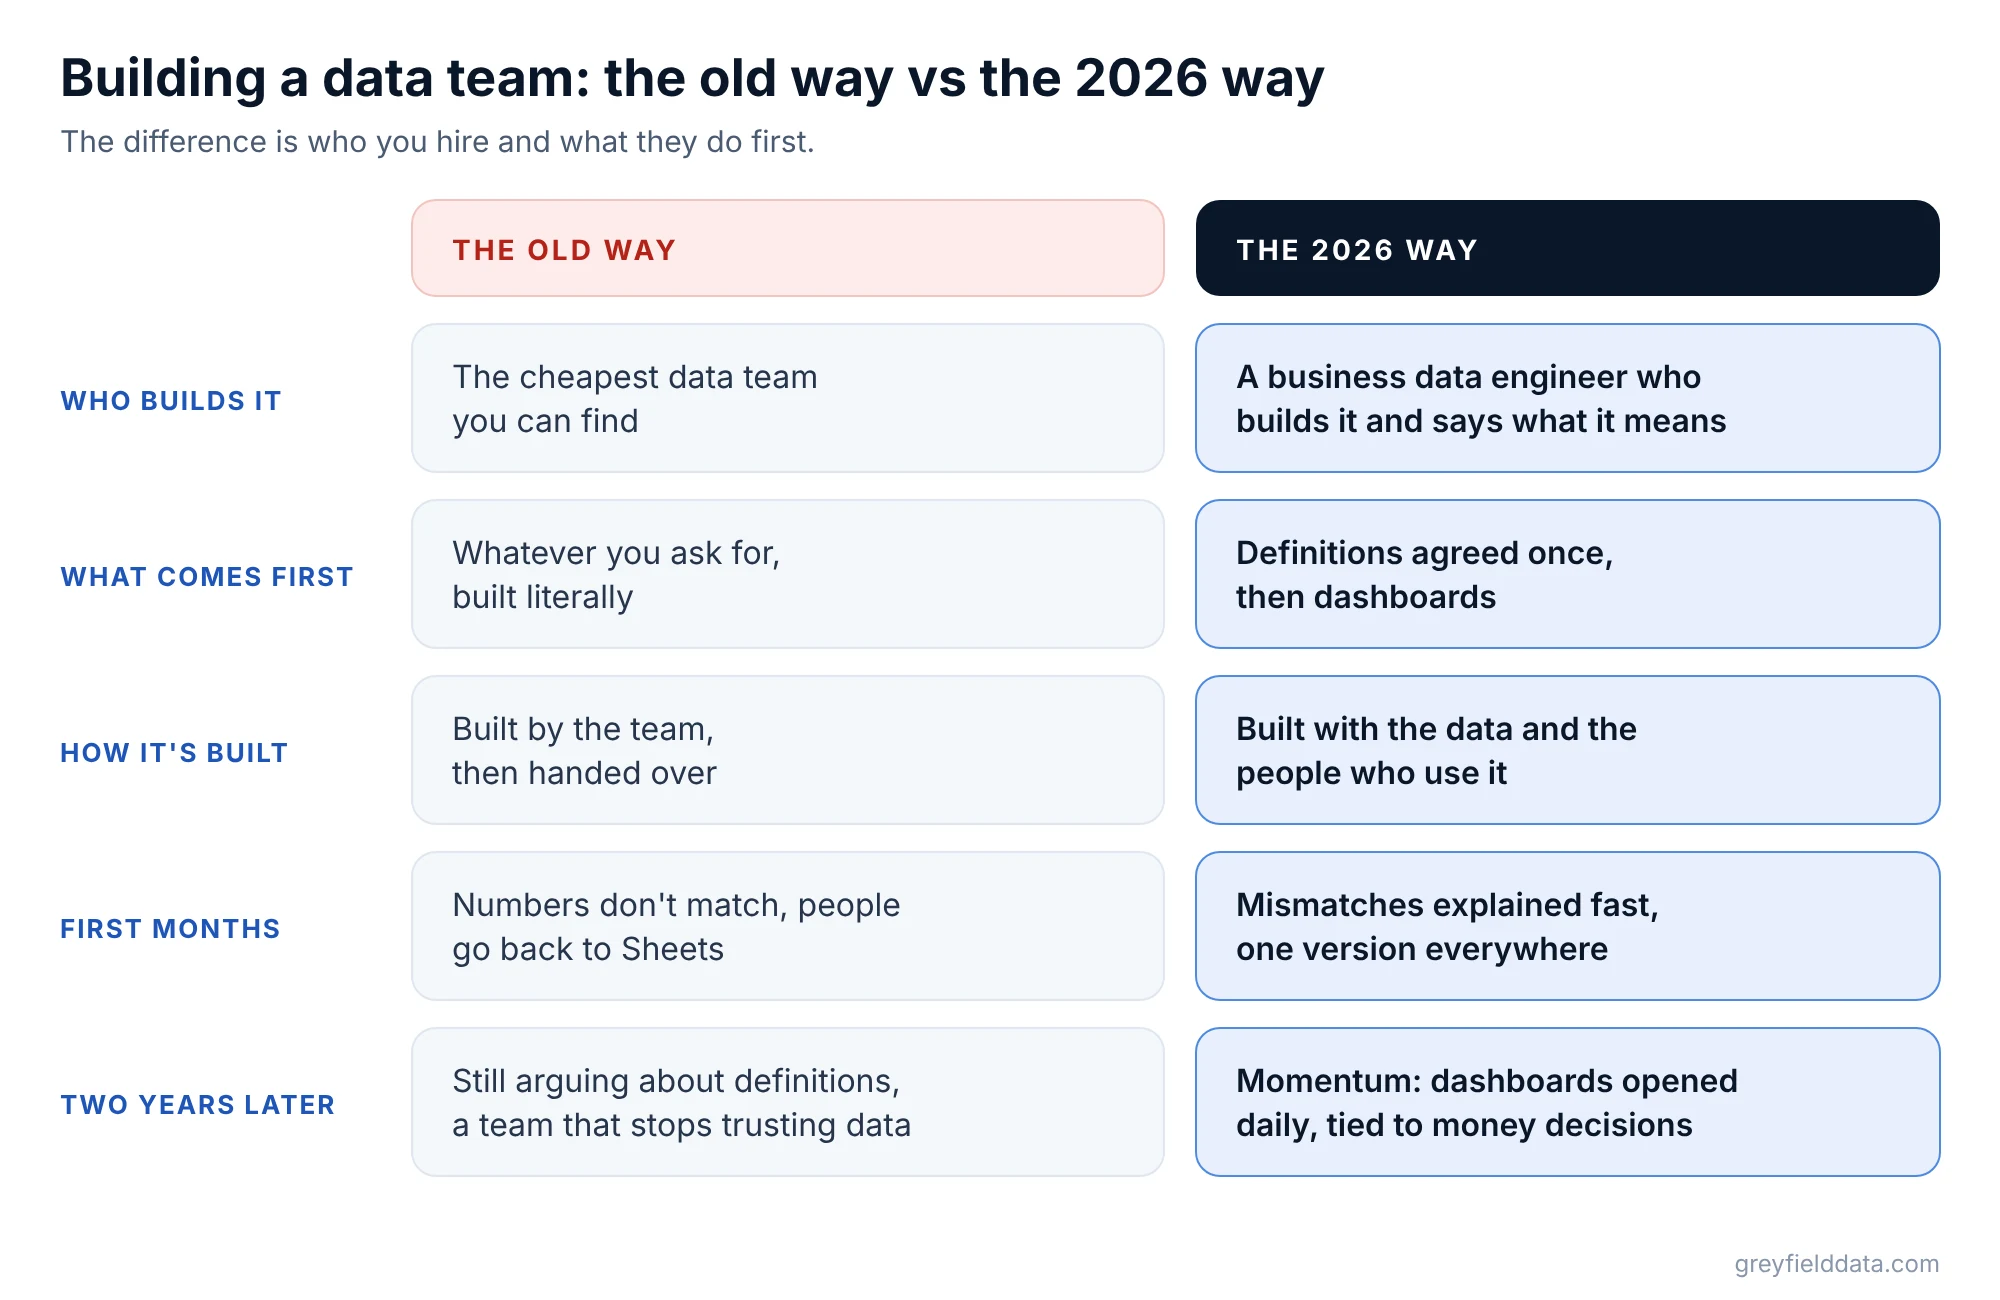
Most DTC brands build their first data team the same way. They hire the cheapest team they can find, ask for dashboards, and watch the numbers fail to match. People drift back to spreadsheets, and two years later the company is still arguing about what a new customer is.
The way that works in 2026 starts with a business data engineer, definitions agreed once, and dashboards built with the people who use them. Our DTC data warehouse and reporting service builds and runs that for you. If you're planning it yourself, the data practice launch planner turns eight quick questions into a plan: what's done, what's next and three first actions.
Key takeaways
- Tie the first project to a money decision, such as where the next ad dollar goes, so the team's value is measured in profit rather than dashboards shipped.
- Your first data hire should be a business data engineer: technical enough to build and run the system, and strong enough on the business to say what the numbers mean.
- Agree definitions, with an owner and a version, before building dashboards. Otherwise every dashboard argues with the others.
- Measure adoption, not the build. A dashboard nobody opens returns nothing.
- Budget for keeping it running from day one. Data breaks quietly when nobody owns it.
The 10 mistakes at a glance
| # | Mistake | What it looks like | Do this instead |
|---|---|---|---|
| 1 | Not tying the work to a money decision | A long list of dashboards, no clear payoff | Start with one decision worth real money |
| 2 | Buying the cheapest team | Cheap to start, expensive to fix | Pay for judgment, not just hours |
| 3 | Hiring someone who builds what you ask but can't say what it means | Numbers delivered, nobody sure what to do | Hire a business data engineer |
| 4 | Building dashboards before definitions are agreed | Three dashboards, three conversion rates | One definition per metric first |
| 5 | No data map | Nobody knows which system feeds which number | Map each business idea to its source |
| 6 | Skipping owner, version and change process | Definitions drift without anyone noticing | Every metric has an owner and a version |
| 7 | Starting with MMM or AI before the basics | A model or chatbot on messy data | Clean facts, then tests, then models |
| 8 | Measuring the build instead of adoption | Launched dashboards nobody opens | Track who opens what, every week |
| 9 | Letting early mismatches kill trust | People quietly go back to Sheets | Explain every mismatch fast and keep momentum |
| 10 | No plan for keeping it running | Reports break months after launch | Name who runs it and how |
1. Not tying the work to a money decision
Without a money decision behind it, a data team gets judged on how many dashboards it ships, and the first budget review asks what any of it was worth.
Pick one decision the business makes every month and is unsure about. For most DTC brands that's where the next ad dollar goes.
Here is an illustration, not a client result. Take a $50M DTC brand spending $12.5M a year on ads. Say 10% of that, $1.25M, sits in a channel where the next dollar brings back $0.33 in first-year profit, and could move to one bringing back $1.11. The difference is $0.78 × $1.25M, about $975K more first-year profit a year.
The honest caveat: returns fall as you add spend, so the real gain would be lower than that. The point is the order of magnitude. A data team that gets that one decision right has paid for itself.
Go deeper: average vs marginal return on ad spend explains the "next dollar" idea.
2. Buying the cheapest team
The cheapest team usually costs the most, because the rework, the mismatched numbers and the lost trust arrive later and on your time.
A low hourly rate buys hours, not judgment. You get what you asked for, built literally, with nobody pushing back when the request doesn't make sense.
Instead: judge a team by whether it can explain your own numbers back to you in plain words. Ask them how they'd define a new customer for a brand selling on its own site and on Amazon. A good answer covers both channels and repeat buyers on new accounts.
3. Hiring someone who builds what you ask for but can't say what it means
A builder without business sense delivers numbers nobody knows how to act on, so the founder or CFO ends up doing the interpretation every week.
A traditional data engineer moves data and builds tables. That's necessary, but for a first data hire at a DTC brand it isn't enough. You need a business data engineer: technical enough to build and run the system, and strong enough on the business to say what the numbers mean and what to do about them.
Instead: test for both in the interview. Ask the candidate to explain why Amazon CAC might look cheap, or why platform-reported customers add up to more than you have. CAC is customer acquisition cost: ad spend divided by new customers.
Go deeper: do DTC brands still need a data engineer on staff?
4. Building dashboards before definitions are agreed
Dashboards built before definitions are agreed each carry their own version of the truth, so the first thing they produce is an argument.
Ask "What was our conversion rate last week?" and a DTC brand can get three answers from three tools: one from Google Analytics, one from a Shopify order export that includes subscription renewals, one from a stale spreadsheet. None is wrong by its own rule. They just use different rules.
Instead: write one definition per metric first. For example: "Conversion Rate v1: website orders ÷ website sessions. Renewals that ship on their own don't count. Amazon tracked on its own. Owner: Growth." Then build dashboards that read from it.
Go deeper: why AI gives different answers to metric questions, and what a semantic layer is: one shared list of metric definitions every tool reads from.
5. Skipping the data map
Without a data map, nobody can say where a number came from, so every mismatch turns into a day of digging.
A data map is a simple list of which system feeds which business idea. "New customer" might come from Shopify orders plus Amazon new-to-brand counts. "Ad spend" comes from each ad platform, plus TV and podcast invoices on the day they ran.
Instead: draw the map before building anything. Note where two systems claim the same idea, since that's where mismatches will start. It also shows quickly which sources you need loaded first.
Go deeper: how to track customers across platforms and why Shopify, finance and marketing report different revenue.
6. Skipping the owner, version and change process
A definition with no owner and no version drifts: someone tweaks it in one tool, and months later two reports disagree and nobody knows why.
Instead: give every metric an owner and a version number. New Customer might be owned by Finance at v2, Conversion Rate by Growth at v1. When a definition changes, follow three steps:
- Someone asks for the change.
- The owner agrees.
- The new version goes live everywhere at once: dashboards, the AI assistant, the email tool and spreadsheets.
Every number then says which version it used. A CFO already works this way: you'd never let three people book revenue three different ways, and a chart of accounts prevents it. Definitions do the same for marketing numbers.
Go deeper: the DTC semantic layer.
7. Starting with MMM or AI before the basics
A model or an AI assistant on messy data gives confident answers that are wrong, and it takes longer to notice because they sound right.
MMM is marketing mix modeling: a statistical model fit on your own weekly history of spend and sales by channel. It can only forecast spend levels you've actually tried. An AI assistant reading three different conversion rates will repeat whichever one it finds.
Instead: go in order. Facts first: clean spend, orders and customers, loaded every day. Then tests: push one channel up for a few weeks, or switch TV off in some cities, and measure what moved. Then the model, checked against the tests. AI assistants become useful once they read the agreed definitions.
Go deeper: marketing mix modeling for DTC brands and how I'd start a data practice from zero.
8. Measuring the build instead of adoption
Counting dashboards launched tells you what the team did, not whether anyone uses it, and a dashboard nobody opens changes no decisions.
Building is the easy part. Adoption is the job. Dashboards people open tend to fit a daily habit: a morning check-in on how yesterday went and what moved, a "did we beat yesterday?" view, on-pace bars for the month against goal, and small streaks such as days in a row under the CAC target.
Instead: build dashboards with the people who will use them, then measure who opens what each week. On a DTC apparel brand we rebuilt reporting for, Power BI usage rose about 35% and data errors fell about 80%. Those are the numbers to aim at moving: more people using it, fewer errors.
Go deeper: daily DTC KPIs by channel.
9. Letting the team stop trusting data after early mismatches
Early mismatches are normal, but if they go unexplained, people quietly go back to their own spreadsheets and the new system loses its momentum.
Trust is easy to lose in the first month. A dashboard says 1,318 new customers, someone's sheet says 1,180, and the meeting moves on with the sheet. Do that a few times and the team stops opening the dashboard at all.
Instead: treat every mismatch as a priority. Explain it in plain words within a day: which definition each number used, and which one is agreed. Show small wins early so the habit forms before the doubts do.
Go deeper: why your Google Sheets marketing dashboard keeps breaking and why reliable DTC reporting takes time.
10. Having no plan for keeping it running
Data systems break quietly when nobody owns them: a connector changes, a refresh fails, and the dashboard shows last week's numbers as if they were today's.
The build is heavy at the start and light after, but it's never zero. Someone has to watch the daily loads, fix what breaks and handle definition changes.
Instead: decide before launch who runs it, how failures get caught before users see them, and how much time that takes each month. That can be an in-house hire, a partner, or a mix.
Go deeper: do DTC brands still need a data engineer on staff?
What does a good first year look like?
A good first year produces one money decision made better, one set of definitions everyone uses, and dashboards people open every morning.
In practice that means a data map and agreed definitions in the first weeks, daily loads and a morning scorecard next, then the first spend test. Models and AI assistants come after, reading the same definitions. Our white paper, How to Build a DTC Data Practice in 2026, covers that order, with a definitions starter set, a data map template, and a readiness checklist.
Frequently asked questions
Who should be the first data hire at a DTC brand?
A business data engineer: someone technical enough to build and run the data system, and strong enough on the business to say what the numbers mean and what to do. A pure analyst or a pure engineer usually leaves half that job undone.
How big should a data team be for a DTC brand?
Smaller than most people expect at the start. One strong business data engineer, or a partner playing that role, can build the foundation; set your own baseline for growth based on how many decisions depend on the data.
What should a new data team build first?
Agreed definitions and a data map, then a daily scorecard tied to one money decision, such as where the next ad dollar goes. Dashboards built before definitions tend to disagree with each other.
Should we hire in-house or use a partner?
Either can work. What matters is that someone owns the definitions, the daily loads and the fixes after launch, and that they can explain the numbers to the business.
What to do next
Open the data practice launch planner to see what's done, what's next and your three first actions, and read how I'd start a data practice from zero for the technical setup. If you'd rather talk it through for your brand, book a call with me.
Part of the Ecommerce reporting guides, a reading path through related articles.
Linus Tse
Founder of Greyfield Data. Built 400+ dashboards. Certified in Sigma, Snowflake, Tableau, and Power BI.
About Linus