Marketing mix modeling for DTC brands: when is MMM worth it?
MMM fits curves through your own weekly spend history. For TV, podcasts and other no-click channels, get the facts clean, run tests, then build the model.

Written by Linus Tse, founder of Greyfield Data
· 9 min read
On this page 11 sections
Marketing mix modeling is worth it for a DTC brand once you have clean weekly history, weeks where spend on each channel actually moved, and at least one test to check the model against. Before that, a model mostly turns messy data into confident-looking curves. For TV, podcasts and other channels with no clicks, the order that works is facts, then tests, then the model.
Most of the work is the data underneath: weekly spend by channel, orders from your site and Amazon, and one agreed definition of a new customer. That is the DTC data warehouse and reporting work we do, and it's the part that decides whether any model is worth reading.
Key takeaways
- MMM (marketing mix modeling) is a statistical model fit on your own weekly history of spend and sales by channel. It plans forward from your past.
- It draws a curve through weeks you spent more or less. It can't see past spend levels you've never tried, so a channel you never changed has a guessed curve.
- Tests, such as switching TV off in some cities for a few weeks, are the closest thing to truth. The model fills in between tests and should be checked against them.
- Get the facts clean first: weekly spend for every channel, including TV and podcast files, orders on your site and Amazon, and one new-customer definition.
- MMM comes last, after clean history and at least one test. It's still just a model.
What is marketing mix modeling?
Marketing mix modeling is a statistical model that estimates how much each channel adds to sales, using your own weekly history of spend and sales. It looks at weeks when you spent more on TV, or less on Meta, and asks how sales moved in those weeks.
The output is a curve for each channel, showing what a given level of weekly spend tends to bring. Because it works from totals, not clicks, it covers TV, podcasts and radio. It is your own history used to plan forward, which is both its strength and its limit.
Why can't MMM see past what you've tried?
MMM can't see past what you've tried because a curve is only drawn where there are data points. If you've spent between $40,000 and $55,000 a month on TV for two years, the model knows something about that range. It knows almost nothing about $90,000 a month.
Beyond the highest spend you've actually run, the curve is guesswork until you test. The model still draws a line there, from the shape it was told to assume.
The same goes for a channel whose spend barely moved. Here is how confidence looks for three channels in a synthetic example, where the next $10,000 a month is the question:
| Channel | Spend/month | Next $10K/month back per $1 | How sure | Why |
|---|---|---|---|---|
| Google search | $19.3K | $0.33 | High | Spend has moved a lot, and search runs out of people searching |
| Podcast | $12.9K | $1.11 | Medium | A few months of spend changes; a 4-week push would confirm |
| TV | $49.0K | $0.89 | Low | Spend barely changed, so its curve is a guess; needs a city test |
"Back per $1" here is first-year profit per dollar of ad spend. The TV figure might be right. With spend that never moved, there's no way to tell from history alone. For more on reading these curves, see average vs marginal return on ad spend.
What does each measurement method answer?
Each method answers a different question. Attribution says who clicked, surveys say what customers remember, tests say what actually changed, and MMM says where the next dollar likely goes.
| Method | What it answers | Good for | Blind spot |
|---|---|---|---|
| Attribution | Which tracked ad a buyer touched before ordering | Comparing campaigns inside a click channel | TV, podcasts and anything without a click; channels claim the same customer |
| Post-purchase surveys | Where buyers say they heard about you | A direct signal for no-click channels | Memory is patchy, and not everyone answers |
| Tests | What changed when you switched a channel off or up | The closest thing to truth for one channel, at one spend level | Costs time and some sales; results age |
| MMM | How each channel's sales respond to spend, all at once | Planning budget across every channel, including no-click ones | Only sees spend levels you've tried; it's a model |
Attribution tools still have a place. A tool like Triple Whale can feed the warehouse as one more source, next to surveys and test results. See how to bring Triple Whale attribution into a data warehouse. None of them replaces the agreed rule for who gets credit.
Why do tests come before the model?
Tests come before the model because a test tells you what's true, and a model can only estimate it. Incrementality is the number of sales a channel actually caused, the ones that wouldn't have happened without it. A test measures it directly.
A geo holdout test is the usual one for TV. You switch TV off in some cities for a few weeks, keep it on in similar cities, and measure the drop in new customers on your site and on Amazon. The gap between the two groups is what TV was doing.
Measure Amazon, not just your site. TV often sends people to search for you on Amazon, so a site-only test can undercount it. How to apportion TV spend to Amazon CAC shows how to turn that split into a fair cost per new customer for each channel.
What should you have in place before MMM?
Before MMM, you need clean history, real variation and a test to check against. Here is the readiness checklist we use:
| What you need | Why it matters | How to check |
|---|---|---|
| Clean weekly spend by channel, TV and podcast files included | The model can only credit spend it can see, on the week it ran | Every channel has a number for every week, from the invoice or media plan, not a monthly lump |
| Orders on your site and on Amazon | TV and podcasts move both; a site-only model misses part of the effect | Weekly orders from both, on the same week definition |
| An agreed new-customer definition | The model's target has to mean the same thing every week | One written rule, such as first order ever, anywhere, with an owner |
| Weeks where spend actually varied | A curve needs points at different spend levels | Each channel has a real range of weekly spend, not a flat line |
| At least one test to check against | A model with nothing to check against is just a story | A geo holdout or spend test whose result the model should roughly match |
Write the definitions down before any modeling starts. Why AI gives different answers to the same metric question shows what happens to a "new customer" count when three teams each use their own.
If you can't tick all five, the model isn't the next step. The data is.
What is the right order: facts, tests, then the model?
The right order is facts first, then tests, then the model, because each step depends on the one before it. A test needs clean facts to measure against. A model needs both clean facts and tests to be worth trusting.
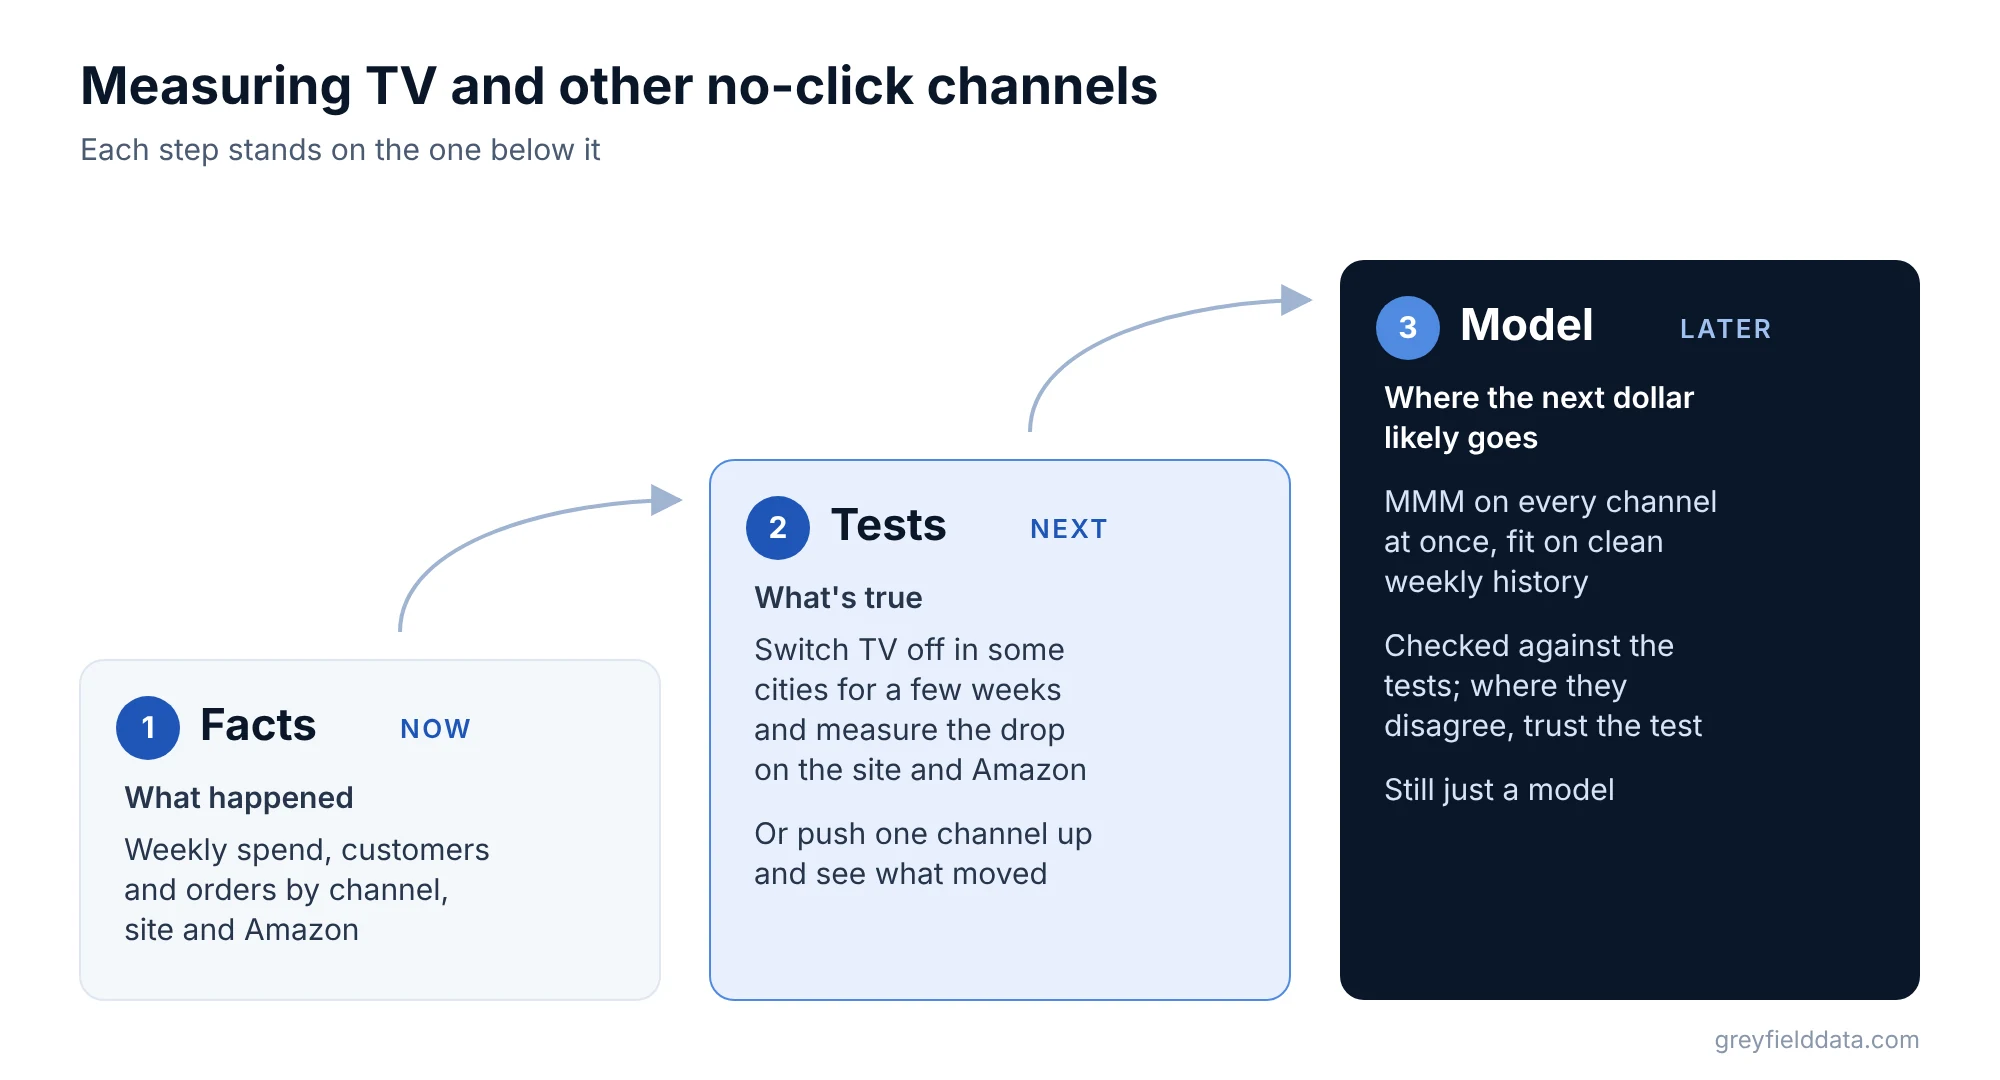
Step 1, now: learn from the weeks you already have
Your past weeks already hold some answers. Weeks where you spent more or less on a channel show where its curve starts to bend. Line up weekly spend and weekly new customers by channel, and you'll often see which channels have room and which are flat.
Step 2, next: run spend tests
Pick the channel you're least sure about and the one with the most money at stake. For TV, run a geo holdout. For a channel that looks underfunded, run a 4-week push. Each test answers one question for certain.
Step 3, later: MMM on every channel at once
Once history is clean and you have tests to check against, fit an MMM on every channel at once. Check its answers against your tests. Where it disagrees with a test, trust the test and find out why.
It's still just a model. Re-fit it as new weeks come in, and re-test when spend, creative or the channel mix changes enough to move the answer.
Which MMM tools can a DTC brand use?
There are free, open-source MMM tools from the big ad platforms, and many paid ones. Two well-known open-source options are Google's Meridian and Meta's Robyn.
Both are code libraries, not dashboards. Someone on your side needs to be comfortable with code and statistics to run them, and to explain the results to a CFO in plain words.
The tool matters less than what goes in. Fit on patchy data with no tests, either one gives confident curves with nothing behind them.
How much can a better budget split be worth?
Moving even a small share of budget to where the next dollar works harder can be worth a lot. This is an illustration, not a client result.
Say a $50M DTC brand spends $12.5M a year on ads. If 10% of that, $1.25M, sits in a channel where the next dollar brings back $0.33, and could move to one bringing back $1.11, the difference is $0.78 × $1.25M. That is about $975K more first-year profit a year.
The real gain would be lower, because returns fall as you add spend. The point is the order of magnitude, and you only get it if the curves are right.
Frequently asked questions
Is MMM worth it for a small DTC brand?
Often not yet. If you spend on only two or three click-based channels, attribution plus a couple of spend tests may answer your questions. MMM earns its place when TV, podcasts or other no-click channels are a real share of spend and your weekly history is clean.
What is the difference between MMM and incrementality testing?
An incrementality test measures what one channel caused, at one spend level, over a few weeks. MMM estimates every channel's effect at once from your weekly history. Tests tell you what's true; the model fills in between them and should be checked against them.
How do you measure TV advertising for a DTC brand?
Combine three sources. Track spend by week from the media plan, read post-purchase survey answers and TV codes, and run a geo holdout that switches TV off in some cities. Measure the drop on both your site and Amazon.
What is a geo holdout test?
A geo holdout test switches a channel off in some regions and keeps it on in similar ones, for a few weeks. The difference in sales or new customers between the two groups shows what the channel was adding.
How much history do you need for MMM?
There's no fixed rule, so set your own baseline. What matters more than the number of weeks is that spend on each channel actually varied, and that the history is clean and uses one definition of a new customer.
What to do next
Run your channels through the readiness checklist above. If weekly spend for TV and podcasts lives in invoices and spreadsheets, start there: that's the facts step. For the bigger picture of definitions, data and dashboards, read the white paper on how to build a DTC data practice, or book a call and we'll look at which step you're on.
Part of the Ecommerce reporting guides, a reading path through related articles.
Linus Tse
Founder of Greyfield Data. Built 400+ dashboards. Certified in Sigma, Snowflake, Tableau, and Power BI.
About Linus