Average vs marginal return on ad spend: where does the next dollar go?
A channel's average return says it works. The next $10K can return far less, because channels saturate. How to estimate marginal return and split budget.

Written by Linus Tse, founder of Greyfield Data
· 9 min read
On this page 11 sections
The next dollar should go to the channel where the next dollar brings back the most, not the channel with the best average. Average return on ad spend tells you a channel has worked so far. Marginal return tells you what one more chunk of spend will bring, and channels saturate: search runs out of people searching.
We build these numbers into the DTC data warehouses and dashboards we set up for brands, with ad spend, new customers and first-year profit by channel in one place. The method below works on any clean history of weekly spend and customers.
Key takeaways
- Average return is everything a channel has brought back divided by everything you spent. Marginal return is what the next chunk of spend brings back.
- A channel can have the best average and one of the worst marginal returns, because the cheapest customers in it are already won.
- Past the highest spend you have actually run in a channel, its curve is guesswork until you test it.
- How sure you can be depends on how much spend in that channel has moved in the past. A channel you never changed can't show its curve.
- Split extra budget $5K at a time, each chunk to whichever channel's next $5K brings back the most, then recompute.
What is the difference between average and marginal return on ad spend?
Average return divides everything a channel has brought back by everything you spent on it. Marginal return divides what the next chunk of spend brings back by the size of that chunk. One describes the past; the other prices the next decision.
Here "return" means first-year profit, not revenue. We use "$ back per $1": the profit a channel's new customers produce in their first 12 months for each $1 of ad spend. That is the same number as LTV:CAC, where LTV (lifetime value) is first-year profit per customer and CAC (customer acquisition cost) is ad spend per new customer. The LTV:CAC math, step by step shows how each piece is built.
Platform ROAS (revenue divided by ad spend, as each platform reports it) is a different number: it counts revenue, and each platform credits itself. For blended, attributed, incremental and marginal CAC side by side, see the four CAC types.
Why does the next $10K bring back less than the average?
Because channels saturate. The first dollars in a channel reach the people most ready to buy, and each extra dollar reaches people who are a little less ready, or the same people again.
Search is the clearest case. Only so many people search for what you sell each month, so more budget buys higher bids on the same searches, not new searchers. Social and video saturate more slowly.
Plot new customers against monthly spend and you get a curve that rises fast, then flattens.
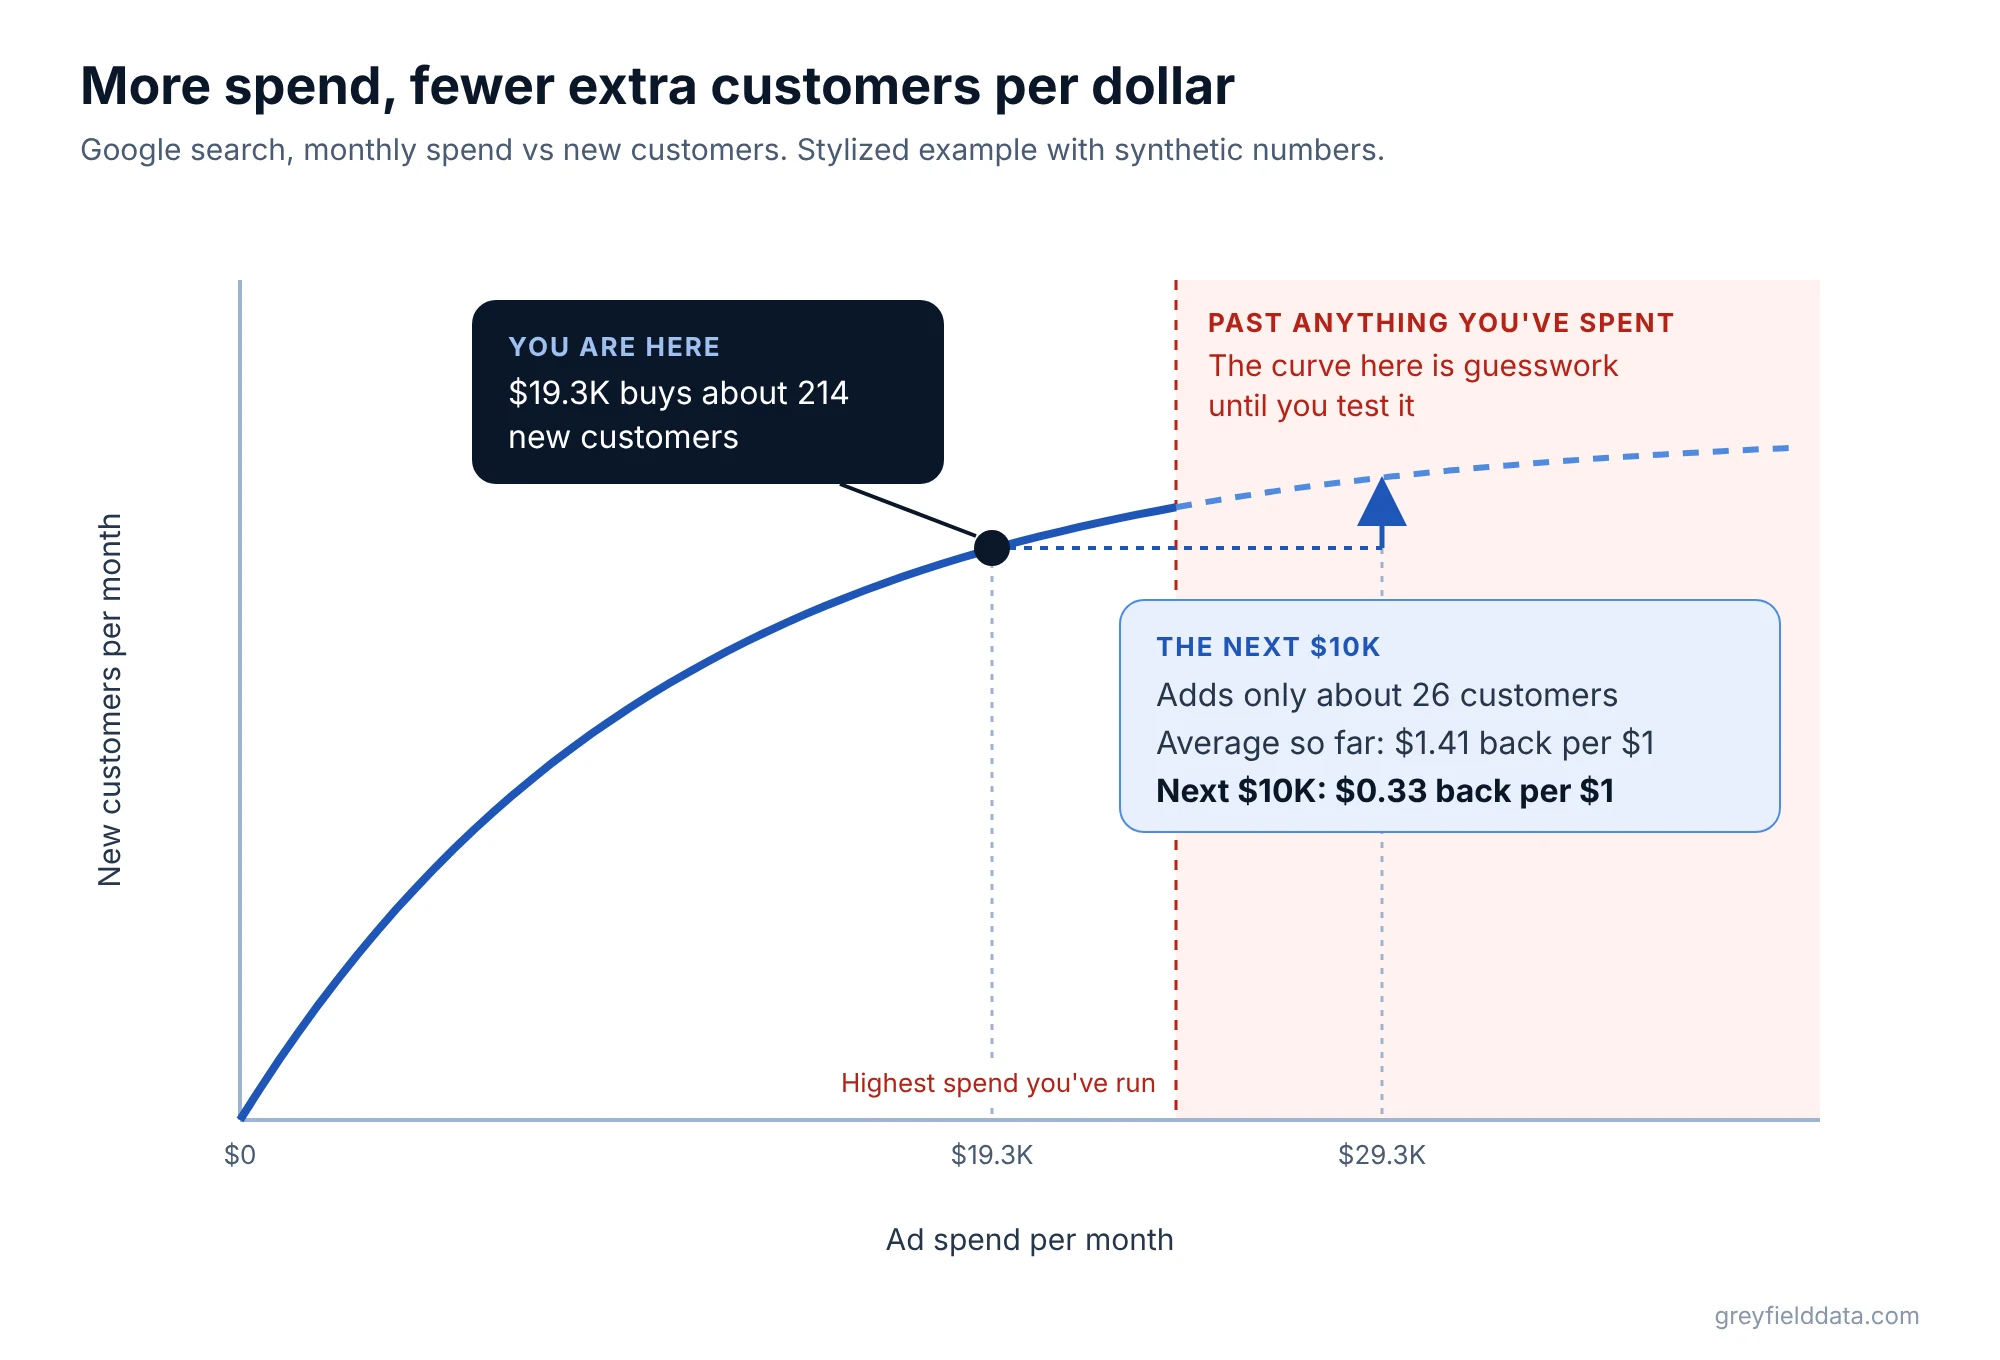
In this example (synthetic numbers), Google search at $19.3K a month buys about 214 new customers. Its average return is $1.41 back per $1. But the next $10K a month adds only about 26 customers, so it brings back about $0.33 per $1.
A worked example: seven channels, two rankings
Say a DTC subscription brand sells on its own site and on Amazon, and runs seven paid channels. These numbers are synthetic, from a mockup. They show the shape of the problem, not a benchmark.
| Channel | Spend per month | Average back per $1 so far | Next $10K back per $1 | Extra customers from next $10K | How sure |
|---|---|---|---|---|---|
| Google search | $19.3K | $1.41 | $0.33 | about 26 | High: spend has moved a lot, and search runs out of people searching |
| Podcast | $12.9K | $1.27 | $1.11 | about 88 | Medium: a few months of spend changes; a 4-week push would confirm |
| Amazon ads | $15.0K | $1.13 | $0.40 | about 67 | Medium: sponsored ads mostly catch people already searching for you |
| TV | $49.0K | $1.13 | $0.89 | about 95 | Low: spend barely changed, so its curve is a guess; needs a city test |
| Meta | $60.0K | $1.09 | $0.44 | about 39 | High: biggest channel, lots of spend history |
| YouTube | $10.8K | $0.86 | $0.71 | about 76 | Low: small steady spend, not enough history |
| TikTok | $8.6K | $0.86 | $0.65 | about 65 | Low: small steady spend |
Sort by the average column and Google search wins at $1.41. Sort by the next-$10K column and Google drops to last, at $0.33. Podcast moves to the top at $1.11.
So "Google is our best channel" and "Google is the worst place for the next $10K" are both true.
What about channels below $1?
Below $1 in year one does not mean a channel loses money. Customers keep buying after their first year, so a channel at $0.71 can still pay off over three years. Check its payback month: the month that channel's customers have earned back what they cost. The contribution margin LTV by channel post shows how to track that by cohort.
How much is the gap worth?
An illustration, not a client result. Take a $50M DTC brand spending $12.5M a year on ads. If 10% of that, $1.25M, sits in a channel where the next dollar brings back $0.33, and could move to one bringing back $1.11, the difference is $0.78 × $1.25M, about $975K more first-year profit a year.
The real gain would be lower. Returns fall as you add spend to the better channel too, so its $1.11 would not hold for the full $1.25M. The point is the order of magnitude: moving budget on the marginal view can matter more than most single campaign tweaks.
Why is the curve guesswork past anything you've spent?
Because nothing in your history shows what happens there. A curve is drawn through weeks you spent more or less. If your highest month in a channel was $24K, any estimate for $40K is a line extended into empty space.
That is the shaded zone in the chart. Treat any number from that zone as a hypothesis. The way to make it real is to spend there for a few weeks and measure.
How sure can you be about each channel's next dollar?
It depends on how much spend in that channel has moved in the past. A channel you have run at many different levels shows where its curve bends. A channel you have held flat shows one point, and one point has no shape.
That is why the "how sure" column matters as much as the numbers. Meta and Google search have lots of history at different spend levels. TV, YouTube and TikTok have barely moved, so their curves are guesses.
TV's $0.89 looks attractive, but it is the least certain number on the page. TV has no clicks, so its customers are estimated from post-purchase survey answers, TV discount codes and city tests. Before you move money into TV on a low-confidence estimate, run a city test: switch TV off in some cities for a few weeks and measure the drop on your site and on Amazon. The TV spend and Amazon CAC post covers how to split that cost.
How should you split extra budget across channels?
Hand it out $5K at a time. Give each $5K to whichever channel's next $5K brings back the most, recompute that channel's next-$5K return, and repeat until the budget is gone.
- Rank the next $5K. Starting from today's spend, estimate what each channel's next $5K brings back per $1.
- Give $5K to the top channel. In the example, that is podcast at about $1.11.
- Recompute that channel. Its next $5K starts higher on its curve, so it brings back a little less.
- Repeat. Stop when the budget runs out or every channel's next $5K falls below your target.
Compare the result with the usual move, which is putting it all into the biggest channel. In the example, that is Meta, whose next $10K brings back $0.44. In the example model, the step-by-step split puts an extra $30K a month mostly into podcast, with the last $5K going to TV, because podcast's next dollar stays above everyone else's for several steps.
Two rules keep this honest. Don't hand money into the guesswork zone without a test attached. And weight low-confidence channels down: a $0.89 you are unsure of is not the same as a $0.89 you have measured.
How do you get sharper estimates over time?
Work in three steps, in order. Each one makes the next more reliable.
| Step | What you use | What it tells you | Limits |
|---|---|---|---|
| Now | Your past weeks of spend and new customers by channel | Weeks you spent more or less show where the curve bends | Only works for channels whose spend has moved |
| Next | Spend tests: push one channel up for a few weeks and measure what moved | What is true for that channel at that spend level | One channel at a time; takes weeks |
| Later | MMM on every channel at once, on clean data, checked against tests | Where the next dollar likely goes across all channels | Still just a model; only forecasts spend levels you have tried |
MMM means marketing mix modeling: a statistical model fit on your own weekly history of spend and sales by channel. It draws a curve through weeks you spent more or less, so it can only forecast spend levels you have actually tried. Tests tell you what is true; the model fills in between them and should be checked against the tests. The MMM for DTC brands post goes further.
Most of the work in all three steps is the data underneath. You need ad spend by day and channel, TV and podcasts included, new customers counted once across your site and Amazon, and one agreed rule for which channel gets credit. Without that, every curve inherits the mess. The ways to avoid double counting Shopify, Amazon and TikTok orders are a good place to start.
Frequently asked questions
What is marginal ROAS?
Marginal ROAS is the return from the next chunk of ad spend, divided by the size of that chunk. Average ROAS divides all return by all spend. Marginal ROAS is the one to use when deciding where extra budget goes, ideally measured as profit rather than revenue.
Is a channel with the best average return the best place for more budget?
Not necessarily. In the example, Google search had the best average at $1.41 back per $1, but its next $10K brought back only $0.33. The best average often belongs to the channel that has already used up its cheapest customers.
Can you estimate marginal return without a marketing mix model?
Yes. Start with your own past weeks of spend and new customers by channel, then run spend tests on the channels you are least sure of. MMM comes later, once the data underneath is clean, and it should be checked against those tests.
What is a good marginal return on ad spend?
There is no universal benchmark. Set your own target from your margin, how long you can wait to be paid back, and your cash needs. Then compare each channel's next-dollar return against that target and against the other channels.
What to do next
Pull your last year of weekly spend and new customers by channel, and mark which channels have moved enough to show a curve. Pick the channel you are least sure of and plan a 4-week spend test.
If spend, customers and profit don't yet live in one place you trust, the DTC data warehouse service is how we set that up, or book a call to talk through your channels.
Part of the Ecommerce reporting guides, a reading path through related articles.
Linus Tse
Founder of Greyfield Data. Built 400+ dashboards. Certified in Sigma, Snowflake, Tableau, and Power BI.
About Linus