10 data mistakes DTC brands make (and how to fix each one)
The 10 data mistakes we see most in DTC brands, from average ROAS and cheap Amazon CAC to revenue LTV and clashing definitions, with why each hurts and the fix.

Written by Linus Tse, founder of Greyfield Data
· 12 min read
On this page 15 sections
The most expensive data mistakes DTC brands make are rarely broken reports. They are quiet ones that waste ad spend or team time: judging a channel by its average, quoting revenue as if it were profit, and letting each team rebuild the same numbers its own way. Each one costs money or hours while every dashboard looks fine.
We see all ten in the dashboards we build for DTC brands. Our DTC data warehouse and reporting service fixes most of them at the root: one place for spend and orders, one set of definitions, and dashboards people open. For a quick read on your own setup, take the DTC data stack quiz.
Key takeaways
- Judge each channel by what its next dollar brings back, not its average. In our synthetic example, Google search averages $1.41 back per $1 while its next $10K brings back $0.33.
- Amazon CAC built only on sponsored ads reads low whenever TV drives people to search Amazon. Give Amazon its agreed share of TV spend.
- Credit reported by each ad platform overlaps, so it adds up to more customers than you have. Apply one written credit rule instead.
- Every team defining metrics its own way costs hours of reconciling each week. Write each definition once, with an owner and a version.
- Build LTV on profit customers have actually paid you, and label any forecast as a forecast.
The 10 mistakes at a glance
Every figure in this post is synthetic example data from a mockup, not a client result or an industry benchmark. Where you need a target, set your own baseline.
| # | Mistake | What it costs you | Fix |
|---|---|---|---|
| 1 | Judging a channel by its average return | Budget keeps flowing to channels that are full | Rank channels by the next dollar's return |
| 2 | Trusting a cheap Amazon CAC | Amazon gets credit TV earned | Add Amazon's agreed share of TV spend |
| 3 | Adding up platform-reported credit | Every channel looks cheaper than it is | One written credit rule |
| 4 | Treating TV as unmeasurable | TV is cut or kept on gut feel | Run a city test |
| 5 | Running MMM before clean history or tests | Confident curves nobody can check | Facts, then tests, then the model |
| 6 | Letting each team define metrics its own way | Meetings spent arguing about whose number is right | One definition, an owner, a version |
| 7 | Measuring LTV in revenue | LTV:CAC looks healthier than it is | Profit LTV after cost of goods |
| 8 | Presenting projected LTV as realized | Budget set on hope | Label realized and forecast separately |
| 9 | Running the business from Google Sheets | Stale, broken numbers | Load one central database every morning |
| 10 | Building dashboards nobody opens | Money spent on reports that change nothing | Build for a daily habit and measure usage |
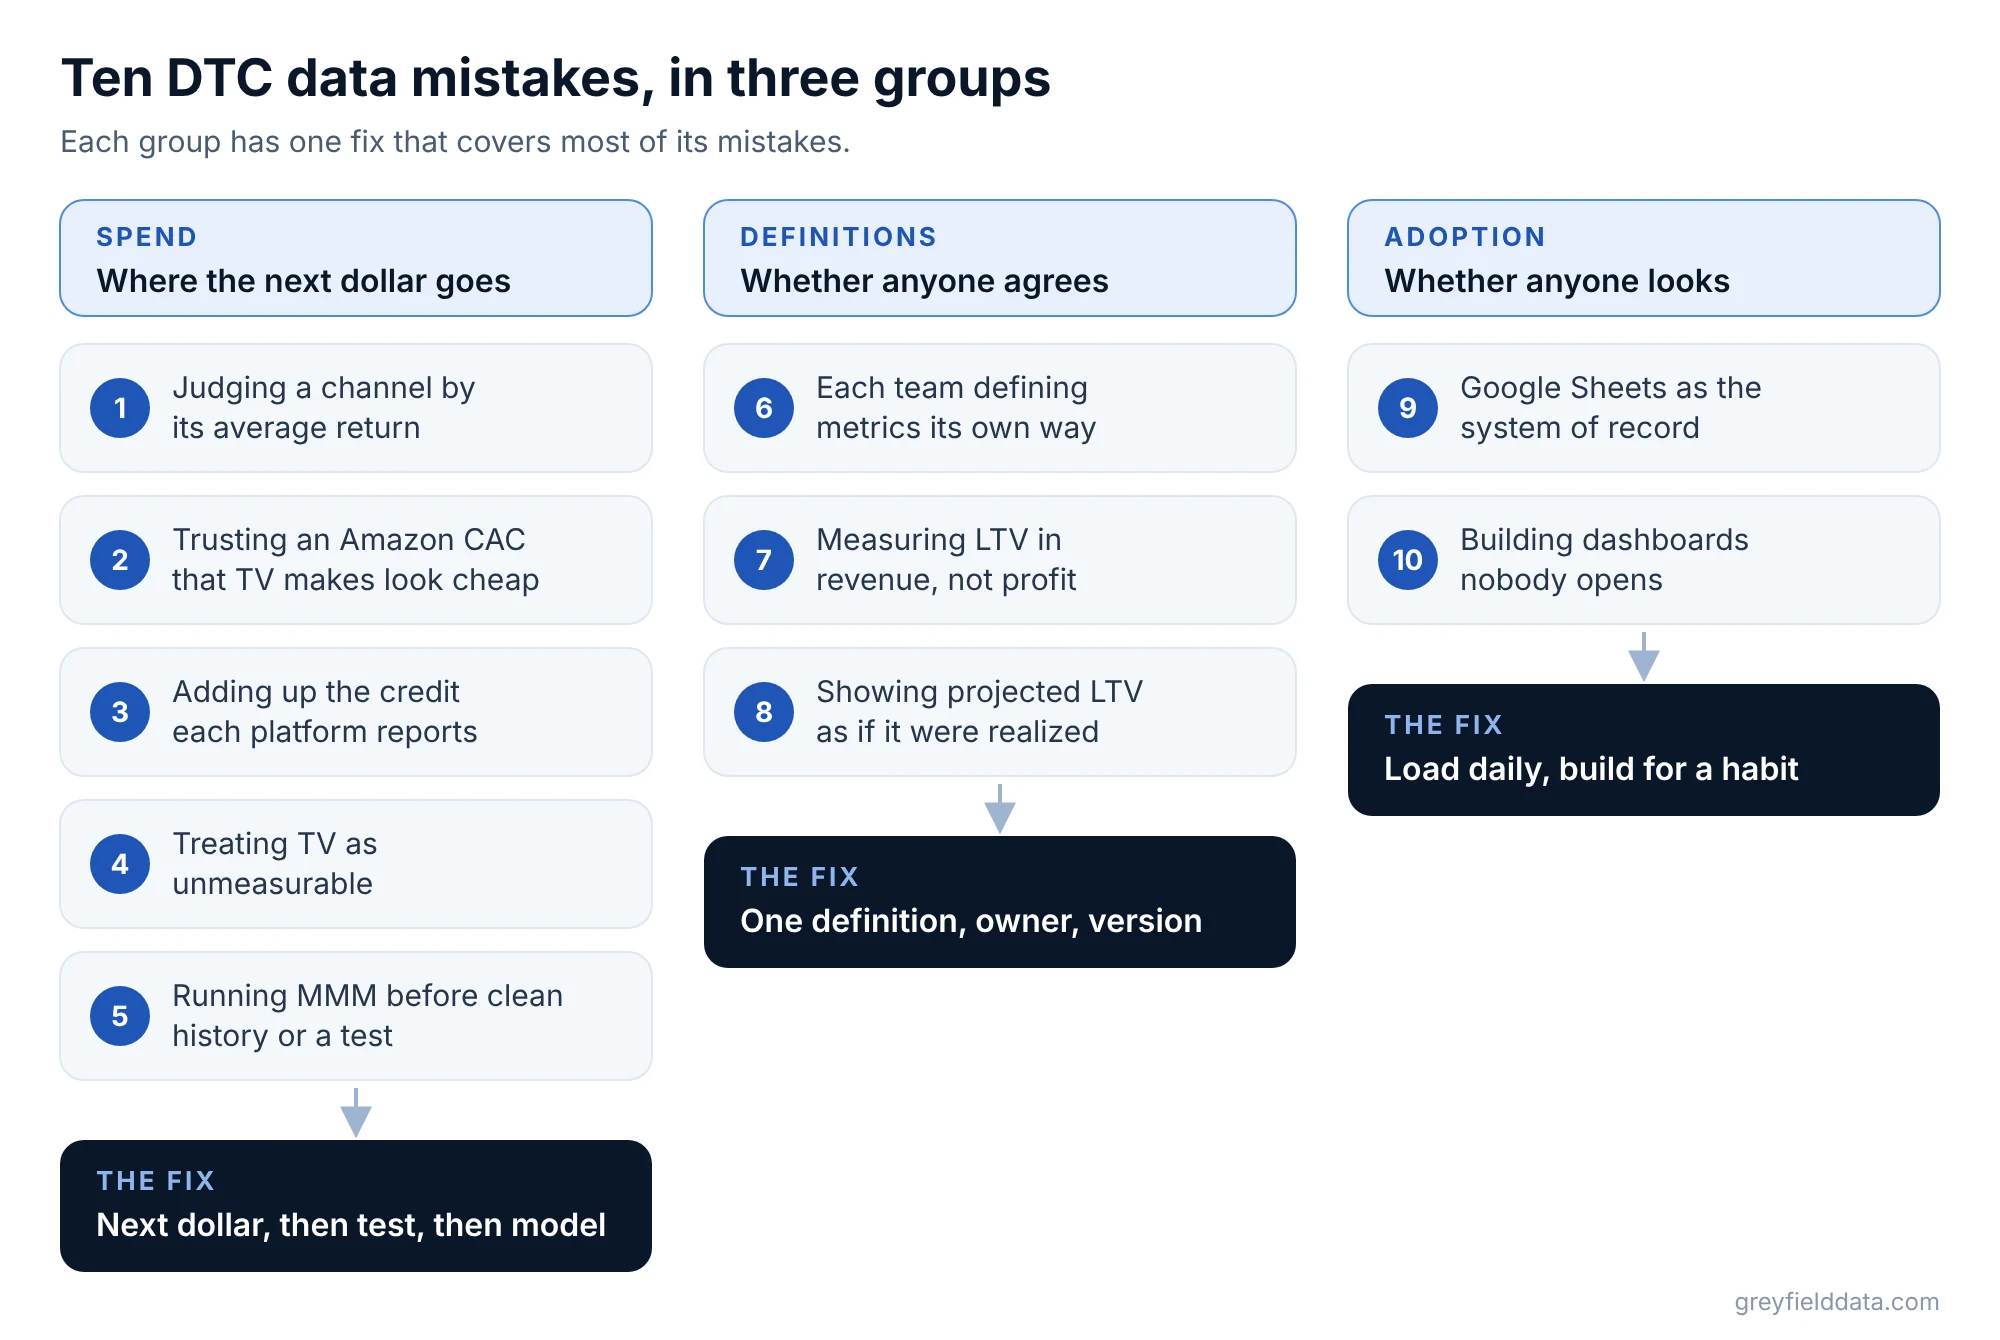
The ten fall into three groups. Spend mistakes decide where the next dollar goes. Definition mistakes decide whether anyone agrees on the numbers. Adoption mistakes decide whether anyone looks.
1. Judging a channel by its average return instead of its next dollar
An average tells you how a channel did on all the money you've spent, not what the next dollar will buy, so you keep funding channels that have run out of room.
Say a brand measures "$ back per $1" as first-year profit per ad dollar. In this synthetic example, Google search averages $1.41 back per $1 so far. Its next $10K a month brings back about $0.33, because search runs out of people searching. Podcast averages less, $1.27, yet its next $10K brings back about $1.11.
Fix: estimate each channel's next-dollar return from weeks you spent more or less. Hand out extra budget $5K at a time, each step to whichever channel's next $5K brings back the most, then recompute. Note how sure each estimate is: a channel whose spend never moved can't show its curve.
Go deeper: average vs marginal return on ad spend and blended, attributed, incremental and marginal CAC.
2. Trusting an Amazon CAC that looks cheap because TV does the work
If Amazon CAC counts only sponsored ads, shoppers who saw TV and then searched Amazon arrive with no cost attached, so Amazon looks like the best home for every extra dollar.
CAC is customer acquisition cost: ad spend divided by new customers. The TV spot's cost sits in the DTC row or a brand line, while Amazon collects the customers.
Fix: agree what share of TV spend Amazon gets, add it to Amazon's ad spend, then divide by new-to-brand Amazon customers. Amazon doesn't share customer IDs with you, so count Amazon's new customers from its new-to-brand order counts. Blended CAC stays the same; you're moving cost between rows, not creating it.
Go deeper: how to apportion TV spend to Amazon CAC, or move the TV share yourself in the CAC apportionment demo.
3. Adding up the credit each ad platform reports
Every platform claims the customers it touched, so the totals add up to more customers than you got, and every channel looks cheaper than it is.
In the synthetic example, pixel credit says 1,655 new customers last week, because a customer who clicked two ads counts twice. The agreed definition, first order ever anywhere, says 1,318. Meta's own credit puts its cost per new customer at $71. Under the agreed credit rule it's $105.
Fix: keep platform numbers as one input, beside orders, discount codes and post-purchase survey answers. Then apply one written credit rule, for example survey answer first, then discount code, then last click. An attribution tool can feed your warehouse as one more source, but it doesn't replace the agreed rule.
Go deeper: should Triple Whale attribution feed your data warehouse? and how to avoid double-counting Shopify, Amazon and TikTok orders.
4. Treating TV as unmeasurable
When TV can't be measured, it gets cut on gut feel or protected on faith, and you can't weigh it against digital channels.
TV has no clicks, but it isn't a black box. TV customers can be estimated from post-purchase survey answers, TV discount codes and city tests.
Fix: work in three steps. Facts: record TV spend on the day it ran, next to customers and orders. Tests: run a geo test, which means switching TV off in some cities for a few weeks and measuring the drop on your site and on Amazon. That drop is TV's incrementality, the customers it caused who wouldn't have come anyway. Model: only then use a model to fill the gaps between tests.
Go deeper: marketing mix modeling for DTC brands, which walks through facts, tests, then the model.
5. Running MMM before you have clean history or a single test
A model fit on messy or flat spend history draws confident curves for spend levels you never tried, and nobody can check them.
MMM is marketing mix modeling: a statistical model fit on your own weekly history of spend and sales by channel. It draws a curve through weeks you spent more or less, so it can only forecast spend levels you've tried. In the synthetic example, TV spend barely changed, so the model's TV curve is a guess.
Fix: get clean weekly history first, since most of the work is the messy data underneath. Then run spend tests: push one channel up for a few weeks and measure what moved. Then fit MMM on every channel at once and check it against the tests. It's still just a model.
Go deeper: marketing mix modeling for DTC brands and why reliable DTC reporting takes time.
6. Letting every team define conversion rate and new customer its own way
When Growth, Ops and Finance each compute a metric differently, the weekly meeting becomes an argument about whose number is right, and AI assistants repeat whichever version they read.
Here is one question asked three ways in the synthetic example: "What was our conversion rate last week?"
| Who asked | Source | Answer | Why it differs |
|---|---|---|---|
| Growth, via an AI assistant | Google Analytics | 2.1% | Misses orders from people who block tracking |
| Ops | Shopify order export | 4.8% | Counts subscription renewals that never visited the site |
| Finance | Monday spreadsheet | 3.2% | Uses unique visitors, not sessions, from a sheet last updated Thursday |
| Agreed definition | Conversion Rate v1 | 2.7% | Website orders ÷ website sessions, renewals left out, Amazon tracked on its own |
None of the three is lying. Each used a different rule. Renewals are the easiest one to miss: a subscription order that ships on its own is revenue, not a site conversion.
Fix: write one definition per metric, give it an owner and a version number, and make every number say which version it used. When a definition changes, someone asks, the owner agrees, and the new version goes live everywhere at once: dashboards, the AI assistant, the email tool and spreadsheets. You'd never let three people book revenue three different ways; a chart of accounts fixes that for the books, and definitions do the same for marketing numbers.
The place those definitions live is a semantic layer: one shared list of metric definitions that every tool reads from.
Go deeper: why AI gives different answers to metric questions and what is a semantic layer?
7. Measuring LTV in revenue instead of profit
Revenue LTV ignores cost of goods, shipping and fees, so every channel's LTV:CAC looks healthier than it is.
LTV is lifetime value; here it means what a customer is worth in their first 12 months. LTV:CAC is LTV divided by CAC. In the synthetic example, Google's CAC is $19,300 ÷ 214 new customers = $90. Each customer spends $231 in their first year. On revenue, LTV:CAC is $231 ÷ $90 = 2.57. On profit, $231 × 55% margin = $127, and $127 ÷ $90 = 1.41.
Both numbers clear 1.0 here. For a channel closer to the line, revenue LTV can make a money-losing channel look like a winner.
Fix: define LTV as profit from a customer in their first 12 months, after cost of goods, shipping and fees. Above 1.0 means that channel's customers paid for themselves within a year. Below 1.0 in year one can still pay off over three years, so also track payback month: the month a channel's customers have earned back what they cost.
Go deeper: how to calculate LTV:CAC by channel and contribution margin LTV by acquisition channel.
8. Presenting projected LTV as if it were realized
A forecast LTV shown beside realized numbers gets read as money already collected, and budget gets set on hope.
Realized LTV is what customers won 12 to 15 months ago actually spent in their first year. Projected LTV is a forecast for customers won recently. Both are useful, but they answer different questions.
Fix: keep them as two named metrics. Label the forecast, date it and write down its assumptions. Decide CAC limits on the number built for deciding, and report on the number built for the books.
Go deeper: underwriting CLTV vs GAAP CLTV shows the same split between a number for decisions and a number for reporting. For a read on new customers before a year has passed, see early indicators of cohort quality by channel.
9. Running the business from Google Sheets
A spreadsheet as the system of record breaks when a connector changes or someone edits a range, and its numbers go stale between manual updates.
Finance's 3.2% conversion rate in mistake 6 came from a sheet last updated Thursday. Nothing was wrong with the formula. The data was four days old.
Fix: load spend, orders and customers into one central database every morning, with the agreed definitions applied there. Keep Sheets for exploring, reading from that database rather than acting as the source.
Go deeper: why your Google Sheets marketing dashboard keeps breaking and how to track customers across platforms.
10. Building dashboards nobody opens
A dashboard nobody opens changes no decisions, so the money spent building it returns nothing.
Building is the easy part. Adoption is the job.
Fix: design around a daily habit. Start with a morning check-in: how yesterday went and what moved. Add a "did we beat yesterday?" view, on-pace bars for the month against goal, and metric cards you tap to add or remove a line on the chart. Small streaks help, such as days in a row under the CAC target. Then measure who opens it each week and fix what people skip.
On a DTC apparel brand we rebuilt reporting for, Power BI usage rose about 35% and data errors fell about 80%.
Go deeper: daily DTC KPIs by channel, which covers what belongs in the morning scorecard.
Which mistake should you fix first?
Fix definitions and clean daily data first, because every spend decision sits on top of them. A next-dollar estimate built on three conversion rates is three estimates.
Then fix the spend mistakes in order: average vs next dollar, Amazon's share of TV, one credit rule, a TV city test, and only then a model. Work on adoption the whole way through, since a fix nobody sees changes nothing. Our white paper on how to build a DTC data practice lays out that order in more detail.
Frequently asked questions
What is the most common data mistake DTC brands make?
Letting each team define key metrics its own way. Conversion rate, new customer and CAC then come out differently in every tool, and every later decision inherits the disagreement.
Why do Google Analytics, Shopify and our spreadsheet show different conversion rates?
Each uses a different rule. Google Analytics misses orders from people who block tracking, a Shopify order export can include subscription renewals, and a spreadsheet may divide by visitors instead of sessions or be days out of date.
Should a DTC brand start with marketing mix modeling?
Not first. MMM can only forecast spend levels you've tried, so it needs clean weekly history and should be checked against spend tests or city tests before you trust it.
Is platform-reported ROAS useless?
No, but it's one input, not the answer. ROAS, or return on ad spend, as reported by each platform overlaps with other platforms' credit, so keep it beside orders, discount codes and survey answers and apply one agreed credit rule.
What does "next dollar" return mean?
It's what the next block of spend, such as the next $10K a month, would bring back in first-year profit. It usually falls as spend rises, so it's often well below the channel's average.
What to do next
Pick the two mistakes on this list that sound most like your last weekly meeting, and check them against your own numbers. If you want to see where your setup stands overall, take the DTC data stack quiz. If you'd like help fixing the definitions and spend view on your own data, book a call with me.
Part of the Ecommerce reporting guides, a reading path through related articles.
Linus Tse
Founder of Greyfield Data. Built 400+ dashboards. Certified in Sigma, Snowflake, Tableau, and Power BI.
About Linus