Why does AI give three different answers to the same metric question?
GA4, Shopify and a spreadsheet each count conversion rate differently, so an AI assistant gives a different answer from each. One agreed definition fixes it.

Written by Linus Tse, founder of Greyfield Data
· 9 min read
On this page 11 sections
An AI assistant gives three different answers to the same metric question because each person points it at a different source, and each source defines the metric its own way. The assistant isn't making a mistake. It's answering faithfully from a different rulebook each time, and nobody has written down which rulebook counts.
The cost is time: every disagreement turns into a meeting about whose number is right, instead of a decision. The fix is one written definition per metric, with an owner and a version number, that every tool reads, the AI assistant included. We set that up as part of the DTC data warehouse and reporting work we do, so teams stop redoing the same numbers. For the hours this costs, see how much time your team loses to reporting.
Key takeaways
- GA4, a Shopify order export and a team spreadsheet each count conversion rate differently, so an AI assistant reading each one returns a different number from the same week.
- The numbers aren't random. Each one is a different definition: what counts as an order, what counts as a visit, and how fresh the data is.
- One written definition per metric, with an owner and a version, gives one answer no matter who asks or which tool they use.
- A definition change goes live everywhere at once, and every number says which version it used.
- It works like a chart of accounts: nobody books revenue three ways, and nobody should count new customers three ways either.
Why does the same question get three answers?
The same question gets three answers because the AI assistant only knows what the source in front of it knows. Ask it about conversion rate while it reads Google Analytics, and it divides analytics purchases by analytics sessions. Ask it while it reads a Shopify export, and it divides orders by sessions, counting every order in the file.
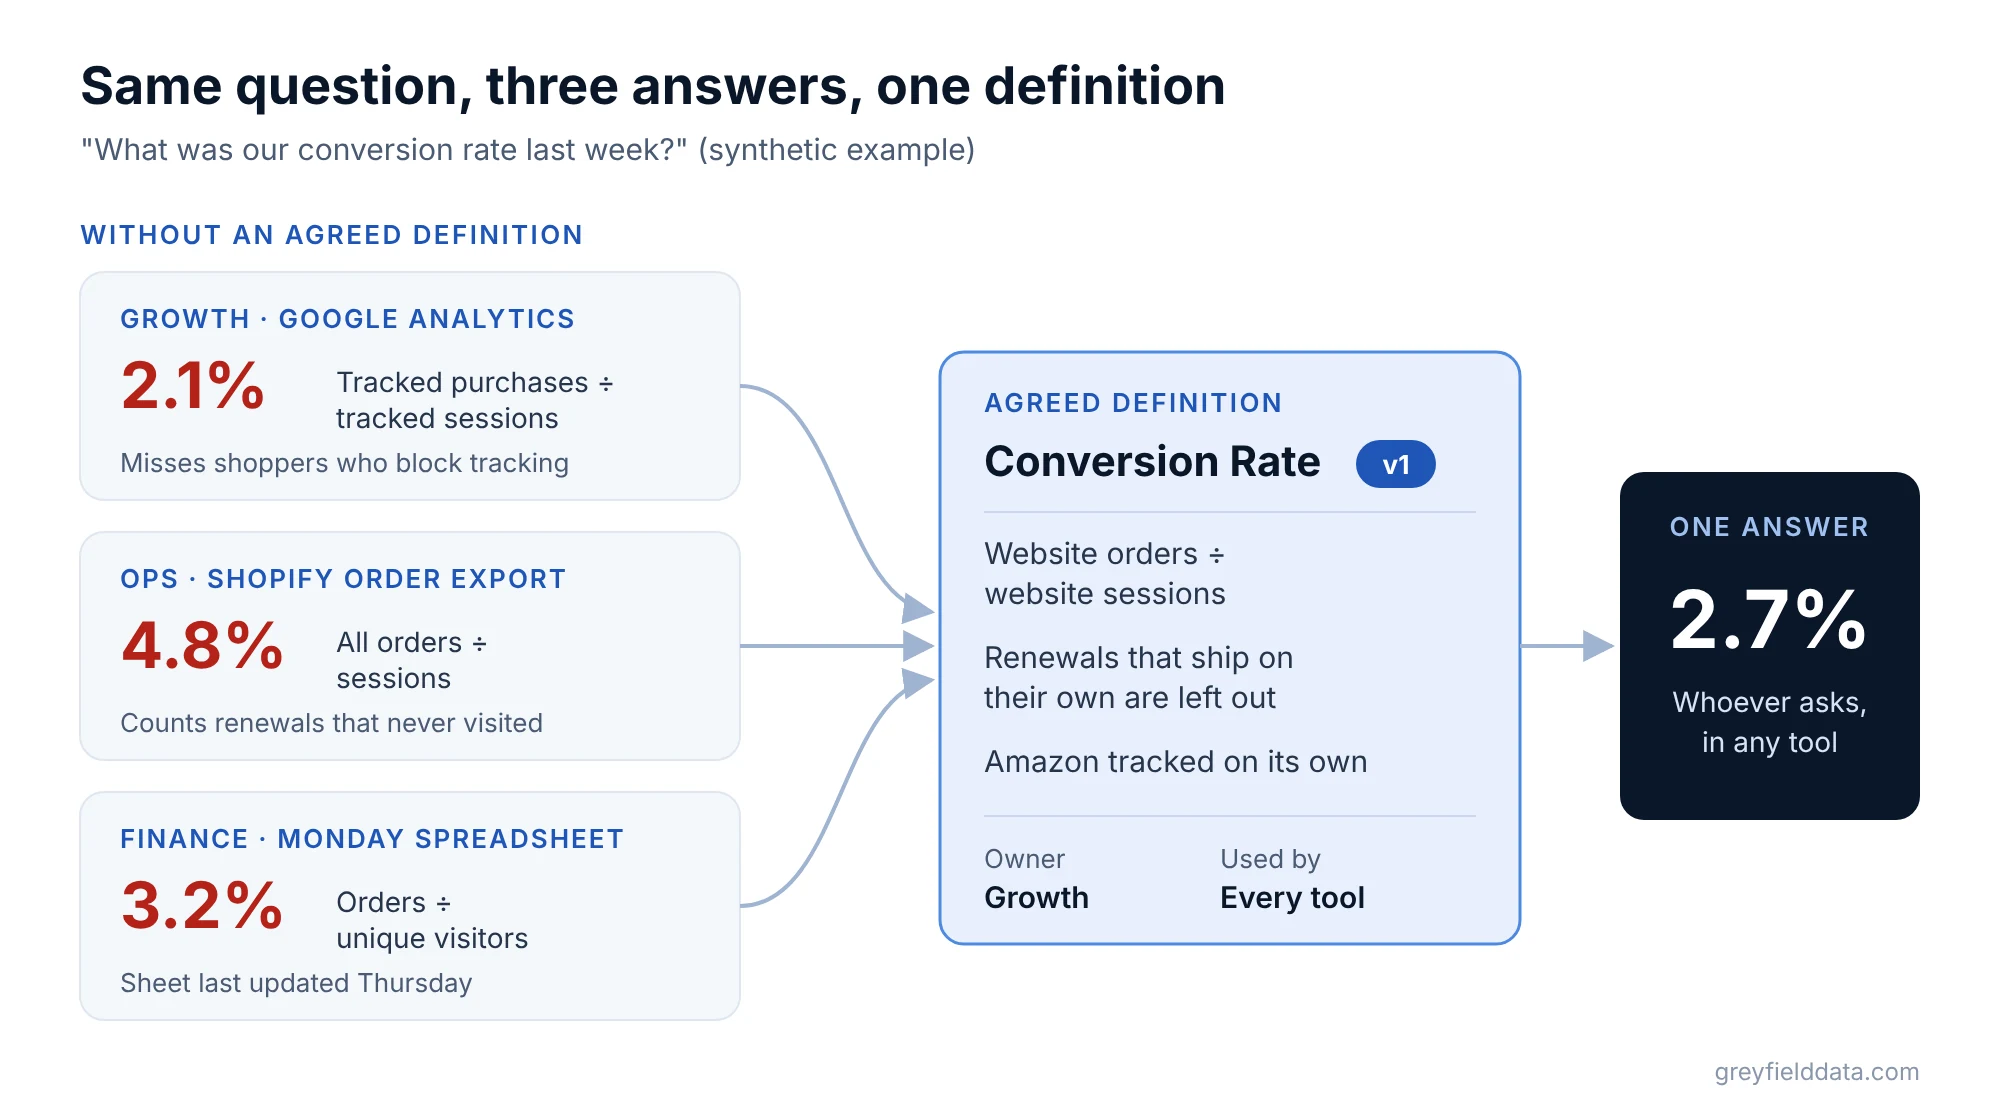
Here is a worked example with synthetic numbers. Say a DTC subscription brand selling on its own site and on Amazon has three people ask an AI assistant, "What was our conversion rate last week?"
| Who asks | Source the AI reads | Answer | Why it differs |
|---|---|---|---|
| Growth | Google Analytics | 2.1% | Analytics purchases ÷ analytics sessions. Misses orders from people who block tracking. |
| Ops | Shopify order export | 4.8% | All orders ÷ sessions. Counts subscription renewals that never visited the site. |
| Finance | The Monday spreadsheet | 3.2% | Orders ÷ unique visitors, not sessions, from a sheet last updated Thursday. |
| Agreed definition | Conversion Rate v1 | 2.7% | Website orders ÷ website sessions, renewals left out, Amazon tracked on its own. |
Each person got an honest answer to a slightly different question. Nobody got the agreed answer, because there wasn't one yet.
Why do GA4 and Shopify conversion rates differ?
GA4 and Shopify conversion rates differ because they count different orders and, often, different visits. GA4 only sees purchases its tag recorded in the browser, so shoppers who block tracking or decline cookies can be missing. A Shopify order file holds every order the store processed, including ones that never came through a website visit.
For a subscription brand, the biggest gap is usually renewals. A renewal ships on its own schedule with no visit, so putting it on top of a sessions count pushes the rate up. Date ranges and time zones can also differ between tools, which shifts orders near midnight into a different day.
Neither tool is wrong. They're built for different jobs. The problem only starts when someone quotes one of them as "our conversion rate" without saying which.
Does it happen with other metrics too?
It happens with almost every metric that crosses tools, and it gets worse with metrics built from other metrics. Here are two more questions from the same synthetic example.
"How many new customers did we get last week?"
- 1,655 from pixel credit, where a customer who clicked two ads is counted twice.
- 1,412 from "new to Shopify", which misses Amazon and counts old customers who used a new email.
- 1,180 from the spreadsheet, which only covers DTC and was out of date.
- 1,318 on the agreed definition, New Customer v2: first order ever, anywhere. That is 1,090 on the site plus about 228 on Amazon.
"What did Meta cost per new customer last month?"
- $71 from Meta's own credit, which claims customers other channels also claim.
- $88 from connector spend divided by new Shopify orders, with no survey answers and no Amazon.
- $96 blended: total spend divided by all new customers, which isn't a Meta number at all.
- $105 on the agreed definition, CAC v2 using Channel Credit Rule v3. CAC is customer acquisition cost: ad spend divided by new customers.
The spread on CAC matters most, because budget follows it. A channel that looks like $71 gets more money than one that looks like $105. For the different kinds of CAC and when each is right, see blended, attributed, incremental and marginal CAC.
What does one agreed definition look like?
An agreed definition is a short written entry with four parts: the metric's name, what it means in plain words, who owns it, and which version is live. The owner is the person who decides when it changes. The version tells you which rule any given number used.
Here is what a short set of entries looks like for the same synthetic brand:
| Metric | Definition | Owner | Version |
|---|---|---|---|
| New Customer | First order ever, anywhere they buy: DTC, Amazon or wholesale. A repeat buyer on a new account is not new. | Finance | v2 |
| Conversion Rate | Website orders ÷ website sessions. Renewals that ship on their own don't count. Amazon tracked on its own. | Growth | v1 |
| Net Sales | Sales after discounts and refunds, before shipping and tax. | Finance | v1 |
| Ad Spend | Every ad dollar by day and channel, TV and podcasts included, on the day it ran. | Growth | v1 |
| Channel Credit Rule | Survey answer first, then discount code, then last click. TV gets the share its latest test showed. | Growth | v3 |
| CAC | Ad spend ÷ new customers, per channel, using the credit rule. | Finance | v2 |
| Active Subscriber | Has a live subscription today. Skipping a month still counts as active. | Retention | v1 |
The entries lean on each other. CAC uses Ad Spend, New Customer and the Channel Credit Rule, so a change to any of them changes CAC. That is why each needs a version.
This is a starting set, not a full metric dictionary. For gross sales through LTV, with dates, sources and edge cases, use the DTC metric dictionary.
What is a semantic layer, and why does AI need one?
A semantic layer is the place where those definitions live as working rules, so every dashboard, spreadsheet and AI assistant pulls the same calculation instead of building its own. In plain words, it is the agreed definitions, written once, that every tool reads.
An AI assistant without one has to guess from table and column names. It sees a column called "orders" and has no way to know renewals should be left out. With the definitions in front of it, it reads "Conversion Rate v1" and uses that rule.
A semantic layer reduces guessing. It doesn't make an assistant always right, so test it with real questions where you already know the answer. For more depth, see what a semantic layer is, in plain words.
How should a definition change?
A definition changes through one short process, so nobody changes it quietly in their own tool. We use three steps:
- Someone asks for a change. For example, Growth wants Amazon included in conversion rate.
- The owner agrees. The owner decides, and writes down why.
- The new version goes live everywhere at once. Dashboard, AI assistant, email tool and spreadsheets all switch on the same day.
Every number then says which version it used. "Conversion rate 2.7% (v1)" can be compared fairly with last quarter. A number with no version can't be compared with anything.
Keep old versions on file. When v2 arrives, last quarter's reports should still show the numbers they showed then, labeled v1.
Why is this like a chart of accounts?
A metric definition does for marketing numbers what a chart of accounts does for the books. You'd never let three people book revenue three different ways. The chart of accounts fixes where each dollar goes, so the income statement means the same thing every month.
Marketing numbers rarely get that care, and the gap only shows when two versions land in the same meeting. Written definitions give a CFO the same footing on CAC that the chart of accounts gives on revenue.
The same thing happens with revenue itself. See why Shopify, finance and marketing report different revenue for that version of the problem.
Where do you start?
Start with the three or four metrics that land in a meeting every week and cause an argument. For most DTC brands that is new customers, CAC, conversion rate and net sales.
- Write each one down with a name, a plain-words definition, an owner and v1.
- Pick one source for each part of the formula. Orders from the store, spend from the ad accounts, sessions from analytics.
- Point every tool at those definitions, the AI assistant first, since it's the one people will ask most freely.
- Test it. Ask the assistant the questions from the tables above and check it returns the agreed number.
The work underneath is mostly tying the sources together, so a customer on Amazon and on your site can be counted once. For that part, see how to track customers across platforms.
Frequently asked questions
Why is my GA4 conversion rate lower than Shopify's?
GA4 usually counts fewer orders, because it only records purchases its tag saw in the browser. A Shopify order file includes every order, including subscription renewals that never involved a visit. Pick one agreed definition and say which one a number uses.
Why does ChatGPT or another AI assistant give different answers from the same data?
Usually the data isn't actually the same. Each person points the assistant at a different source, a different date range or a different definition. Give the assistant one set of written definitions to read, and the same question gets the same answer.
What is a single source of truth for metrics?
It is one written definition per metric, with an owner and a version, that every tool reads. The data can still come from many systems. The rule for combining it lives in one place.
Does a semantic layer make AI answers correct?
It makes them consistent, and far less of a guess. The assistant can still pick the wrong metric if two look alike, so name metrics clearly and test it with questions where you already know the answer.
What to do next
Pick the one metric that started the last argument, write down its definition, owner and version, and ask your AI assistant the question again against that definition. If your teams are quoting different numbers for the same thing, see how we fix reports that disagree, or book a call and we'll look at your definitions together.
Part of the Ecommerce reporting guides, a reading path through related articles.
Linus Tse
Founder of Greyfield Data. Built 400+ dashboards. Certified in Sigma, Snowflake, Tableau, and Power BI.
About Linus