Does a bigger Black Friday discount pay for itself in basket size?
Track units per order against discount by day, compare the Black Friday corridor to the days before it, and judge each offer by product AOV, not orders alone.

Written by Linus Tse, founder of Greyfield Data
· 5 min read
On this page 7 sections
A deeper Black Friday discount pays for itself when basket size rises faster than the discount does. Track units per order and discount by day, compare the Black Friday corridor with the days before it, and judge each offer by product AOV as well as orders.
We build this view as the "Basket vs Discount" tab of a BFCM dashboard. It's in the Black Friday dashboard demo with made-up numbers for a made-up apparel brand, so the figures below are illustrative.
Key takeaways
- Set one basket goal before the sale, such as a $118 product AOV at a 28% average discount, and judge every offer against it.
- Chart units per order (UPT) and discount on the same days. The bet works when UPT rises and discount holds, or when UPT rises faster than discount.
- Compare a stacked offer, such as sitewide on top of markdowns, with the days just before it, on discount, orders per day, UPT, conversion and AOV together.
- Rank styles by share of unit goal sold against the plan's pace, and read planned-markdown styles separately.
- Orders tripling is not the same as an offer paying off. A lower AOV can still pull the whole sale below its goal.
What does "basket vs discount" measure?
It measures whether customers buy more per order as the discount deepens. Three numbers do the work:
| Measure | Formula | What it tells you |
|---|---|---|
| Units per order (UPT) | Units sold ÷ orders | How big the basket is |
| Average discount | Discount dollars ÷ gross product sales at full price | How much margin you are giving away |
| Product AOV | Product sales after discount ÷ orders | What a basket is worth after the discount |
Use product sales, without shipping and tax, so the numbers compare across offers. Write the discount definition down once: whether it includes markdowns already on the product, and whether a free gift counts.
How do you chart units per order against discount?
Put UPT as bars and discount as a line on the same days, with two axes. In the demo, UPT sits at 2.8 to 2.9 while discount holds near 28% for nine days. On the gift with purchase day, UPT jumps to 3.2 while discount drops to 24%. On Black Friday, both rise: UPT to 3.1 and discount to 31.8%.
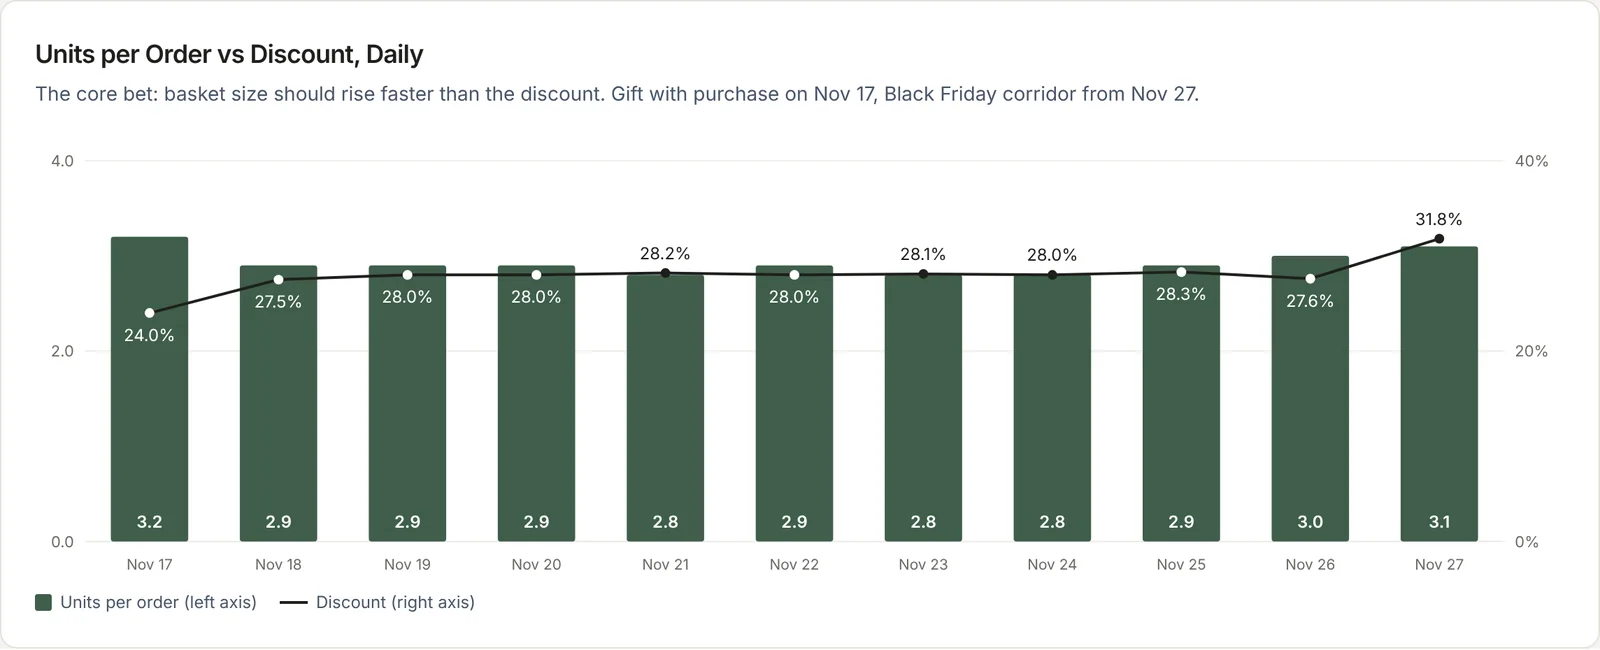
The gift with purchase day is the clean win: a bigger basket at a smaller discount. Black Friday needs a closer look.
Did the Black Friday offer pay for itself?
Compare the corridor day with the daily average of the days just before it, on five measures at once:
| Measure | Daily average before | Black Friday | Change |
|---|---|---|---|
| Discount | 28.0% | 31.8% | +3.8 pts |
| Orders per day | 2,286 | 6,770 | +196% |
| Units per order | 2.9 | 3.1 | +0.2 |
| Conversion | 1.50% | 1.98% | +0.48 pts |
| Product AOV | $126.50 | $118.50 | -6.3% |
Illustrative numbers from the demo.
Orders tripled, and UPT and conversion rose against a 3.8-point discount jump, so the corridor paid for itself on volume. But AOV fell 6.3%, to just above the $118 goal. If the stacked discount runs through Cyber Monday, the sale's AOV goal is at risk even while orders are ahead.
That is the point of reading the five together. Orders alone would say "keep going." AOV alone would say "stop." Together they say the offer works and the next lever is basket size, for example a threshold offer or a matching-set add-on.
Which styles are carrying the sale?
Rank the top styles from the merchandise plan by share of their unit goal sold, and compare each to the plan's pace for the sale (63% after 11 of 14 days in the demo). Mark styles with a plan note, such as "new style," "capped at +50% vs last year" or "planned markdown."
In the demo, both planned-markdown styles are last, 10 to 12 points behind pace. That points at the markdown depth, not the styles. A new style leads, which is worth knowing for next season's buy.
Frequently asked questions
What is units per transaction in ecommerce?
Units per transaction (UPT), or units per order, is units sold divided by orders. It shows basket size, separate from price and discount.
How do you know if a Black Friday discount was worth it?
Compare the discount days with the days before them on discount, orders, units per order, conversion and product AOV together. It paid off if basket size and volume rose enough to cover the margin given away, and AOV stayed near its goal.
Should a free gift with purchase count as a discount?
Decide before the sale and write it down. Most brands track the gift's cost separately from the price discount, so the discount trend stays comparable across days.
Should product AOV include shipping?
No. Use product sales after discount, without shipping and tax, so offers with free shipping compare fairly with offers without it.
What to do next
Set your basket goal and discount definition before the sale starts, then open the Basket vs Discount tab in the Black Friday dashboard demo. For the hour-by-hour view of the whole sale, read how to track Black Friday sales against plan. For the full profit picture behind AOV, the ecommerce profit dashboard checklist covers fees and costs. To have it built on your own data, book a call.
Part of the Ecommerce reporting guides, a reading path through related articles.
Linus Tse
Founder of Greyfield Data. Built 400+ dashboards. Certified in Sigma, Snowflake, Tableau, and Power BI.
About Linus