How do you track Black Friday sales against plan, hour by hour?
Pace each Black Friday goal on last year's curve, compare every hour to where the plan says you should be, and track the few bets the plan depends on.

Written by Linus Tse, founder of Greyfield Data
· 5 min read
On this page 8 sections
A Black Friday dashboard should answer one question by lunchtime: is today on plan, and if not, which part is off? That means pacing each goal to the hour on last year's curve, then tracking the handful of bets the plan depends on.
We build this for DTC brands as one daily check-in fed by Shopify, ad platforms and email every hour. You can click through a working version in the Black Friday dashboard demo, which runs on made-up data for a made-up apparel brand.
Key takeaways
- Compare actuals to the plan paced to this hour, not to a straight line. Most of a sale's volume lands at the end, so a straight line makes the first week look behind.
- Show sales, orders, new customer orders and returning orders separately. A day can be ahead on sales and behind on new customers, and that gap is what the next ad dollar should fix.
- Track the plan's bets by name, such as a gift with purchase day, bundles or a doorbuster, and mark each one landed, on track or behind.
- Rank channels by growth against last year's same sale day, so the channel that is slipping is obvious.
- Refresh hourly. The decisions it drives take hours to act on.
Why does a straight-line pace mislead during BFCM?
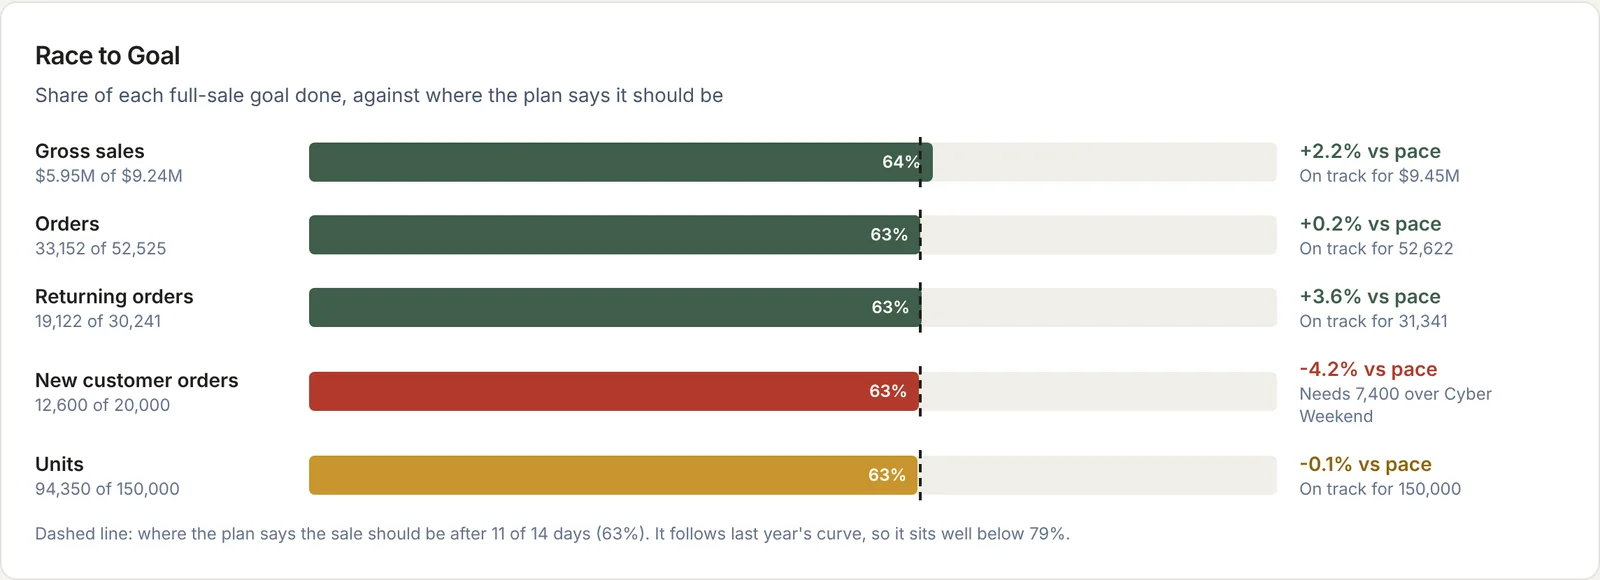
A straight line assumes every day of the sale sells the same. It doesn't. In the demo, the brand is 11 days into a 14-day sale, which is 79% of the days. But last year's curve says only 63% of the volume should be done by now, because Thanksgiving through Cyber Monday carries the most.
Against 79%, the sale looks badly behind. Against 63%, gross sales are 2.2% ahead. Same numbers, opposite decisions.
To build the curve, take last year's share of sale volume by day and by hour, and spread each of this year's goals across it. If last year had a different calendar, line the days up by sale day (Day 1, Day 2), not by date.
What should the top of the dashboard show?
One status line, then today's numbers against the plan for this hour. In the demo it reads "Ahead of plan: $371K so far, 3.8% vs plan for 2 PM, behind on new customers (-5.5%)." Anyone on the team can read that in five seconds.
Below it, one tile per number, each with its comparison:
| Measure | Compare to | Why |
|---|---|---|
| Gross sales | Plan paced to this hour | The headline goal |
| Orders | Plan paced to this hour | Separates volume from basket size |
| New customer orders | Plan paced to this hour | Usually the first thing to slip, and the one paid budget can move |
| Returning orders | Plan paced to this hour | Shows whether email and SMS are doing their part |
| Sessions | Last year, same sale day and hour | Traffic has no plan of its own in most brands |
| Conversion rate | Last year, same sale day and hour | Tells you whether the site or the offer is the problem |
The numbers in this post come from the demo, and they are illustrative, not a benchmark.
How do you track the bets a sale plan depends on?
Every BFCM plan rests on a few things that need to be true. Write them down and give each one a measure and a target. In the demo there are nine, in two groups: basket against discount (a gift with purchase day, the Black Friday corridor, bundles, a doorbuster, markdown sell-through) and reactivating lapsed customers.
Each bet gets one of four states: landed, on track, behind, or upcoming. "2 of 9 landed" by day 12 is fine if the rest are on track. "Behind" on two related bets, such as reactivation rate and new customer list build, tells you where to spend the next three days.
The details of those two groups are in Black Friday basket size vs discount and how to measure Black Friday reactivation.
Which channels are driving the sale?
Rank channels by growth in Black Friday sessions against last year's Black Friday, and show conversion next to it. In the demo, SMS and email grew fastest and paid social fell 8.9%. Growth tells you who is pulling. Conversion tells you whether that traffic buys.
Use the same channel definitions as the rest of your reporting. If paid social is defined differently here than in the daily ecommerce scorecard, the two will disagree and people will stop trusting both.
How should the data get there?
Load Shopify orders, ad platform spend and sessions, and email and SMS sends into one warehouse every hour. Load the plan too, as a table of goals by metric, day and hour. Then every number on the dashboard is a join between the two.
Three rules keep it honest during the sale:
- Lock the cutoff. Each refresh reports through a stated time in one time zone, and the dashboard says which.
- Use order date for sales. Refunds arrive later and belong in a separate view. Shopify refund date vs order date explains why.
- Freeze the definitions before the sale starts. A new customer, a returning customer and a gross sale should mean the same thing on Day 1 and Day 14.
Frequently asked questions
What should a Black Friday dashboard show?
Where sales, orders and new customers stand against the plan for this hour, plus the few bets the plan depends on, each marked landed, on track or behind. Add a channel ranking against last year's same sale day.
How do you pace Black Friday sales to a plan?
Spread each goal across the sale's days and hours using last year's share of volume by sale day and hour. Then compare actuals to that curve instead of a straight line.
How often should a Black Friday dashboard refresh?
Hourly is enough for most DTC brands. The decisions it drives, such as moving paid budget or sending another email, take hours to act on.
Should you compare Black Friday to last year or to the plan?
Both, for different numbers. Compare goals such as sales, orders and new customers to the plan, and compare traffic and conversion to last year's same sale day.
What to do next
Write down your sale plan's goals and the bets behind them before the sale starts, then click through the Black Friday dashboard demo to see the layout. If you want it built on your own Shopify, ad and email data, see DTC data analytics consulting or book a call.
Part of the Ecommerce reporting guides, a reading path through related articles.
Linus Tse
Founder of Greyfield Data. Built 400+ dashboards. Certified in Sigma, Snowflake, Tableau, and Power BI.
About Linus