How much time does your team lose to reporting?
Count report hours, fixes, and waiting time, then automate the loads and let people ask their own questions. A worked example and what changed in our case studies.

Written by Linus Tse, founder of Greyfield Data
· 5 min read
On this page 7 sections
Most DTC teams lose more time to reporting than they think, because the hours are spread across people: an export here, a reconciliation there, a question that waits three days for an analyst. Count four things: hours to produce each report, how often it runs, hours spent fixing what broke, and how long a new question takes to answer. That total is what you can get back.
We take those hours back with a DTC data warehouse and reporting setup that loads every morning. To put a number on your own team, use the free reporting time calculator.
Key takeaways
- Reporting time is hours to produce each report, times how often it runs, plus hours spent fixing it, plus the time questions spend waiting.
- With the calculator's default inputs, a team spends 44 hours a month on six reports, and automating 70% of that gives back about 31 hours.
- In our case studies, two-week questions came down to minutes once data loaded on its own and people could ask directly.
- The waiting time matters as much as the work time, because decisions wait too.
- Measure hours before you start. It is the easiest way to show the work paid off.
Where do the hours go?
They go to four kinds of work, and only the first one shows up in anyone's calendar.
| Where the time goes | What it looks like |
|---|---|
| Producing reports | Exporting from Shopify, Amazon, and each ad platform, then pasting into the Monday sheet |
| Reconciling | Two reports disagree, and someone spends the afternoon finding out why |
| Fixing what broke | A connector or formula changes, and the numbers are wrong until someone notices |
| Waiting | A new question sits in an analyst's queue, so the decision waits with it |
Reconciling is the one most teams underestimate. When growth, ops, and finance each pull the same metric their own way, every meeting starts by sorting out whose number is right. Why AI gives different answers to metric questions shows how that happens with conversion rate.
How do you calculate the time your team spends on reporting?
Multiply reports by hours per run and runs per month, then add the hours spent fixing things. Multiply by a loaded hourly cost to get a monthly figure.
Here it is with the reporting time calculator's default inputs. They are an illustration, not a benchmark, so set your own baseline.
| Input (calculator default) | Value |
|---|---|
| Recurring reports | 6 |
| Hours to produce each one | 1.5 |
| Runs a month | 4 |
| Hours a month fixing breaks | 8 |
| Loaded cost per hour | $75 |
| Share you could automate | 70% |
6 reports × 1.5 hours × 4 runs = 36 hours of production. Add 8 hours of fixes and the team spends 44 hours a month, about $3,300 at $75 an hour.
Automate 70% of it and about 31 hours a month come back, worth about $2,310. The calculator also takes a build cost and monthly upkeep. With its defaults of $12,000 and $400, the net saving is about $1,910 a month and the build pays back in a little over six months.
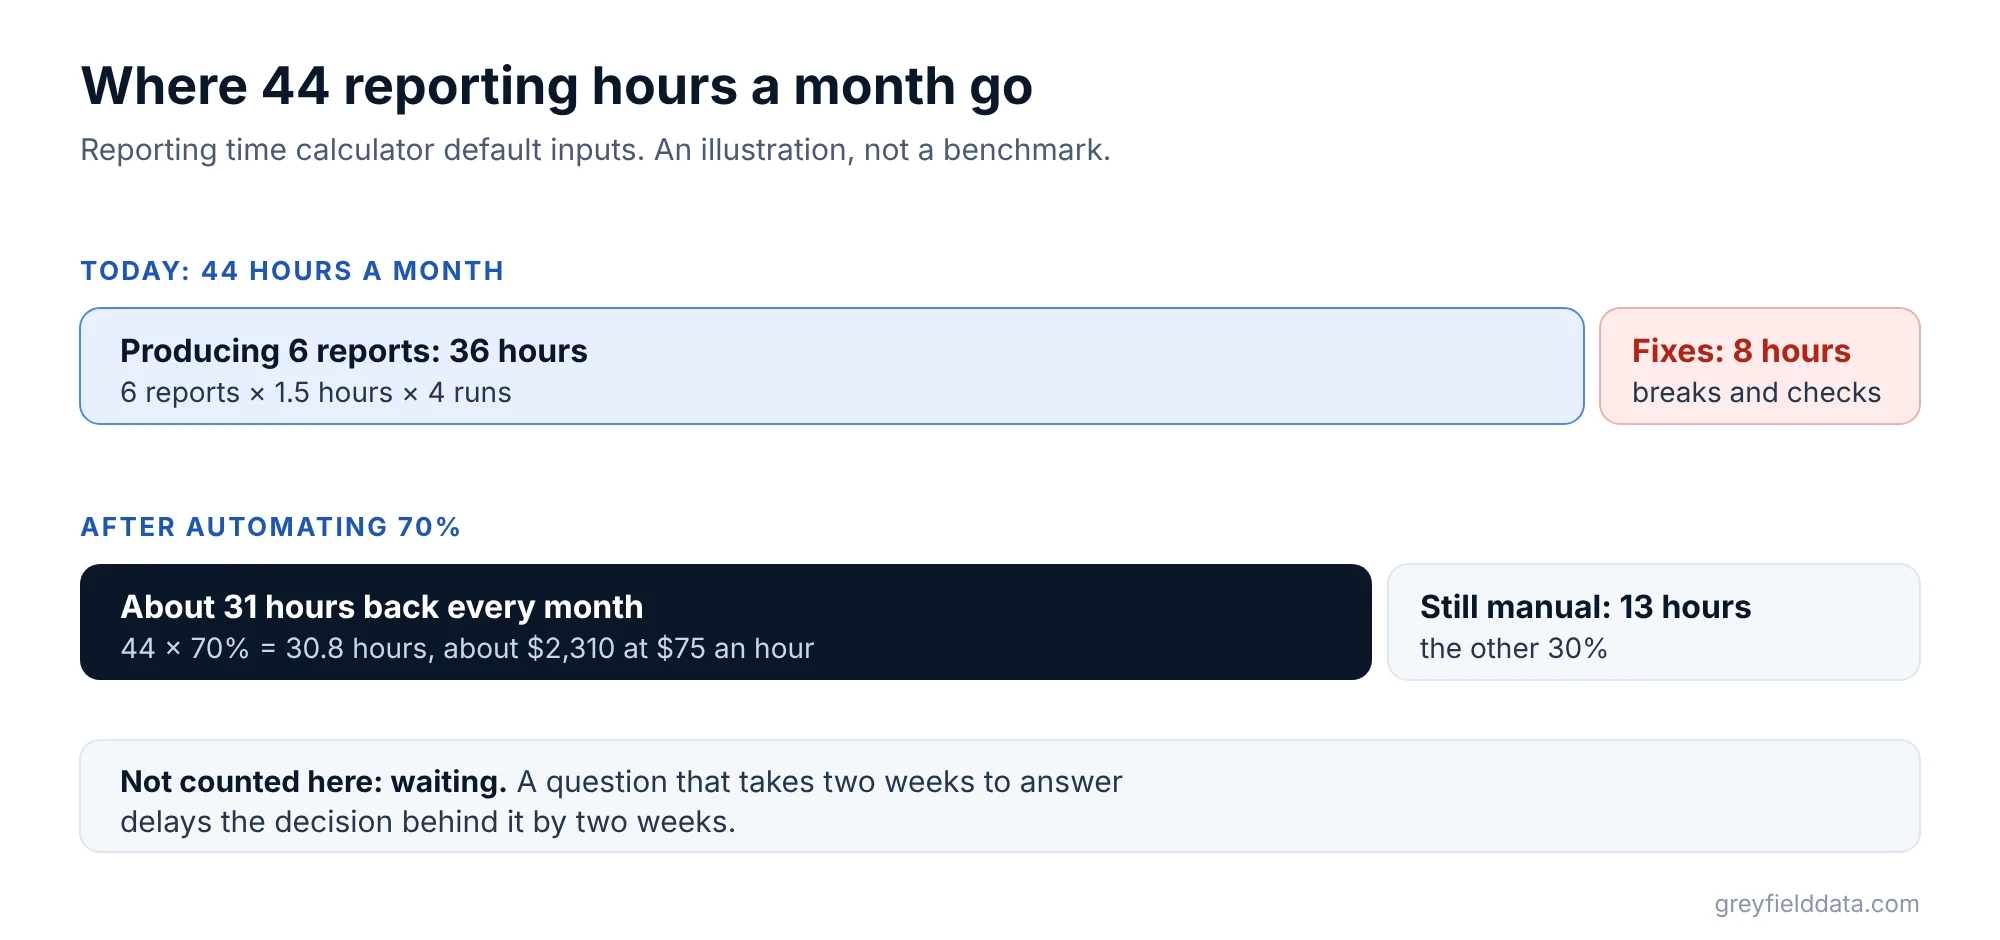
That figure still leaves out waiting time, which the calculator doesn't price. A question that takes two weeks to answer delays the decision behind it by two weeks.
What changed in our case studies?
The pattern was the same each time: data loaded on its own, metrics defined once, and people able to get answers without a queue.
| Case study | Before | After |
|---|---|---|
| Multi-brand DTC portfolio | 2 weeks to answer a cross-brand question | Minutes |
| Brokerage daily report | 5 hours a week producing the report | About 30 minutes |
| National legal organization | 2 weeks to answer a leadership question | 20 minutes, and 300% more questions asked |
| Education marketing dashboard | A day a month of manual assembly | Runs on its own |
The legal organization's result is worth a second look. Once people could ask directly, they asked far more questions. The team did not just save time; it used the data more.
How do you get the hours back?
Take the steps in this order. Each one removes a kind of lost time.
- Load the data every morning. Orders, spend, and customers land in one central database on a schedule, so nobody exports by hand. Why your Google Sheets marketing dashboard keeps breaking covers the move off spreadsheets.
- Define each metric once. New customer, CAC, and conversion rate each get one written rule, so nobody reconciles the same number twice. The ecommerce semantic layer has a starter dictionary.
- Watch the loads. Monitoring catches a broken connector before anyone sees a wrong number, which removes most of the fixing time.
- Let people ask directly. An AI assistant or a self-serve dashboard that reads those definitions turns the analyst queue into minutes. Do DTC brands need a data engineer? covers what that still needs behind it.
The time saved is only half of it. The same data shows where the next ad dollar earns the most, which is usually worth more than the hours. See average vs marginal return on ad spend.
Frequently asked questions
How much time should a DTC team spend on reporting?
There is no standard number, so set your own baseline. Count hours to produce each recurring report, hours spent fixing breaks, and how long new questions take, then track the total each month.
What reporting should be automated first?
The reports that run most often and take the longest to produce, usually the daily or weekly spend and sales view. Automating those gives back the most hours soonest.
Is reporting automation worth it for a small brand?
It depends on the hours. Put your own numbers in the reporting time calculator: if the payback is under a year, it usually is.
Does an AI assistant replace an analyst?
It replaces the queue, not the judgment. On data that loads reliably and has defined metrics, people can answer their own routine questions, which frees the analyst for the harder ones.
What to do next
Count last month's reporting hours with your team, then run them through the reporting time calculator. For the full approach, including where the next ad dollar should go, get the white paper How to Build a DTC Data Practice in 2026, or book a call.
Part of the Ecommerce reporting guides, a reading path through related articles.
Linus Tse
Founder of Greyfield Data. Built 400+ dashboards. Certified in Sigma, Snowflake, Tableau, and Power BI.
About Linus