Why does building reliable ecommerce reporting take time?
Connecting sources is often the quick part. The time goes to history, matching records, business rules, cost timing, validation, and getting people to use it.

Greyfield Data
In this article 9 sections
Reliable ecommerce reporting takes time because connecting a source only moves data. Someone still has to load the history, match records across systems, agree on business rules, attach costs, reconcile totals, and get people to use the result.
A first dashboard can come together well before anyone should trust it. The gap between those two moments is the project.
There's no standard timeline, because it depends on your sources, your history, and how many definitions need a decision. Here's where the time goes, and how to tell when each stage is done.
Connecting isn't the same as having history
A connector can start syncing new records fast. Your older records may take more work.
Shopify's Order object only exposes the last 60 days of orders by default, unless an app has been granted access to all orders. The 2021-11 Recharge API docs say charges with success, refunded, or partially_refunded status and a processed_at date more than 90 days old no longer appear in charge responses, and point to its Exports tool for that history.
So a backfill can mean an access request, an export, and a check that the two sets of data meet without a gap. Rate limits and data size can stretch it further.
Records don't match on their own
Each system has its own IDs. Orders, customers, products, and refunds can each need a mapping before they line up. Some systems share a clean key. Others need a table you maintain, and some records will never match.
Decide what happens to the ones that don't. Keep them in an exception report, so the numbers stay honest about what's missing.
Business rules need a decision
Software can't choose these for you:
- Is a gift card a sale when it's sold, or when it's redeemed?
- Does a refund lower the month it happened, or the month of the order?
- Does a cancelled order count at all?
- Does a subscription renewal count as a repeat order?
- Which day and time zone does a month end on?
Each answer may be right for one team and wrong for another. Getting the right people to agree can take longer than writing the code. That's why teams report different revenue numbers until someone settles it.
Costs arrive late and in pieces
Contribution needs costs on each order or line. Those costs can live in different places, and they may not arrive when the order does.
Shopify's cost per item is static, so a report can go wrong if you need cost history and only have today's cost. Shipping invoices can arrive weeks later. Payment fees may need their own source.
How precise you need to be depends on the decision. Some teams can start with an average cost by product. Others need more detail. Agree on the level up front, and label what's estimated.
A worked mismatch
Here's a made-up month. Shopify's sales report shows $50,000 of net sales. The first warehouse model shows $51,240. It's only 2.5% off, but nobody should trust it until the gap's explained.
| Cause | Effect on the warehouse number |
|---|---|
| Shopify net sales report | $50,000 |
| A refund join repeated order rows | +$620 |
| Gift card sales the report leaves out | +$300 |
| Month cut in UTC instead of store time | +$180 |
| Test orders | +$140 |
| First warehouse number | $51,240 |
All four causes are real kinds of difference. Shopify says test orders aren't in sales reports but do appear in the orders export. It also keeps gift cards sold out of sales reports, and counts the item value as a sale at redemption.
Notice what each fix needs. The duplicate rows are a bug. The test orders are a filter. The time zone is a rule. The gift cards are a policy choice you may want to match or may want to report apart. A small gap can hold four kinds of work, and you can't find them until you look.
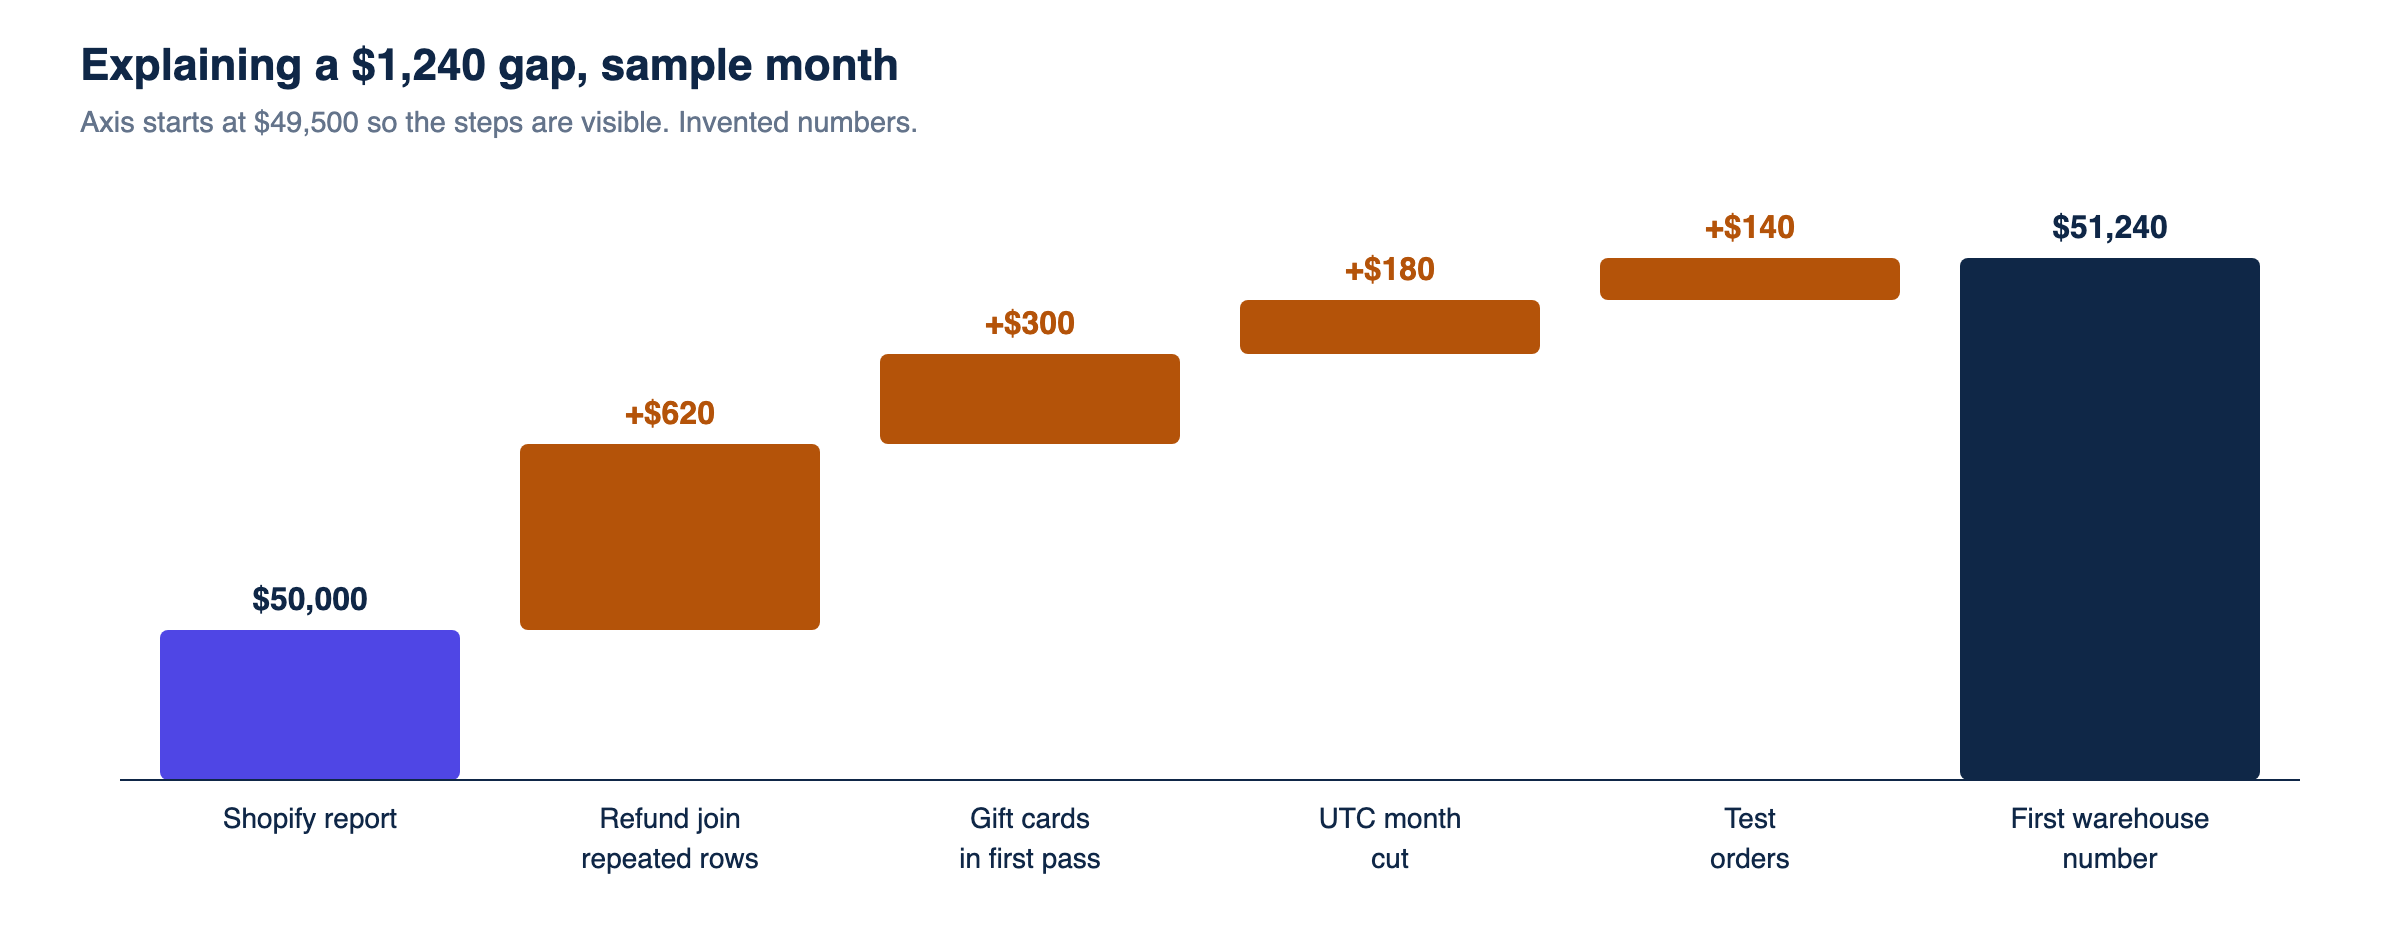
The goal isn't always an exact match. Some numbers will differ for good reasons, and you might keep a small tolerance. The gap just needs to be explained.
An illustrative path
This is a sample order of work, not a schedule. Each stage ends on a test that someone can check.
| Stage | Depends on | Done when |
|---|---|---|
| Access | Accounts and permissions | Each first-phase source loads on schedule |
| History | Backfill or exports | Unique source IDs pass a duplicate test, and row counts match for a named closed period |
| Matching | Keys and mapping tables | Match rate is reported against a threshold set in advance |
| Definitions | Named owners | Key metrics have a written rule and a sign-off |
| Reconciliation | Source reports | A closed period in the reporting time zone ties out within a tolerance set before results are reviewed, and each gap is explained |
| Reports | Agreed metrics | Users can answer their question without help |
| Adoption | Time with the team | Old spreadsheets are retired, and an owner's named |
Agree on a late-arrival window for refunds and costs before you compare totals.
Start with one set of reports. Add a source after the first ones reconcile. Each new source adds its own history, keys, and rules, so scope is one of the biggest factors in time.
Monitoring keeps it true
A report that was right on launch day can drift. Sources change fields, connectors fail, and new products need mapping. Without tests that actually run, you may only find out when someone questions a number.
Add checks for freshness, row counts, and duplicates, and make someone responsible for failures.
Adoption is part of the work
If people keep their old spreadsheet, the project isn't finished. Show the new number next to the old one for a while, explain any differences, and let the people using it find problems. This step takes real time, and it's easy to skip.
The numbers above are made up, and your path will depend on your data. If you've found a faster way through any of these stages, I'd like to hear it. If you're scoping a project like this, the ecommerce data warehouse page lays out a first-build sequence. For how the layers fit together, see bronze, silver, and gold with one order.
Work through the specific exceptions
Three useful checks are product and SKU mapping, refund date versus order date, and estimated versus actual Amazon fees. Each guide shows a small example and a reconciliation procedure. Resolve those rules before distributing the tables through a shared Sigma data model.
Related
How to avoid double-counting Shopify, Amazon and TikTok orders
Separate the sales channel from the fulfillment provider, link mirrored orders, and reconcile revenue before combining Shopify, Amazon and TikTok Shop reports.
GuideMap SKUs across Shopify, Amazon and TikTok without breaking margin
Build a product crosswalk with source IDs, dated mappings and explicit bundle quantities. Catch duplicate joins and missing costs before calculating product margin.
GuideShopify refund date vs order date: why monthly sales differ
A refund processed this month can belong to last month's order. Learn how event-date and order-cohort reporting differ and reconcile both without double counting.