How to plan a Looker to Sigma migration
Plan a Looker to Sigma migration by sorting LookML views, Explores, derived tables, PDTs, Looks and dashboards into warehouse tables, data models and workbooks.

Written by Linus Tse, founder of Greyfield Data
· 8 min read
On this page 11 sections
A Looker to Sigma migration starts with the LookML project, not the dashboards. Most of the business logic lives in views, Explores, measures and derived tables, so the plan is mostly deciding where each of those pieces goes: into warehouse tables, into a Sigma data model, or into a workbook.
We plan and run these moves as part of our Sigma consulting work. Linus is Sigma-certified, and Greyfield is an independent consultancy. The steps below are the ones we use to scope a Looker estate before anyone rebuilds a chart.
Key takeaways
- Looker's logic is code. Inventory the LookML project (views, Explores, joins, measures, derived tables) before counting dashboards.
- Views that read base tables point Sigma at the same tables. SQL derived tables and persistent derived tables (PDTs) usually belong upstream in the warehouse.
- Explores and shared measures map to Sigma data models, with relationships for joins and metrics for reusable aggregates.
- Looks and dashboards become Sigma workbook pages. Schedules become scheduled exports.
- Sigma's AI-assisted migration is a public beta that lists Looker as a source. Treat its output as a first draft that still needs validation.
Why is a Looker migration different from Tableau or Power BI?
A Looker migration is different because the logic sits in a version-controlled model, not inside each workbook or report. In Looker, a view "defines a list of fields (dimensions or measures) and their linkage to an underlying table or derived table", and "an Explore is a view that users can query."
That changes the order of work. In a Tableau migration you trace calculations inside each workbook. In a Power BI migration you start from shared semantic models and DAX. With Looker, the model is already centralized, so you can move a shared definition once and reuse it across many dashboards.
The trade-off also changes. Looker users mostly work inside Explores that developers have modeled. Sigma users can build directly in a workbook, which Sigma describes as combining "spreadsheet and BI capabilities". Decide early how much freedom business users get, because that sets how much you put in governed data models. Our Sigma vs Looker comparison covers that choice in more depth.
What should the Looker inventory include?
The inventory should list every LookML object that a used dashboard depends on, plus the content people open and the deliveries they receive. Start from usage, then trace down into the model.
- Content in use. Looker's System Activity holds user and query history and "all Looks and dashboards that are saved on your instance". Admins have access by default.
- Dashboards and Looks. A Look saves an Explore query "including your selected fields, filters, sort order, and visualization settings", and a Look can be the source of a dashboard tile.
- Explores and joins. Record which views each Explore joins and on what keys.
- Measures and dimensions. Note which measures are reused across many dashboards. Those are your shared definitions.
- Derived tables and PDTs. Separate native, SQL-based and persistent derived tables, and record each datagroup that triggers a rebuild.
- Access rules. List every access_filter and the user attributes behind it.
- Schedules. Record recipients, formats, destinations and timing for every scheduled delivery.
Content nobody opens is a retirement candidate, not a migration task. Our guide on which dashboards to migrate, consolidate or retire covers that sort.
Where does each LookML object go in Sigma?
Each LookML object goes to one of three places: warehouse tables and views, a Sigma data model, or a Sigma workbook. The diagram is a starting map; confirm each object against how your team actually uses it.
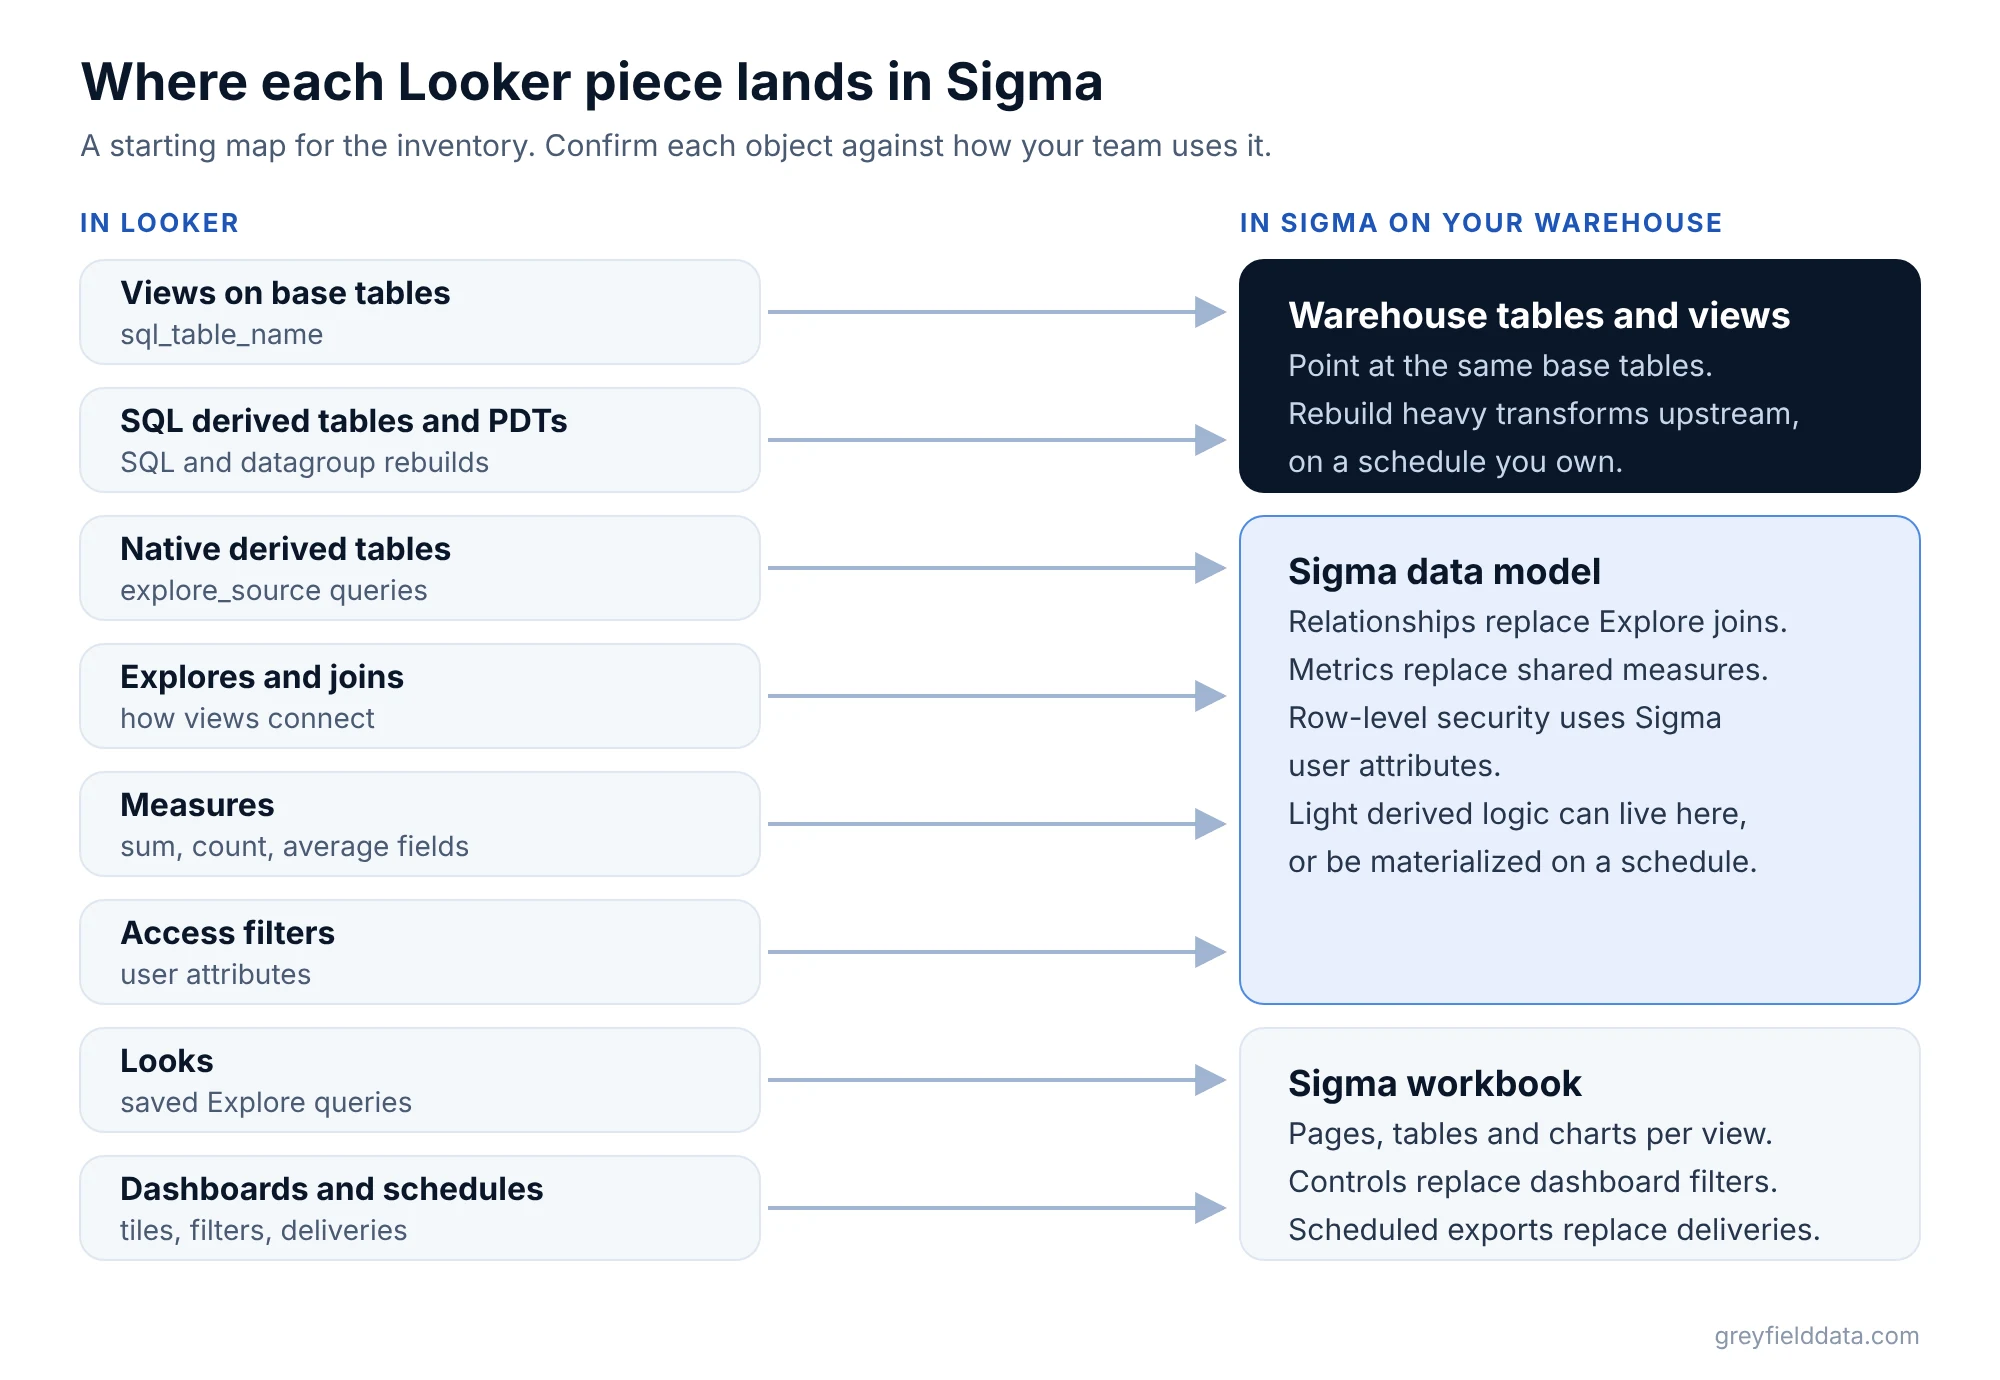
| Looker object | Usual Sigma destination | What to check |
|---|---|---|
View on a base table (sql_table_name) |
Same warehouse table, used as a source | Field renames, types and hidden fields |
| SQL derived table | Warehouse view or table, often in dbt | Who owns the SQL after the move |
| Persistent derived table (PDT) | Scheduled warehouse table, or Sigma materialization | Rebuild trigger and freshness |
| Native derived table | Data model element, or a warehouse table if it is heavy | Grain of the result |
| Explore and joins | Data model with relationships | Join type and fan-out |
| Shared measure | Sigma metric on the data model | Same result at each grouping |
access_filter with user attributes |
Sigma row-level security with user attributes | Every role sees the right rows |
| Look | Table or chart in a workbook | Filters and sort order |
| Dashboard and schedule | Workbook page, controls and scheduled export | Recipients, format and timing |
What happens to derived tables and PDTs?
Most SQL derived tables and PDTs should move upstream into the warehouse. Looker documents a derived table as "a query whose results are used as if the query were an actual table in the database". A PDT is one "written into a scratch schema on your database" and rebuilt when its datagroup triggers.
That means a PDT is already a warehouse table with a refresh schedule that Looker manages. When Looker goes away, so does the scheduler. Give each PDT a new owner: a dbt model, a scheduled warehouse task, or a Sigma materialization.
Sigma's materialization "writes a copy of a dataset or data element back to your warehouse as a table" on a schedule. It suits a heavy element inside a data model or workbook. Logic that other tools also read belongs in the warehouse, where it does not depend on any BI tool.
Native derived tables are different. They are written in LookML terms with explore_source, so they often describe an aggregate of an Explore. Rebuild light ones as data model elements, and push heavy ones into the warehouse.
How do Explores and measures become Sigma data models?
Explores become Sigma data models, with relationships standing in for joins and metrics standing in for shared measures. Sigma says data models "provide a semantic layer for your data", and that relationships let business users "work with related data without performing ad hoc joins".
A Sigma metric is "a custom aggregate calculation that can be reused across data elements that share a data source". Move the measures that many dashboards reuse first. A measure used by one Look can often be a workbook column instead.
Build in data models, not datasets. Sigma's metrics page states that datasets can no longer be created or edited as of June 2, 2026, and can no longer be used as a source as of September 15, 2026.
Check fan-out on every join. Looker's symmetric aggregates stop joined tables from inflating sums, averages and counts, so a Looker total can hide a one-to-many join. Test the Sigma metric at the order level and at the line level before you sign it off.
How do Looks and dashboards become workbooks?
Looks and dashboards become workbook pages, with controls replacing dashboard filters and scheduled exports replacing deliveries. Group dashboards that read the same Explore into one workbook where it makes sense, rather than one workbook per dashboard.
Looker table calculations run on query results, so record them as their own list. Most become workbook formulas. Our Sigma functions list has the equivalents by category.
Sigma can send or schedule exports to email, Slack, Google Drive, cloud storage and other destinations, in formats such as CSV, Excel and PDF. Match each Looker schedule to a Sigma export, and confirm the recipients see the same file they did before.
Can Sigma's AI migration tool convert LookML?
Yes, in beta. Sigma's AI-assisted migration lists a looker-to-sigma skill that covers "LookML models and dashboards". The page marks the feature as a public beta that is subject to change.
It has requirements. The source content must read from a data platform Sigma can connect to, and the page lists Snowflake, Databricks, BigQuery, Redshift and PostgreSQL. It also needs Sigma API credentials and an AI assistant that supports skills.
Treat the output as a draft. The tool saves rebuild hours, but someone still has to check joins, measures, access rules and schedules against the old Looker numbers.
How should you pick the pilot and validate it?
Pick one dashboard that reads a shared Explore, uses a reused measure, has an access filter and goes out on a schedule. That exercises every destination in the map at once. Our pilot selection tests help narrow the choice.
Validate against Looker for the same filters and the same data cutoff. Compare totals, then a few rows, then each role's view of the data. The validation guide turns that into a sign-off record.
What to do next
Export your LookML project and a System Activity list of the dashboards people used in the last 90 days. Then try the Sigma migration readiness check to see where the effort sits. If you would like help sizing the move, book a call with Linus and bring the project and one representative dashboard.
Frequently asked questions
Can Sigma replace Looker?
Yes, if your users want to build in a spreadsheet-style workbook and you can govern shared logic in warehouse tables and Sigma data models. If centrally owned LookML in git is the main reason you chose Looker, weigh that before moving.
What happens to Looker PDTs in Sigma?
A PDT is already a table in your warehouse that Looker rebuilds on a datagroup trigger. Move the SQL into a warehouse model with its own schedule, or use Sigma materialization for heavy elements inside a data model or workbook.
Do LookML Explores map to Sigma data models?
Mostly. An Explore's joins become relationships in a Sigma data model, and its shared measures become metrics. Test each join for double counting before sign-off.
Is there an automated Looker to Sigma migration tool?
Sigma's AI-assisted migration, in public beta, lists a Looker skill for LookML models and dashboards. The source data must already be on a platform Sigma connects to, and the output still needs validation.
Part of the Sigma guides, a reading path through related articles.
Linus Tse
Founder of Greyfield Data. Built 400+ dashboards. Certified in Sigma, Snowflake, Tableau, and Power BI.
About Linus