How to plan a Power BI to Sigma migration
Scope a Power BI to Sigma migration around shared models, DAX definitions, data readiness, a representative pilot, and acceptance checks.

Greyfield Data

In this article 7 sections
Plan a Power BI-to-Sigma migration around the semantic models, data preparation, and user workflows behind the reports. A report count is a starting inventory, not an estimate of the work.
This walkthrough uses a small sales report to show what belongs in the plan: a source inventory, a data mapping, measure definitions, a pilot, and acceptance criteria. The same structure scales to a larger estate without assuming that every report is an independent rebuild.
Map shared models before counting rebuilds
Start with the reports people use and identify which semantic models supply them. Record a business owner, report link, model link, audience, delivery method, and decision supported for each report.
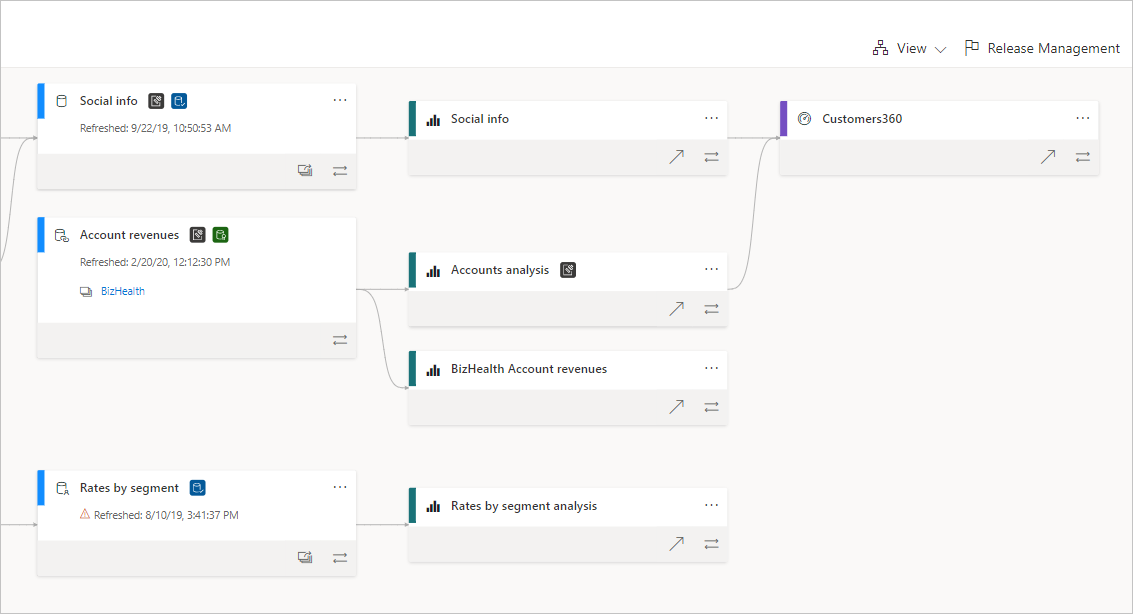
Power BI's lineage view helps expose the connections between source objects and dependent reports. The Microsoft screenshot is an example of that view, not our environment. Use it to identify shared work, then confirm each report's dependencies rather than treating the diagram as a complete business inventory.
For the sample, plan three report views on one order source: Regional Sales, Product Mix, and Order Detail. Rebuilding the common revenue definition once is different from implementing three independent versions. Each view still needs its own layout and interaction checks.
Establish one small dataset the team can reason about
This guide uses the Greyfield sample orders CSV: eight synthetic orders across January and February 2026. Each row is one order. Revenue is in generic currency units, with no tax, returns, or currency conversion. Dataset notes and calculated expected results are included. The arithmetic was checked independently with SQLite; it is a test specification, not a claim that a migration has passed in all three products.
January's baseline is five orders totaling 290. February has three totaling 200. The full sample totals 490. These numbers provide a visible starting point for the pilot.
The real inventory should identify where every required field originates. For the sample, that includes Order ID, Order Date, Ship Date, Region, Product, Customer ID, and Revenue. Record types and null handling, not just matching names. A text date or missing customer key can change behavior after conversion.
Decide where Power Query and imported data will go
Inspect the source's preparation steps. Find merges, appended files, renamed fields, type conversions, removed rows, and calculated columns that the report depends on. Separate preparation from measures evaluated during analysis.
Create a mapping with source object, transformation, destination object, owner, refresh expectation, and acceptance check. For example, if Revenue is derived from quantity and unit price upstream, the target must receive the same business definition, not an unrelated raw amount.
Sigma's migration workflow requires data to be available in a connected platform; data existing only in an imported model or extract needs to be landed first. Sigma migration requirements
That requirement is a separate work package. It can involve extraction, loading, permissions, and refresh ownership before any dashboard work begins.
Specify measure behavior with records and selections
For the sample, define Revenue as the sum of the order-level Revenue field. Define Known Customers as distinct nonblank Customer IDs. Define Average Order Value as Revenue divided by order count.
January Known Customers is four; February is two; both months together are five because C3 buys in both months. A sum of monthly distinct counts would return six and answer a different question.
For January East product A, revenue is 150. Its share of January East revenue is 150 ÷ 190, or 78.95%. Explicitly state that the denominator keeps month and region while ignoring product selection.
These examples give the builder something testable. They are more useful than saying “migrate the DAX” without defining what a measure must do under filters.
Inspect the model context behind those measures
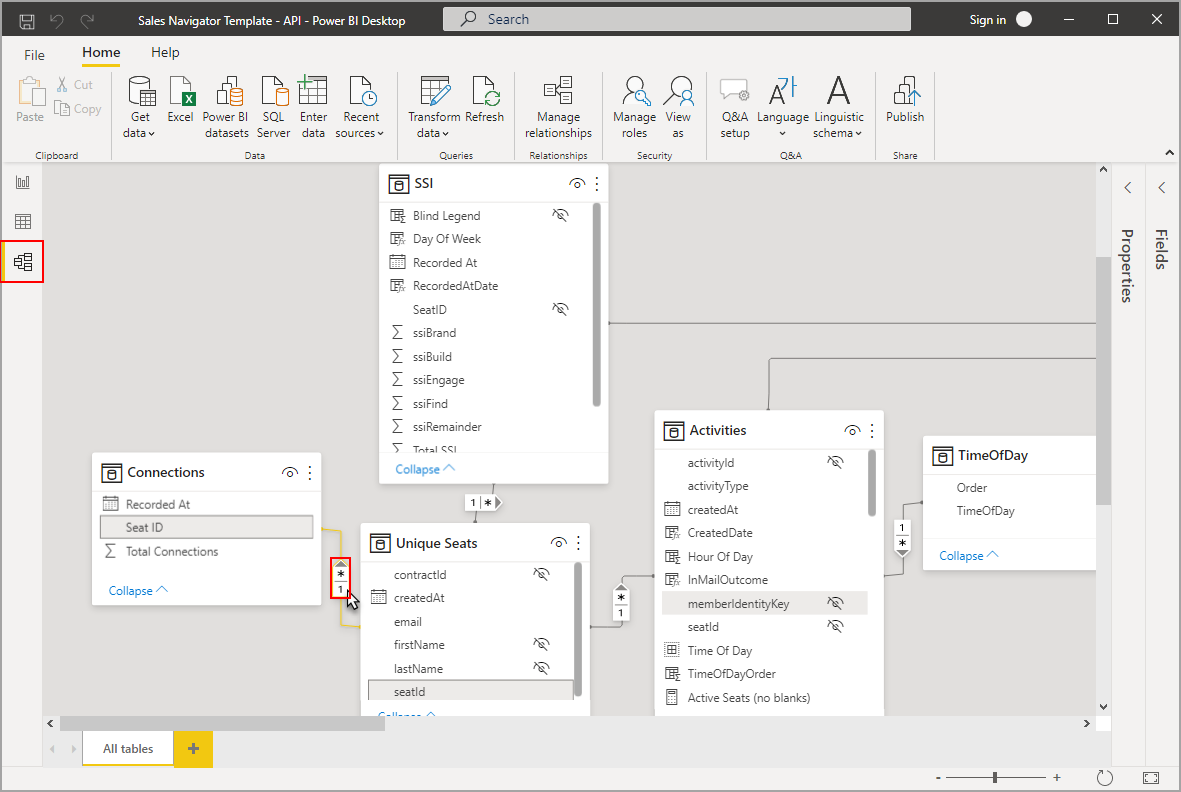
Use Model view to inspect key columns, relationship direction, and cardinality. Record the active date relationship and any measures that use a different date role.
O104 demonstrates why: it is ordered January 31 for 90 and shipped February 2. January order revenue is 290, but January shipped revenue is 200. A target that uses Ship Date everywhere could look reasonable while answering the wrong question.
Also identify the row grain. O105 has order revenue of 120 and three separate lines in the companion file. Summing its header after a one-to-many join would produce 360. The migration plan should assign responsibility for preserving grain before charts are rebuilt.
Choose a pilot that exposes the important work
Use a report whose owner can review it and whose baseline can be trusted. Our sample pilot includes a shared revenue measure, distinct customers, an order-date filter, region selection, a detail view, and an export.
Record what it does not cover. This sample does not prove a complex finance calendar, an embedded authentication flow, performance at production volume, or a deployed row-level security policy.
Give the pilot specific exit criteria: matching records and measures, reviewed interactions, verified restricted access where required, and an accepted output file. Keep unresolved differences in an exception log.
Estimate the work after the pilot
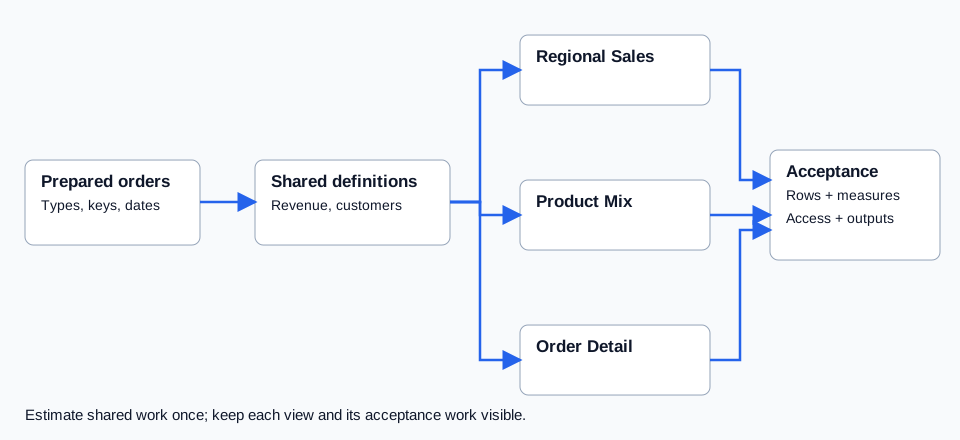
Separate data preparation, common model work, report rebuilding, interaction redesign, validation, access configuration, and handover. Track actual pilot effort for each, including review and fixes.
If several reports share a model, schedule the shared work first. If they differ in business definitions, resolve the disagreement instead of declaring them equivalent because they use the same field name.
Include existing bookmarks, subscriptions, exports, and downstream files in the rollout inventory. Assign owners to replace them and agree when the old report can be retired.
I would use the pilot to turn uncertain assumptions into a bounded first wave. Start with the seven DAX tests, then discuss your Power BI migration with the source model and one representative report available.
For calculation-level examples, use the DAX-to-Sigma formula cheat sheet, including CALCULATE context and distinct-count blanks.
Related
7 DAX measure tests to define before migrating Power BI to Sigma
Define expected behavior for Power BI measures before rebuilding them in Sigma, including totals, filters, distinct counts, dates, blanks, ratios, and relationships.
Sigma how-toPower BI DAX to Sigma formulas: a practical cheat sheet
Rebuild DAX calculations in Sigma with step-by-step setup, CALCULATE filter patterns, blank-count rules and ratio tests using downloadable sample data.
Migration cutover10 checks before approving a Sigma migration cutover
Review acceptance evidence, permissions, delivery, ownership, recovery, and retirement decisions before switching users from Tableau or Power BI to Sigma.