7 DAX measure tests to define before migrating Power BI to Sigma
Define expected behavior for Power BI measures before rebuilding them in Sigma, including totals, filters, distinct counts, dates, blanks, ratios, and relationships.

Greyfield Data

In this article 8 sections
Before translating a DAX measure into Sigma, write down the results it must return under specific selections. A matching grand total is a useful first check, but it can hide a wrong date relationship, duplicate records, or a denominator that changes with the visual.
These seven tests use the same eight-order dataset. They define the business behavior to preserve. They do not assume that a text replacement of a DAX expression produces equivalent behavior in Sigma.
Establish the data grain and baseline
This guide uses the Greyfield sample orders CSV: eight synthetic orders across January and February 2026. Each row is one order. Revenue is in generic currency units, with no tax, returns, or currency conversion. Dataset notes and calculated expected results are included. The arithmetic was checked independently with SQLite; it is a test specification, not a claim that a migration has passed in all three products.
The full dataset totals 490 across eight orders. January contributes 290 from five orders; February contributes 200 from three. Customer C1 buys twice in January, and C3 buys in both months. O107 intentionally has no Customer ID or Ship Date.
Start by confirming those facts at the source. Save the filters and the exact source measure alongside each result. If your real revenue measure excludes canceled orders or subtracts returns, document that rule instead of using a plain sum because it is easier to migrate.
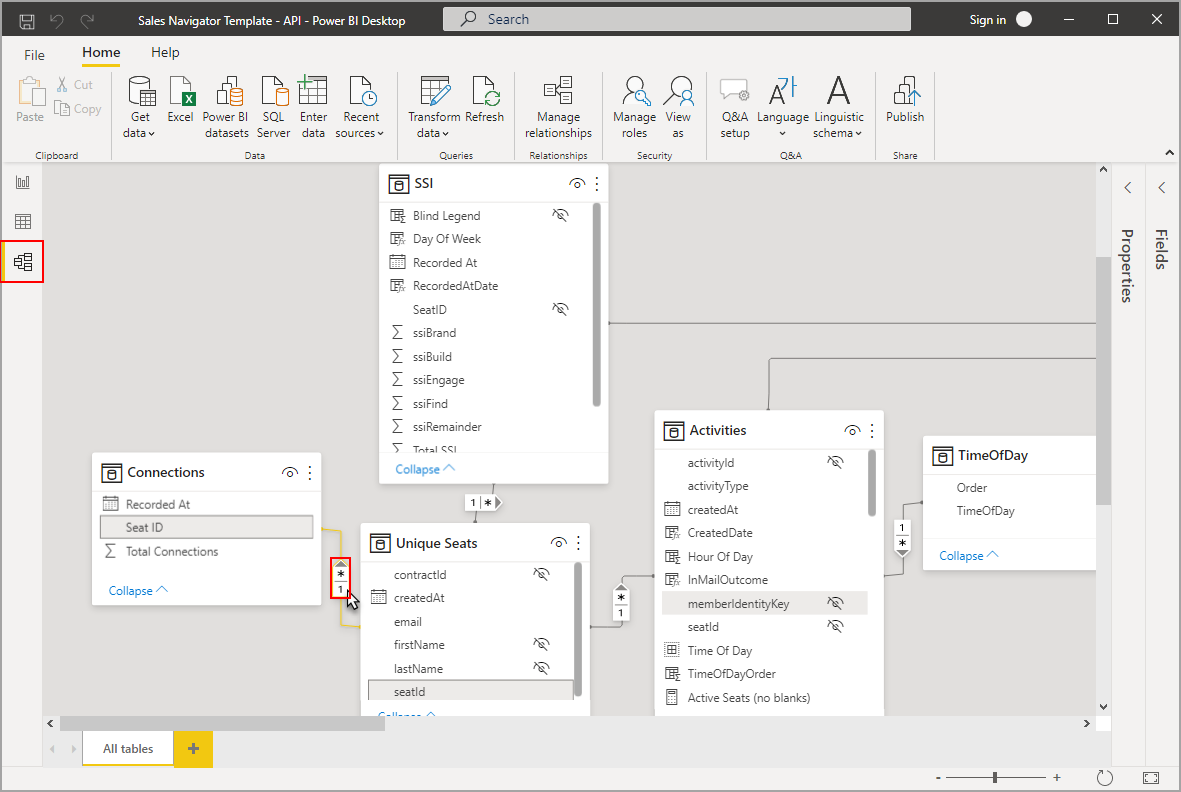
The screenshot shows where relationships are visible in Power BI Desktop. It uses Microsoft's sample model. For your model, record the relationship columns, cardinality, filter direction, and active date path before interpreting a measure.
1. Grand total and grouped totals
Sum Revenue by Order Date month. The expected rows are January 290 and February 200, with a total of 490. Then add Region: January East 190, January West 100, February East 50, and February West 150.
Check both the displayed rows and the total. A target can produce 490 while allocating revenue to the wrong month or region. Reconciliation at only one level won't reveal that.
For a mismatch, compare Order IDs before changing formulas. An extra order and a missing order can offset each other. Keep a detail extract for the failing selection so you can distinguish population differences from calculation differences.
2. Filter context and the denominator
Define a measure called Product share within selected region. For January East with product A selected, the numerator is 150 and the denominator is 190. The expected share is 78.95%.
The denominator must retain the January and East selections while removing the Product restriction. A denominator of 150 produces 100%; 290 uses all January regions; 490 ignores both month and region.
DAX CALCULATE changes the filter context used to evaluate an expression. That is why reviewing the filters matters alongside reviewing the formula text. Microsoft CALCULATE documentation
Write the retained and removed filters into the test case. In Sigma, choose a calculation and data structure that implement that rule, then verify the output. This guide doesn't prescribe an untested one-line formula translation.
3. Distinct customers across periods
For a business definition that excludes missing Customer IDs, January has four customers: C1, C2, C3, and C4. February has two: C3 and C5. Both months together have five, because C3 appears in each month.
Adding the monthly counts gives six customer-month appearances, not five distinct customers. A migration that sums a preaggregated monthly customer count changes the meaning.
Run the combined-period test explicitly. Also check a region selection, because distinct counts are sensitive to which records remain in the calculation.
4. Blanks and a period with no orders
O107 has a missing Customer ID but valid revenue of 30. Decide whether it belongs in revenue and whether an unknown customer counts as a customer. Those are separate decisions.
DAX DISTINCTCOUNT includes BLANK as a distinct value; it returns BLANK when there are no rows to count. A business measure that excludes missing customer IDs needs an explicit rule rather than an assumed default. Microsoft DISTINCTCOUNT documentation
For our defined known customers metric, the missing ID is excluded. Test March, which has no orders in the fixture, and specify whether the presentation should show blank, zero, or a no-data message. Don't silently change the underlying result just to make the card look populated.
5. Order date versus ship date
O104 is ordered on January 31 for 90 and ships on February 2. On an order-date basis, January revenue is 290. On a ship-date basis, January revenue is 200 and February shipped revenue is 260.
The unshipped O107 contributes 30 to February order revenue but to no ship-date month. That is an intentional difference, not a rounding problem.
Record the date role used by each measure and control. Test the boundary order by itself before testing a full month. This isolates a date-path problem from other filters.
6. Ratios and totals
Define average order value as revenue divided by order count. January is 290 ÷ 5 = 58. February is 200 ÷ 3 = 66.67 when displayed to two decimals.
Across both months, the correct result is 490 ÷ 8 = 61.25. Averaging the unrounded monthly averages gives approximately 62.33, which weights a three-order month as heavily as a five-order month.
Specify whether the total recomputes numerator and denominator or averages subgroup values. Keep full precision in the calculation and round for display. Compare numerator, denominator, and final ratio when a test fails.
7. Join grain and duplicate revenue
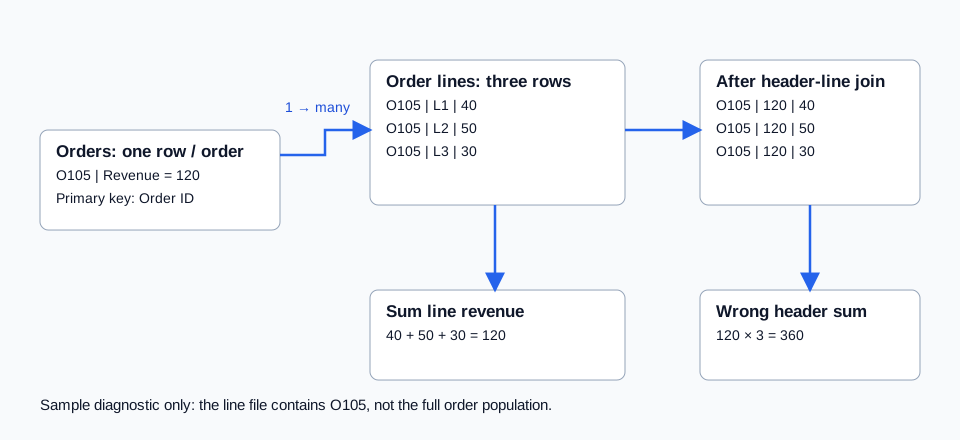
The separate order-lines CSV contains only O105's three lines: 40, 50, and 30. Its order header revenue is 120.
Joining that header to those three rows repeats the header value three times. Summing the repeated header produces 360; summing line revenue produces 120. Neither DISTINCT on the amount nor a cosmetic total adjustment is a reliable general repair.
Keep the measure at its intended grain, or aggregate the child data before joining. Use O105 as a small diagnostic, then test the full relationship with the complete source data.
I would keep these cases in the migration's acceptance record, with source output, target output, and a reviewer. The validation guide explains that record; Power BI-to-Sigma consulting covers applying it to an existing model.
Related
How to plan a Power BI to Sigma migration
Scope a Power BI to Sigma migration around shared models, DAX definitions, data readiness, a representative pilot, and acceptance checks.
Sigma how-toPower BI DAX to Sigma formulas: a practical cheat sheet
Rebuild DAX calculations in Sigma with step-by-step setup, CALCULATE filter patterns, blank-count rules and ratio tests using downloadable sample data.
Migration cutover10 checks before approving a Sigma migration cutover
Review acceptance evidence, permissions, delivery, ownership, recovery, and retirement decisions before switching users from Tableau or Power BI to Sigma.