How to validate a Tableau or Power BI migration to Sigma
Validate a Sigma migration with matched data cutoffs, source-to-target comparisons, filter tests, access checks, and explicit business acceptance.

Greyfield Data

In this article 7 sections
Validate a Sigma migration by comparing the same records, calculations, selections, permissions, and delivery outputs against the source. The first job is to establish a fixed baseline. Otherwise, a source refresh between two screenshots can look like a migration defect.
This guide builds an acceptance record for one small sales workflow. It separates independently calculated expectations from results you still need to collect in Power BI or Tableau and Sigma.
Freeze the population before comparing totals
This guide uses the Greyfield sample orders CSV: eight synthetic orders across January and February 2026. Each row is one order. Revenue is in generic currency units, with no tax, returns, or currency conversion. Dataset notes and calculated expected results are included. The arithmetic was checked independently with SQLite; it is a test specification, not a claim that a migration has passed in all three products.
Use Order Date from January 1 through January 31, inclusive, with all regions selected. The expected baseline is five orders, 290 revenue, and four known customers. Record the source refresh time, target data freshness, date field, time zone, and exclusions.
For timestamp data, define boundaries precisely rather than relying on a date label. A half-open range from the start of January to the start of February avoids dropping records later on January 31. Our CSV uses dates, so time-of-day conversion is not part of this fixture.
Export the qualifying Order IDs from both systems. If the populations differ, resolve that before tuning an aggregate formula. A matching total can conceal different rows.
Compare at more than one level
Check the overall number first, then month, region, product, and individual orders. January East should be 190, January West 100. Across both regions, January product A should be 170 and B should be 120.
Use the difference to narrow the investigation. If every value is exactly tripled after a join, inspect grain. If January is lower by 90 and February higher by 90, inspect O104 and the date role. It was ordered January 31 and shipped February 2.
These are diagnostic clues, not automatic diagnoses. Confirm the actual records and relationships before changing the model.
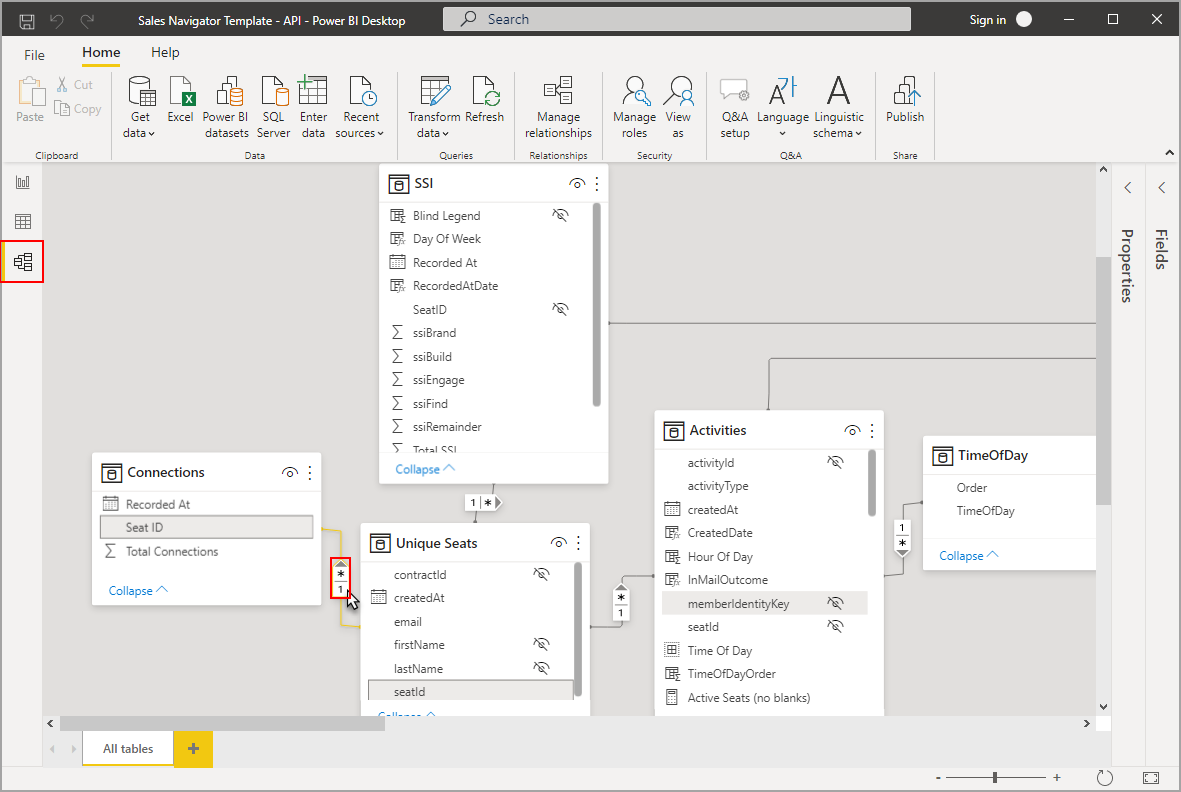
Power BI's Model view exposes relationships that can affect the source calculation. Capture the relevant relationship settings alongside the measure definition. A formula copied without its model context is an incomplete specification.
Give each test a reproducible record
Download the starter acceptance cases. Source and Sigma result fields are intentionally blank, and every case starts Pending.
Use one row per test with these fields: case ID, user role, source version, target version, data cutoff, starting state, action, expected result, source result, target result, evidence location, owner, and status.
For example, VAL-03 starts in January with all regions. Select East. The expected detail is O100, O101, and O104, totaling 190. Clear the selection and expect five orders totaling 290, with January still selected.
Leave the target result empty until someone runs it. “Expected 190” is not “Sigma returned 190.” Use Pending, Pass, Fail, or Approved difference. Record who approved a difference and why, rather than turning a mismatch into a pass.
Test interaction state as well as calculations
Run the workflow from a fresh visit, not only from the builder's current session. Check the landing month, region selection, navigation to detail, back navigation, and reset.
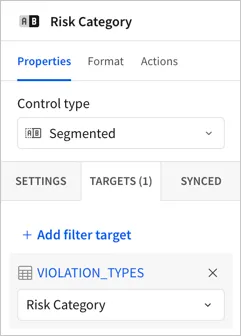
For a Sigma control, inspect its target element and column. In the sample design, month should affect Regional Sales, Product Mix, and Order Detail; region selection should narrow the intended detail views. A control can appear on the page without producing that exact scope.
Also test a selection with no matching records. The page should communicate the agreed no-data state instead of leaving a stale-looking number that users could mistake for the selected population.
Validate permissions with distinct audiences
Define the access rule before testing it. Our proposed acceptance case gives an East reviewer only East records and a West reviewer only West records. This is a requirement to configure and verify, not a security rule implemented by the CSV.
Test each restricted identity in the published target. Inspect the detail rows, totals, navigation destinations, and available exports. Check whether changing a visible region control can expose another region.
A filter is an interaction control; don't treat it as proof of access enforcement. An administrator seeing the correct total also does not prove a restricted user sees the correct subset. Keep access evidence separate from calculation evidence.
Open the actual exported file
For January East, inspect an export containing O100, O101, and O104. Confirm five required fields: Order ID, Order Date, Region, Product, and Revenue. Check types and formatting if a downstream spreadsheet depends on them.
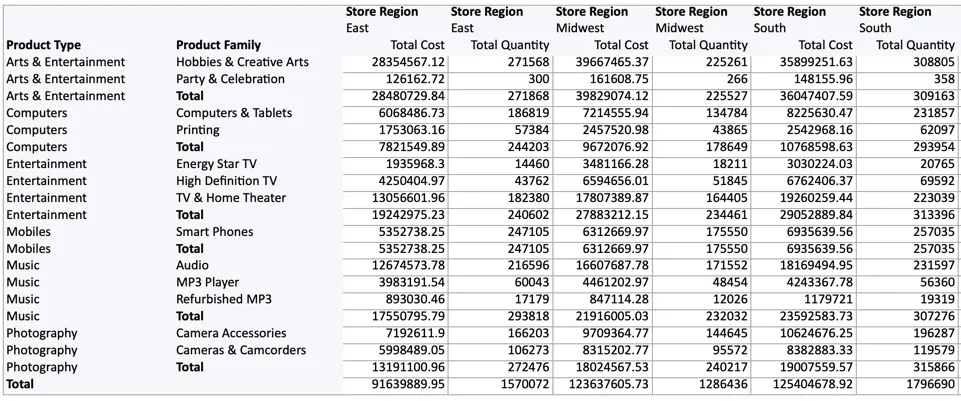
The vendor example shows why output structure matters. Repeated labels can make a pivot export usable as data, while a visually tidy grouped layout may leave cells blank. Agree whether the recipient needs a printable report or a reusable data file.
For scheduled delivery, verify the saved control values, time zone, destination, and received attachment in an authorized test. A successful manual download does not verify a scheduled email.
Define the release decision before results arrive
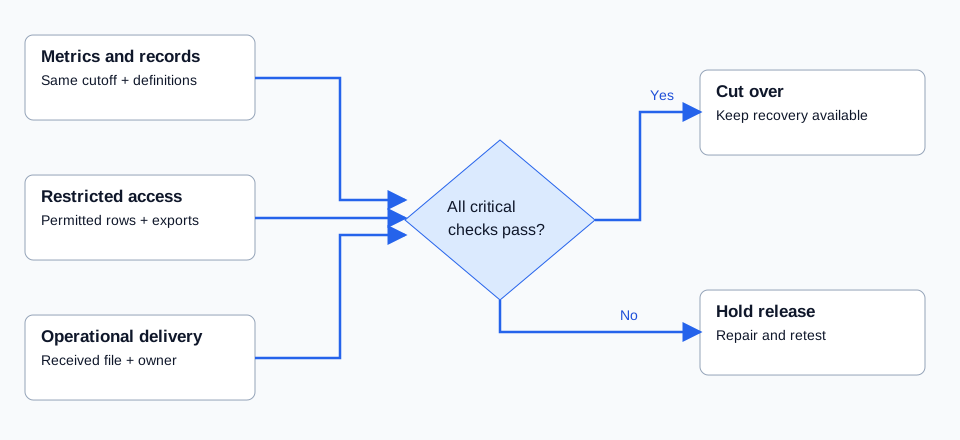
Treat an unexplained material metric difference, an access leak, or a missing critical delivery as a release blocker. A label or spacing issue can be lower priority if it does not change interpretation and the owner accepts it.
Avoid one universal numeric tolerance. Integer order counts should match exactly in this fixture. Currency rounding, floating-point calculations, and approximate methods may require different rules in a real model. Document those rules per measure.
Sigma's migration tools are currently described as beta. Its guidance calls for human review beyond automated comparisons, including filters, layout, and restricted-user access. Sigma migration guidance
The useful handover is the completed acceptance record and unresolved exceptions, not a screenshot of two equal totals. Use the cutover checklist to turn that evidence into a release decision.
Related
10 checks before approving a Sigma migration cutover
Review acceptance evidence, permissions, delivery, ownership, recovery, and retirement decisions before switching users from Tableau or Power BI to Sigma.
Calculation acceptance7 DAX measure tests to define before migrating Power BI to Sigma
Define expected behavior for Power BI measures before rebuilding them in Sigma, including totals, filters, distinct counts, dates, blanks, ratios, and relationships.
Tableau workflow review7 Tableau interactions to review before moving to Sigma
Document how people use Tableau before rebuilding their workflows in Sigma, from filter scope and parameters to actions, tooltips, navigation, and exports.