7 Tableau interactions to review before moving to Sigma
Document how people use Tableau before rebuilding their workflows in Sigma, from filter scope and parameters to actions, tooltips, navigation, and exports.

Greyfield Data

In this article 8 sections
A Tableau dashboard can look familiar after a migration and still send a user to the wrong records. The useful review starts with what someone does: choose a month, select a region, open an order, and export the result. Each step needs a starting state and an expected outcome.
Below is a seven-part review you can run before rebuilding that workflow in Sigma. It follows one small sales example so the filters, calculations, and exports refer to the same data.
Start with three named views and a known baseline
This guide uses the Greyfield sample orders CSV: eight synthetic orders across January and February 2026. Each row is one order. Revenue is in generic currency units, with no tax, returns, or currency conversion. Dataset notes and calculated expected results are included. The arithmetic was checked independently with SQLite; it is a test specification, not a claim that a migration has passed in all three products.
For this walkthrough, define three views: Regional Sales summarizes revenue by region; Product Mix summarizes revenue by product; Order Detail lists individual orders. These are the proposed views for the sample, not unidentified client dashboards.
January has five orders, revenue of 290, and four known customers. East contributes 190 and West contributes 100. Keep those values beside the review worksheet. If the source workbook uses a different definition, resolve that before copying its layout.
1. Filter scope across the dashboard
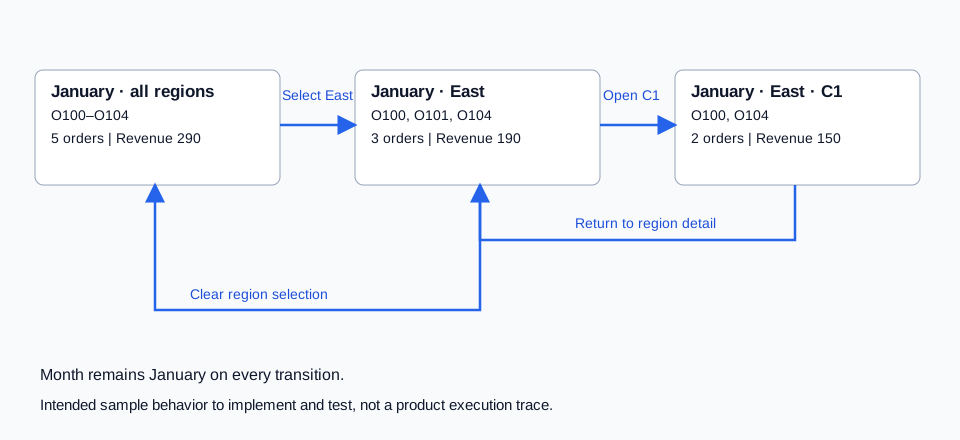
Set the month to January. All three views should use Order Date, not Ship Date. Regional Sales should show East 190 and West 100. Order Detail should contain O100 through O104, with no February orders.
Now select East. Decide which views should change. Our intended design keeps Regional Sales as the region selector while Product Mix and Order Detail narrow to East. The detail table should show O100, O101, and O104, totaling 190.
This is more precise than “the region filter works.” Record the source sheet, destination sheets, field, and expected population. A month filter wired to only two views can leave a plausible but incorrect third view.
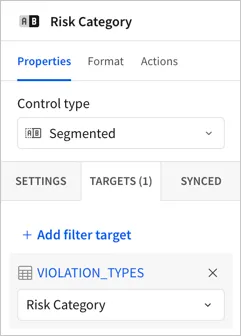
In Sigma, inspect Properties → Targets on the relevant control and check the target column. For this example, a region control must reach the intended elements through their Region field. The documentation screenshot uses Risk Category; it illustrates the configuration panel, not our sales results.
2. Parameters that change the question
Suppose the source has a metric selector for Revenue and Order Count. For January, the two expected values are 290 and 5. After selecting East, they become 190 and 3.
Capture the available parameter values, default, calculation that consumes it, number format, axis title, and tooltip. A selector that changes the numeric result but leaves the label “Revenue” when displaying an order count is still wrong.
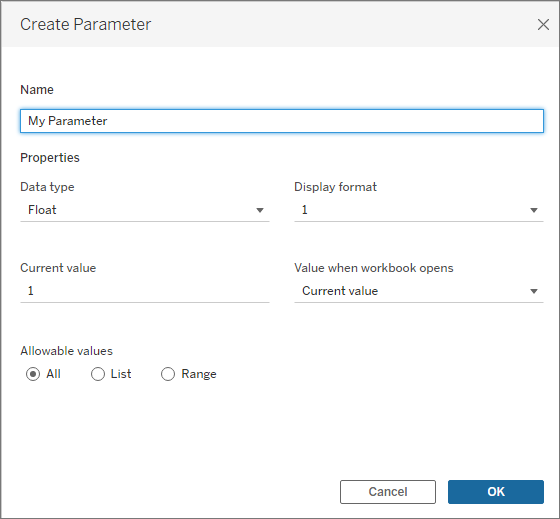
Don't assume every parameter should become a filter. A metric selector changes which expression is evaluated; a region selector changes which records qualify. Agree on the intended target interaction before building it.
3. Selection actions between views
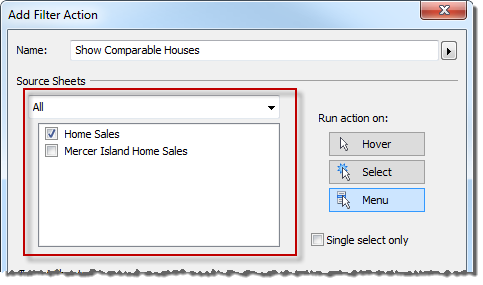
Open the Tableau action definition and record its trigger. Hover, Select, and Menu are different user experiences. A hover action can change the destination before someone intentionally clicks a mark.
For the sample, use a deliberate selection of East. Record what clearing that selection should do: restore both permitted regions while keeping January selected. The detail table should return to five orders and 290.
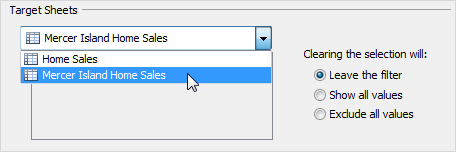
Tableau exposes multiple clear-selection outcomes. Preserve the intended behavior or document an approved redesign. Do not infer the setting from a screenshot of the filtered dashboard. Tableau filter actions
4. Tooltips people use to interpret a number
In January East, product A contributes 150 of the region's 190 revenue, or 78.95% rounded to two decimal places. Product B contributes 40, or 21.05%.
If the tooltip displays revenue, regional revenue, and share, capture all three. A target tooltip showing 100% for A has probably narrowed the denominator to A as well. A denominator of 290 instead answers a different question: share of all January revenue.
Specify what the denominator retains and what it ignores. Here it retains month and region, and ignores the selected product. That definition matters more than matching the tooltip's color.
5. Navigation into detail and back
Start in January East and open customer C1. The detail destination should contain O100 and O104, totaling 150. Returning should restore January East, not an unfiltered landing page.
Record which values travel with navigation and which the destination establishes itself. Also test a direct visit to the detail page, where no prior selection exists. Decide whether that visit should show a prompt, a defined default, or all permitted records.
A working link proves only that the destination opened. Inspect the records it opened with.
6. Sorting and the initial view
In January, product A totals 170 and product B totals 120 across both regions. A descending revenue sort should place A first. In February, B totals 170 and A totals 30, so B should move first.
That two-period check catches a static manual order that happens to look right in January. For ties in the real data, define whether alphabetical order or another secondary rule matters.
Specify the initial month separately. A developer's saved selection isn't a business requirement. Record the landing state and test a fresh visit.
7. Exports and scheduled outputs
For January East, a detail export should contain exactly O100, O101, and O104. Require Order ID, Order Date, Region, Product, and Revenue. The file should make the selected period clear.
Review the file after downloading it. A correct chart doesn't prove the export uses the same population or has the fields a recipient needs. Scheduled delivery needs its own test of recipients, filters, time zone, and attachment.
I would sign off this workflow only after someone can repeat the sequence from a fresh visit and identify the same orders. Use the migration validation guide to record those results, or discuss a Tableau-to-Sigma migration.
Related
How to plan a Tableau to Sigma migration
Plan a Tableau to Sigma migration around workbook dependencies, calculation behavior, source data, a representative pilot, and a controlled rollout.
Sigma how-toTableau to Sigma functions and concepts: a practical cheat sheet
Rebuild Tableau calculations in Sigma with worked FIXED denominator, running-total and parameter examples, copyable formulas and filter-validation steps.
Migration cutover10 checks before approving a Sigma migration cutover
Review acceptance evidence, permissions, delivery, ownership, recovery, and retirement decisions before switching users from Tableau or Power BI to Sigma.