Tableau to Sigma functions and concepts: a practical cheat sheet
Rebuild Tableau calculations in Sigma with worked FIXED denominator, running-total and parameter examples, copyable formulas and filter-validation steps.

Greyfield Data
In this article 9 sections
Tableau's SUM maps to Sigma's Sum, AVG to Avg, and COUNTD to CountDistinct for comparable populated values. A row-level IF becomes Sigma's If. The more important work starts with Tableau's FIXED expressions and table calculations: you need to preserve the data population, grouping and filter behavior, not just rename the function.
This is a formula reference for someone who already knows Tableau. For inventory, sequencing and rollout, use our separate Tableau-to-Sigma migration planning guide.
The visual translation guide
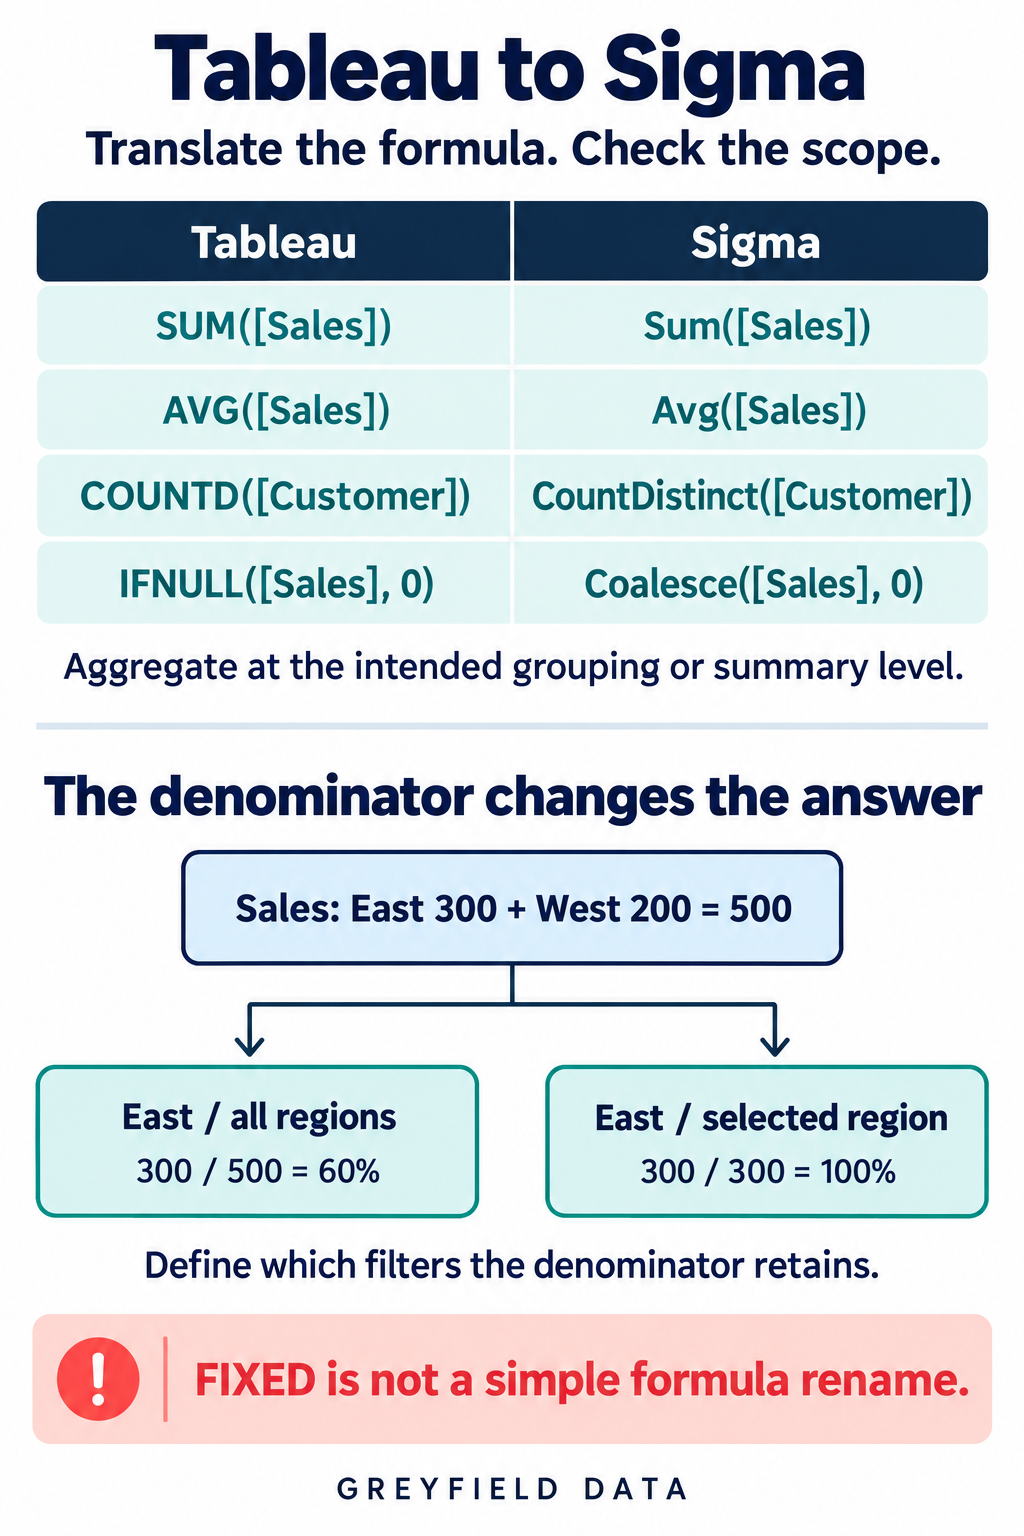
Open the full-size diagram. Each formula is also available as text below.
Start with the same four records
Use the sales CSV from our Excel-to-Sigma guide. One row is one order. It has no missing sales values or repeated order IDs.
| Order | Region | Sales | Cost |
|---|---|---|---|
| O1 | East | 100 | 60 |
| O2 | East | 200 | 140 |
| O3 | West | 50 | 20 |
| O4 | West | 150 | 90 |
Sales total 500, cost totals 310 and profit totals 190. East sales are 300; West sales are 200. These are locally checked example results, not a claim that a Tableau or Sigma workbook has been executed and signed off.
Common formula translations
| Task | Tableau | Sigma |
|---|---|---|
| Total sales | SUM([Sales]) |
Sum([Sales]) |
| Average order sales | AVG([Sales]) |
Avg([Sales]) |
| Unique orders | COUNTD([Order]) |
CountDistinct([Order]) |
| Row profit | [Sales] - [Cost] |
[Sales] - [Cost] |
| Replace a numeric null with zero | IFNULL([Sales], 0) |
Coalesce([Sales], 0) |
Put the aggregates at the intended grouping or summary level. The sample should return 500 total sales, 125 average sales and four unique orders. A correctly spelled Sum([Sales]) in an ordinary ungrouped Sigma table column does not automatically produce a whole-table total. Sigma distinguishes row-level columns, grouping calculations and table summaries. Sigma table calculations and groupings
Tableau's aggregate reference documents SUM, AVG and COUNTD. Sigma documents the corresponding Sum, Avg and CountDistinct functions. Don't turn the count mapping into a blanket promise about missing data: Sigma excludes null and empty values. Test empty strings separately if your source contains them. Tableau aggregate reference
For the numeric null example, use the same numeric type on both sides. Replacing an unknown value with zero changes its business meaning; do it because that is the agreed definition. Tableau logical functions, Sigma Coalesce
Translate a row condition before aggregating
In Tableau, classify orders using:
IF [Sales] >= 150 THEN "Large" ELSE "Small" END
In Sigma:
If([Sales] >= 150, "Large", "Small")
The four outputs are Small, Large, Small and Large. Keep this at order level. Testing total regional sales against 150 answers a different question. Sigma evaluates the conditions in order and returns the value for the first true condition. Sigma If
For conditional sales, a Tableau expression for this populated sample is:
SUM(IF [Region] = "East" THEN [Sales] END)
The Sigma expression is:
SumIf([Sales], [Region] = "East")
Both are intended to return 300 over the full sample. This doesn't restore records already removed upstream. Establish the filtered input before comparing results. Sigma SumIf
FIXED needs a filter contract
A Tableau total-sales LOD expression can be written:
{ FIXED : SUM([Sales]) }
With all four records available, its value is 500. Tableau evaluates FIXED before ordinary dimension filters, but after context filters. That distinction matters when a region selection affects the numerator and not the denominator. Tableau filters and LOD expressions
Suppose the desired question is “What share of all-region sales came from East?” The answer is 300 divided by 500, or 60%. If both numerator and denominator shrink to East, the result becomes 100%.
For a Sigma rebuild, write down the denominator's population first. One possible design uses a separate aggregate source for the all-region total and a selected-region source for the numerator. Both must retain any agreed period restriction. Verify where filters enter each source before connecting the results. This is a design pattern to implement and test, not a universal replacement formula for FIXED.
If your target shows 100%, inspect its denominator and filter placement before changing the display format. If it shows 60% initially but changes after a period selection, check whether the total retained the intended period.
Build a filtered numerator with an independent denominator
Here is a concrete implementation pattern for the 60% example. It preserves the requirement “region changes the numerator; all-region sales remain the denominator.” It is not an automatic translator for every FIXED expression.
Create two table elements, AllOrders and SelectedOrders, from the same four-row source on the same connection. Neither should be sourced from a region-filtered parent. If you later add a period filter, apply it consistently to both. Add a numeric calculated column named Total Key with the value 1 in each table.
In SelectedOrders, add a column named All Region Sales:
Lookup(
  Sum([AllOrders/Sales]),
  [Total Key], [AllOrders/Total Key]
)
The constant key matches each local row to the complete AllOrders population. Lookup's aggregate expression sums that matching population, so the intended value is 500 on every SelectedOrders row. The source field references should be inserted using Sigma's formula autocomplete. Aggregate Lookup
Create a Region control. In Properties → Targets → Add filter target, choose SelectedOrders and explicitly select its Region column. Do not also target AllOrders or a shared ancestor with this Region control. A source-element filter affects downstream elements; duplicating a child of an already filtered source does not recover removed rows. Control targets, Filter propagation
Create this summary in SelectedOrders:
Sum([Sales]) / NullIf(Max([All Region Sales]), 0)
Use Max here because the same denominator is repeated on each selected row. Summing those repeated copies would multiply the denominator. NullIf protects the zero-denominator case; decide separately how an empty selection should display. Sigma Max, NullIf
| Region selection | Selected sales | Denominator | Expected share |
|---|---|---|---|
| All | 500 | 500 | 100% |
| East | 300 | 500 | 60% |
| West | 200 | 500 | 40% |
Check both the summary and the repeated denominator column. If East shows 100%, AllOrders probably inherited the Region restriction. If East shows 30%, inspect whether the two repeated 500 values were summed into 1,000. This pattern preserves ordinary filter scope only; it is not a mechanism for bypassing source access rules.
Table calculations need order and partition rules
A Tableau RUNNING_SUM(SUM([Sales])) depends on the sequence and partition used by the table calculation. Capture those settings before selecting a target implementation. Tableau table calculation functions
For this sample, order by Order ID ascending within each Region and restart at the region boundary. The expected running values are East 100 then 300, and West 50 then 200. A single uninterrupted sequence would instead finish at 500. Matching the last number alone would miss the restart rule.
Keep a small acceptance record: input rows, ordering, partition, selected filters, expected values and observed values. Leave observed results blank until you run the target workbook.
Rebuild the running total in Sigma
For the four-record example, group a table by Region, keep Order and Sales at the detail level, and sort Order ascending within each Region. Add a detail-level calculated column:
CumulativeSum([Sales])
Sigma's cumulative functions depend on row order and restart for groupings above the calculation level. Here, the Region grouping creates the restart boundary. CumulativeSum
| Region | Order | Sales | Running sales |
|---|---|---|---|
| East | O1 | 100 | 100 |
| East | O2 | 200 | 300 |
| West | O3 | 50 | 50 |
| West | O4 | 150 | 200 |
Now reverse Order within each region. East should show O2 at 200 and O1 at 300; West should show O4 at 150 and O3 at 200. This is a useful deliberate test: a running result that doesn't respond to the intended sort warrants inspection.
For a real dashboard, use the actual business ordering, such as date followed by a unique order ID. Tied dates need a deterministic secondary key if the running value is required per order. If the Tableau calculation runs over daily totals, first build the daily aggregate in Sigma and apply the cumulative calculation at that level. Running raw order rows and running daily totals are different displays.
A parameter and a filter do different jobs
For a Revenue versus Order Count selector, use a single-value control as a formula parameter rather than filtering the source's sales values. Set its Control ID to metric-choice, with Revenue as the initial choice and Order Count as the other allowed value. A Sigma control can be referenced without filter targets. Control parameters
At the intended aggregate level, use:
If(
  [metric-choice] = "Revenue", Sum([Sales]),
  [metric-choice] = "Order Count", CountDistinct([Order]),
  Null
)
Choose Revenue over the full sample and expect 500; choose Order Count and expect four. With a separate Region filter set to East, expect 300 and two. Update the visible label and format as well, so an order count is not presented as currency. Inspect the source Tableau parameter's allowed values and default before adding extra choices in the target.
The Tableau interaction checklist covers controls and navigation around these calculations. If you want help translating a workbook, bring its calculation definitions and one trusted output to a Tableau-to-Sigma assessment.
Download the validation checklist to record expected and observed results, filters, data cutoff and review evidence for these examples.
Related
Power BI DAX to Sigma formulas: a practical cheat sheet
Rebuild DAX calculations in Sigma with step-by-step setup, CALCULATE filter patterns, blank-count rules and ratio tests using downloadable sample data.
Sigma how-toExcel to Sigma functions: a practical formula cheat sheet
Translate Excel formulas into Sigma with step-by-step setup, lookup diagnostics, monthly date filters, conditional totals and downloadable validation examples.
Tableau workflow review7 Tableau interactions to review before moving to Sigma
Document how people use Tableau before rebuilding their workflows in Sigma, from filter scope and parameters to actions, tooltips, navigation, and exports.