How to plan a Tableau to Sigma migration
Plan a Tableau to Sigma migration around workbook dependencies, calculation behavior, source data, a representative pilot, and a controlled rollout.

Greyfield Data

In this article 8 sections
A Tableau-to-Sigma migration plan needs to preserve the questions and workflows behind a workbook, not just its appearance. Start by connecting dashboards to their worksheets, data sources, calculations, and actions. Then choose a small workflow you can test from beginning to end.
This guide follows a sales dashboard with a month selection, a region chart, a product breakdown, and order detail. The aim is a useful replacement with an explicit acceptance standard.
Inventory the workbook below the dashboard level
List each dashboard and its underlying worksheets. For every sheet, record the data source, important calculations, filters, parameters, and actions. Identify hidden or supporting sheets that still contribute to tooltips or navigation.
Give each dashboard a business owner and a reason to exist. A weekly operational view, a quarterly board export, and an embedded customer view have different delivery obligations even if their charts look similar.
Our sample has Regional Sales, Product Mix, and Order Detail. Month affects all three. Selecting a region narrows the latter two. That description is a starting workflow contract; it is not proof that any particular source workbook already behaves that way.
Fix the data and its definitions first
This guide uses the Greyfield sample orders CSV: eight synthetic orders across January and February 2026. Each row is one order. Revenue is in generic currency units, with no tax, returns, or currency conversion. Dataset notes and calculated expected results are included. The arithmetic was checked independently with SQLite; it is a test specification, not a claim that a migration has passed in all three products.
January has five orders and 290 revenue. East contributes 190 and West 100. Order O104 is deliberately near a month boundary: ordered January 31 for 90, shipped February 2.
Identify whether the source report uses order date, ship date, or another business date. Record refresh timing and the data cutoff. If a workbook uses an extract, establish how its underlying data and preparation will become available to Sigma.
The migration tools do not remove the need for a usable target data source. Sigma's documented workflow requires the source data in a connected platform. Sigma migration requirements
Review calculations in the context of the view
Capture the calculation definition and where it is used. For calculations whose result depends on grouping or the view, record the dimensions, partitions, sort order, and filters that produce the accepted result.
In the sample, January East product A is 150 of 190 revenue, or 78.95%. Decide whether the percentage should mean share within the selected region or share across all regions. Those are different denominators.
Distinct customers provide another useful check: January has four known customers, February two, and both months together five. Summing month-level results would change that meaning.
Don't accept a simpler target formula solely because its grand total matches. Use selected states that distinguish the intended definition from plausible alternatives.
Capture parameter behavior before replacing controls
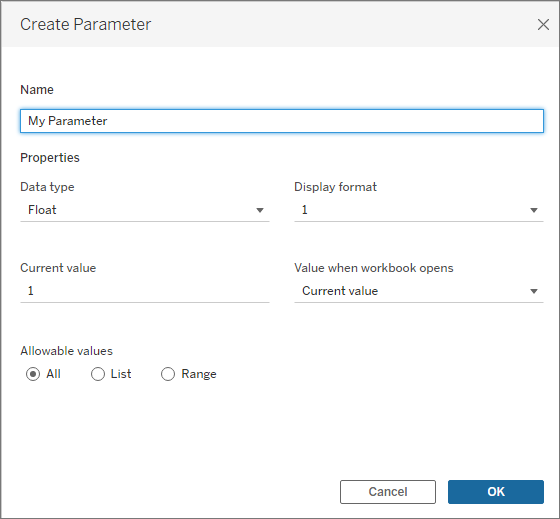
For a metric selector, record allowed choices, the initial choice, the calculations that consume it, and presentation changes such as axis titles and currency formatting.
Our proposed selector switches between Revenue and Order Count. January should display 290 or 5; January East should display 190 or 3. A control that changes the number but leaves an incorrect title is an incomplete migration.
Agree whether the Sigma design should reproduce the interaction or replace it with a clearer one. Document an approved redesign rather than promising identical behavior from different products.
Trace the actions between sheets
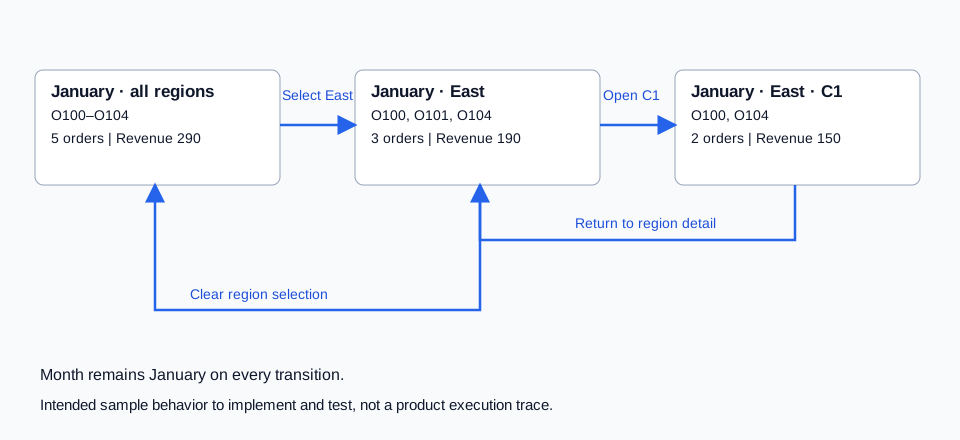
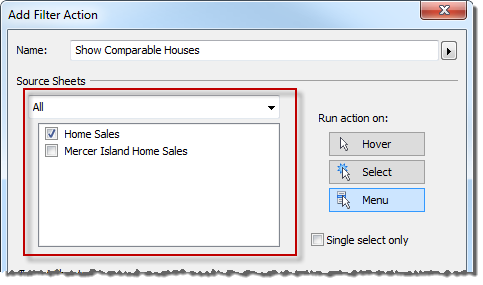
A Tableau filter action has a source, trigger, and destination. Record each, including what happens when the selection is cleared. An action launched from a menu is different from an action triggered by hovering over a mark.
For the sample, selecting East should show O100, O101, and O104 in detail. Clearing the selection should restore all five January orders and retain January. Opening customer C1 should narrow detail to O100 and O104.
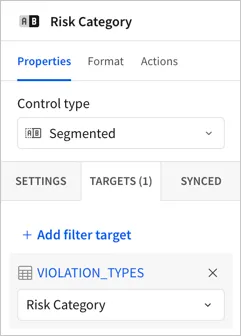
In the target, inspect the controls and their intended targets. The Sigma documentation example shows a target table and column. Use that same discipline to check which elements your region and month controls actually affect.
Include the outputs people rely on
Ask how users consume the workbook outside the browser. Record emailed files, exported detail, subscriptions, links in other applications, and any embedded use.
For January East, the sample detail export should have three Order IDs and revenue of 190. Define required fields and whether recipients need a printable page or a machine-readable table. Review the resulting file, not just the on-screen chart.
Keep the schedule's time zone, recipients, period selection, and delivery owner in the plan. These are operational requirements that can be missed by a dashboard-only inventory.
Use one workflow as the pilot
Choose an owned workbook with a trusted baseline and a manageable set of dependencies. Complete the data mapping, calculations, controls, navigation, exports, and review for that one workflow.
Log conversion exceptions and the effort to resolve them. Record the tool version used if you use automated migration, because the currently documented workflow is beta and can change.
Treat the pilot as evidence about the features it exercised. A successful sales view does not establish that complex table calculations, an embedded deployment, or production-scale performance will work without further investigation.
Build the rollout around shared dependencies
Group the remaining workbooks by common data sources and calculation definitions. Resolve those shared pieces before estimating each dashboard as an isolated task.
Give each wave an owner, data-ready condition, review slot, acceptance record, and recovery route. Keep the old source available until its consumers and scheduled outputs have been accounted for.
The seven-interaction review provides the detailed user tests. The validation guide turns them into evidence. For a project discussion, bring one workbook and its data-source details to a Tableau-to-Sigma assessment.
For formula-level examples, use the Tableau-to-Sigma functions cheat sheet, including the filter behavior behind FIXED expressions.
Related
7 Tableau interactions to review before moving to Sigma
Document how people use Tableau before rebuilding their workflows in Sigma, from filter scope and parameters to actions, tooltips, navigation, and exports.
Sigma how-toTableau to Sigma functions and concepts: a practical cheat sheet
Rebuild Tableau calculations in Sigma with worked FIXED denominator, running-total and parameter examples, copyable formulas and filter-validation steps.
Migration cutover10 checks before approving a Sigma migration cutover
Review acceptance evidence, permissions, delivery, ownership, recovery, and retirement decisions before switching users from Tableau or Power BI to Sigma.