Which dashboards should you migrate, consolidate, or retire before moving to Sigma?
Prioritize Tableau and Power BI reports for a Sigma migration using business ownership, usage context, shared definitions, and downstream dependencies.

Greyfield Data

In this article 9 sections
Decide whether to migrate, consolidate, or retire a dashboard by reviewing its business purpose, consumers, definitions, dependencies, and outputs. Low recent usage is a signal to investigate. It is not sufficient evidence that the report is unnecessary.
The goal is to avoid recreating duplicate work while preserving the reporting people still depend on. Use a decision record for each source so that consolidation and retirement are deliberate choices.
Start with a workflow, not a screenshot count
Our sample workflow contains Regional Sales, Product Mix, and Order Detail. These could be three pages in one workbook or several source reports. The layout alone does not establish whether they should be combined.
This guide uses the Greyfield sample orders CSV: eight synthetic orders across January and February 2026. Each row is one order. Revenue is in generic currency units, with no tax, returns, or currency conversion. Dataset notes and calculated expected results are included. The arithmetic was checked independently with SQLite; it is a test specification, not a claim that a migration has passed in all three products.
The common data has January revenue of 290 across five orders. The views answer different questions: which region contributes revenue, which products contribute within a region, and which individual orders explain the result.
Those questions share a source and can form one connected experience. They still require separate interaction and acceptance checks.
Build an inventory with an accountable owner
For each report, capture its link, owner, users, purpose, source model, important definitions, last-known use, and recurring outputs. Include links from other applications and spreadsheets that consume exports.
Record the usage observation window and any gaps in measurement. A quarterly process may not appear in a one-month view. A scheduled attachment can have readers who never open the source report.
Ask the owner what would stop working if the report disappeared. That question often reveals a dependency that a page-view count misses.
Map the shared data before combining reports
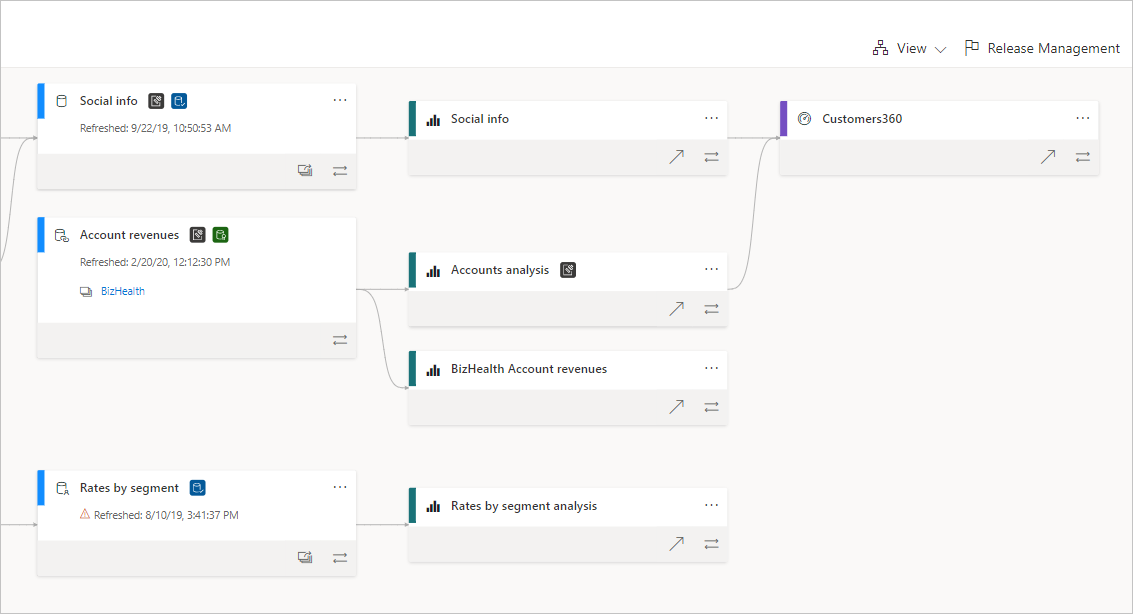
Power BI lineage helps identify models with several dependent reports. Treat that as a technical map, then add the business owners and consumer workflows.
Two reports using the same model may still serve different audiences or delivery needs. Two reports that look alike may calculate revenue differently. Consolidation requires agreement about those differences.
For Tableau, map the shared data source as well as the worksheets and actions. A dashboard may depend on supporting sheets that are not obvious in its main view.
Migrate when the purpose remains distinct and necessary
Keep a distinct report or experience when it supports a specific task, audience, access rule, or output that the target needs to preserve.
For example, Order Detail might need a downloadable row-level file for an operations review. Regional Sales might be a concise interactive overview. Both can share a model without forcing their users into the same page.
Define the replacement's acceptance criteria. In the sample, January East detail must contain O100, O101, and O104, totaling 190. That requirement is more useful than “make the old detail report in Sigma.”
Consolidate when the questions and definitions align
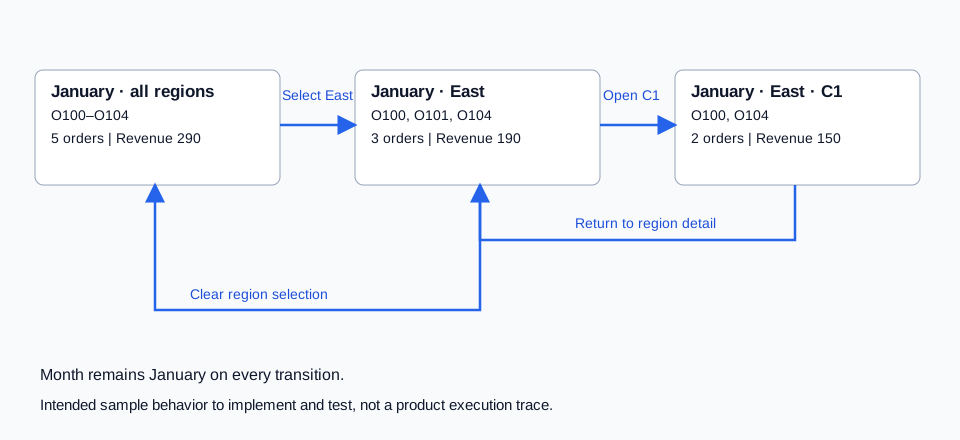
A strong consolidation candidate has shared data, compatible definitions, overlapping users, and a clear navigation path. The target should reduce duplicated logic or repeated user steps.
The sample's three views can form a workflow: choose January, select East, inspect product A, and open the relevant orders. Revenue and date definitions should stay consistent through that path.
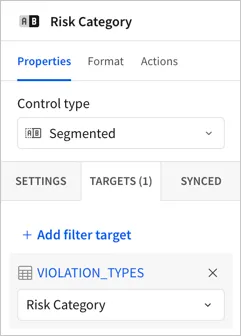
The target-control configuration matters when combining views. A control on a consolidated page needs the intended targets; simply placing several charts together does not make their behavior coherent.
Test the consolidated experience with users. If they now need extra clicks to perform a frequent task, the new design may have reduced report count while making the work harder.
Do not consolidate conflicting definitions silently
Suppose one source reports revenue by Order Date and another reports shipped revenue. O104 is ordered January 31 for 90 and ships February 2. The two reports correctly put it in different periods.
Combining them into one unlabeled Revenue measure would remove an important distinction. Keep separately named measures or views if both questions remain valid.
Likewise, January has four known customers and February two, but the two-month distinct count is five. A consolidated total needs to recompute the agreed definition, not add the source summaries because they are convenient.
Retire only after checking indirect consumers
Retirement is appropriate when the purpose is no longer needed or a verified replacement covers it, and the accountable owner agrees. Document the decision and the dependencies checked.
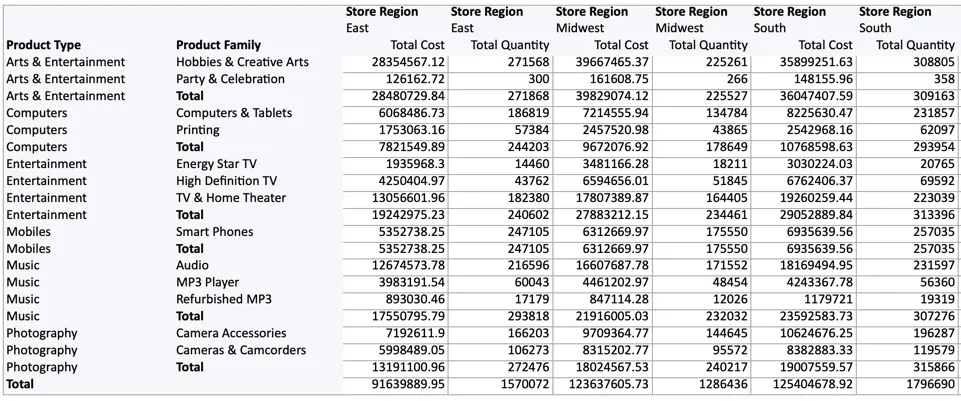
Exports deserve particular attention. A report with few interactive views may produce a file used every week. Inspect the actual recipient workflow before calling the source unused.
Check subscriptions, embedded links, scheduled files, shared bookmarks, and downstream calculations. Keep a record of the replacement location and who confirmed it works.
Use a decision record with a reversible transition
For each item, record the proposed disposition, reason, owner, replacement, outstanding dependency, acceptance evidence, and intended retirement date or condition.
Use a transitional state such as “replacement accepted, retirement pending” when users still need time to move. Keep the recovery route available for the agreed period and follow the organization's retention policy.
Do not delete source content as part of an inventory exercise. A decision to stop rebuilding a report and a decision to permanently remove it are separate actions.
Validate the new collection as a user journey
After grouping the work, test the whole route rather than each view alone. Start from the link users will receive, apply a selection, inspect detail, and produce the required output.
The result should be fewer duplicate definitions and clearer ownership, with necessary tasks still intact. Report count can decrease, remain unchanged, or occasionally increase if separating incompatible workflows makes the system easier to use.
Use the assessment guide to collect the evidence and the Tableau interaction review to test the consolidated workflow before approving retirement.
Related
What should a Sigma migration assessment include?
A useful Sigma migration assessment identifies assets, dependencies, data gaps, calculation risks, a representative pilot, and acceptance criteria.
Migration cutover10 checks before approving a Sigma migration cutover
Review acceptance evidence, permissions, delivery, ownership, recovery, and retirement decisions before switching users from Tableau or Power BI to Sigma.
Calculation acceptance7 DAX measure tests to define before migrating Power BI to Sigma
Define expected behavior for Power BI measures before rebuilding them in Sigma, including totals, filters, distinct counts, dates, blanks, ratios, and relationships.