What should a Sigma migration assessment include?
A useful Sigma migration assessment identifies assets, dependencies, data gaps, calculation risks, a representative pilot, and acceptance criteria.

Greyfield Data

In this article 7 sections
A Sigma migration assessment should leave you with a source inventory, a data-readiness decision, a list of calculation and interaction risks, a proposed pilot, and an estimate whose assumptions are visible. A slide saying “these dashboards are complex” is not enough to start delivery.
The practical test is whether another builder can use the assessment to reproduce the source baseline and understand what must be delivered. Here is what I would ask to see, using one sales workflow as a concrete example.
1. A connected inventory of source objects
Record reports or workbooks separately from their shared models and data sources. Include source links, owners, consumers, update cadence, and delivery channels. Keep an explicit relationship between a report and the model that supplies it.
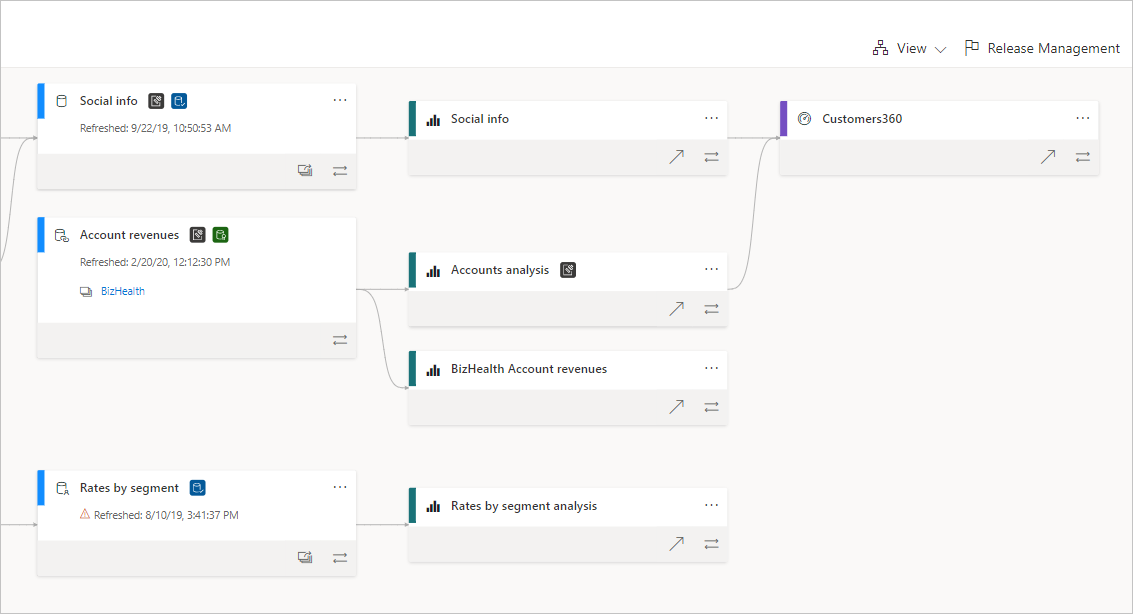
Power BI lineage is useful for discovering shared dependencies. The documentation image illustrates why several reports can depend on one model. It does not tell you which report a business team still needs; that requires owner review.
For Tableau, collect dashboards, worksheets, data sources, calculations, parameters, and actions. Identify supporting sheets and outputs that a visual inventory could overlook.
The sample assessment contains one order source and three views: Regional Sales, Product Mix, and Order Detail. That is one shared data definition plus three user experiences to review.
2. A data mapping with unresolved items visible
This guide uses the Greyfield sample orders CSV: eight synthetic orders across January and February 2026. Each row is one order. Revenue is in generic currency units, with no tax, returns, or currency conversion. Dataset notes and calculated expected results are included. The arithmetic was checked independently with SQLite; it is a test specification, not a claim that a migration has passed in all three products.
Map each of the seven fields to its source and proposed target location. Record type, null behavior, transformation, freshness expectation, and owner. For a real source, include Power Query steps, custom SQL, extracts, and file-based preparation where relevant.
O107's missing Customer ID should not be silently replaced by a new customer. Its missing Ship Date should not become its Order Date merely to eliminate blanks. Both changes would alter the tests.
Classify each required source as ready, needs preparation, or blocked. A missing target table is a concrete dependency, not a footnote to the dashboard estimate.
3. A measure dictionary with test cases
For each important measure, record its business question, formula or source definition, grain, date role, exclusions, and expected selected-state results.
For this sample, Revenue is additive at the order grain. Known Customers is a distinct count excluding blank IDs. Average Order Value is Revenue divided by Order Count.
January's expected results are 290 revenue, five orders, four known customers, and average order value of 58. Across both months, known customers is five, not the sum of monthly counts. That distinction belongs in the assessment before conversion starts.
Also document unresolved definitions. If two teams disagree about whether an unshipped order belongs in revenue, the assessment should identify the decision owner and affected reports.
4. A workflow map with intended behavior
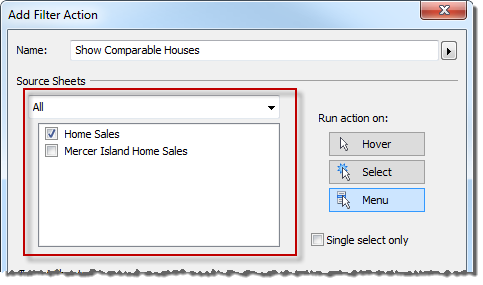
Record what happens after a selection, what receives the filter, and what happens after clearing it. For the sample, selecting East in January should narrow Order Detail to O100, O101, and O104. Clearing East should restore all five January orders.
Capture navigation destinations, default filters, tooltips, sort order, and exports. Mark each behavior as reproduce, redesign, investigate, or retire with owner approval.
The output should include an actual test sequence, not only a count of actions. “Select East, open C1, return, clear East” identifies four transitions that can be reviewed.
5. An access and delivery inventory
Document who may see which records and columns, where the rules are enforced, and which identities must be used for testing. Include exported data, not just workbook access.
A proposed East-only reviewer in the sample should never receive West records. That is an acceptance requirement, not security implemented in our downloadable CSV. The project must configure and test it in the actual environment.
For each scheduled output, record destination, owner, time zone, frequency, period selection, format, and downstream consumer. Ask for an example received file when someone says a report is “just emailed weekly.”
6. A pilot with a bounded question
Choose a source that exercises common risks and has an available reviewer. The sample pilot checks the shared model, a distinct count, a date boundary, region selection, detail navigation, and an export.
State its exclusions. It does not test production volume, embedded identity, complex finance rules, or every calculation type in the estate.
Sigma's documented migration tooling includes a read-only assessment step, followed by migration work and human review. Keep the inventory output distinct from proof that content has migrated successfully. Sigma migration workflow
7. An estimate and decision log you can challenge
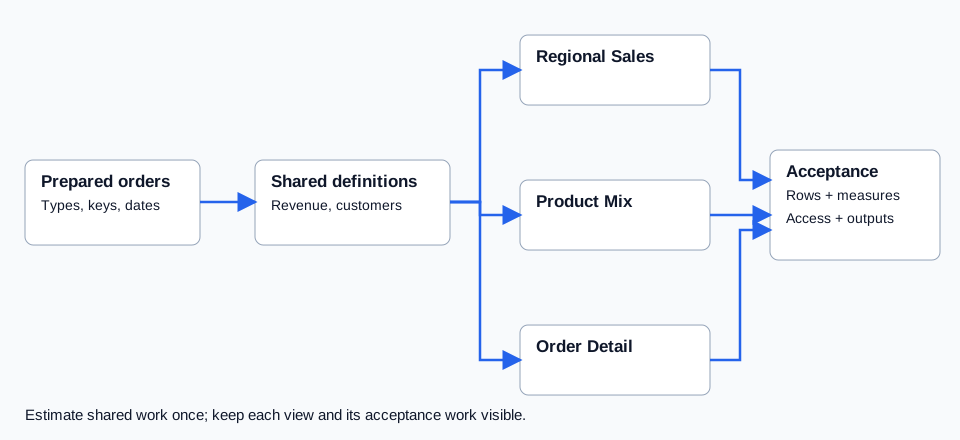
Separate data preparation, model work, report work, validation, access, and handover. Explain what the pilot measured and what remains assumed.
Each open issue needs an owner, a next action, and an effect on scope or timing. For example: “Order Date definition agreed; shipment-date measure still needs review” is actionable. “Data quality risk” is not.
The assessment should end with a recommended first wave, acceptance criteria, and a decision about sources that cannot yet move. It should also identify anything worth consolidating rather than copying.
For a concrete next step, use the pilot selection tests and validation record. Bring the resulting inventory to a Power BI or Tableau migration discussion.
Related
Which dashboards should you migrate, consolidate, or retire before moving to Sigma?
Prioritize Tableau and Power BI reports for a Sigma migration using business ownership, usage context, shared definitions, and downstream dependencies.
Migration cutover10 checks before approving a Sigma migration cutover
Review acceptance evidence, permissions, delivery, ownership, recovery, and retirement decisions before switching users from Tableau or Power BI to Sigma.
Calculation acceptance7 DAX measure tests to define before migrating Power BI to Sigma
Define expected behavior for Power BI measures before rebuilding them in Sigma, including totals, filters, distinct counts, dates, blanks, ratios, and relationships.