8 tests for choosing a useful Sigma migration pilot
Choose a Power BI or Tableau migration pilot that tests important calculations, shared dependencies, user workflows, and acceptance without becoming the whole project.

Greyfield Data

In this article 9 sections
Choose a Sigma migration pilot that is small enough to finish and representative enough to expose the work ahead. The simplest dashboard can give false confidence; the most complicated one can turn the pilot into an open-ended project.
Use the eight tests below to choose a source report and define what its result will establish. A pilot is useful when it reduces uncertainty about the next wave, including the parts that still require manual work.
Use a specific candidate rather than a complexity label
Our candidate is a sales workflow with Regional Sales, Product Mix, and Order Detail. Users choose a month, select a region, inspect orders, and export detail.
This guide uses the Greyfield sample orders CSV: eight synthetic orders across January and February 2026. Each row is one order. Revenue is in generic currency units, with no tax, returns, or currency conversion. Dataset notes and calculated expected results are included. The arithmetic was checked independently with SQLite; it is a test specification, not a claim that a migration has passed in all three products.
The proposed pilot has five January orders totaling 290. Selecting East should show three orders totaling 190. Those facts give the reviewer a baseline and make the test repeatable.
Do not label a report “medium complexity” without saying why. State which dependencies, calculations, interactions, and consumers make it informative.
1. Is there a reviewer who can accept the result?
Name the person who owns the business definition and the person who can test the workflow. Reserve a review window before building.
For the sample, the reviewer needs to decide whether Revenue follows Order Date or Ship Date and whether missing Customer IDs are excluded from Known Customers. A technically available report without an available decision owner will stall on those questions.
Ask the reviewer to describe the task in their own words. If the team cannot explain what a user does with the report, the pilot is not yet well scoped.
2. Can you reproduce the source baseline?
Capture a fixed data cutoff, filters, and version. Export the qualifying records. January should contain O100 through O104 and total 290 in this fixture.
If the existing source report is already disputed, resolve or document that dispute. Matching an untrusted source result is not the same as establishing a correct business result.
Keep expected values separate from observed source and target values. A spreadsheet containing planned answers is a test specification, not completed evidence.
3. Does it exercise shared data and model work?
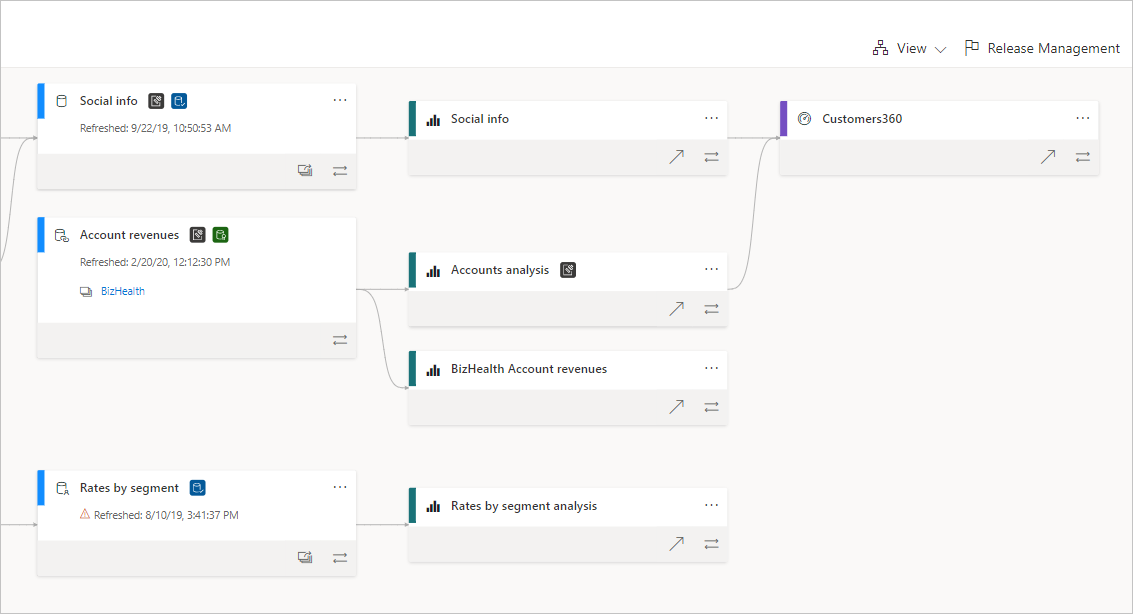
Prefer a candidate whose dependencies appear elsewhere in the estate. The Power BI lineage example shows how one shared model can feed multiple reports. Investigating that shared model can inform more than one subsequent rebuild.
For the sample, the common order source supplies all three views. Define Revenue once, then check it across the views. If every target view has its own unrelated logic, the pilot may hide the shared modeling work needed later.
Also record exceptions. A pilot on one well-prepared table cannot establish readiness for models with substantial local data preparation.
4. Does it include a calculation that can fail plausibly?
A plain sum is useful but insufficient. Include a distinct count, ratio, date role, or other behavior common to the real source.
Our sample has January Known Customers of four and February Known Customers of two, but five across both months. It also has January average order value of 58 and a combined-period value of 61.25.
Those cases distinguish correct semantics from summing or averaging preaggregated values. Choose tests because they represent your source, not because they make an impressive checklist.
5. Does it cover an actual user interaction?
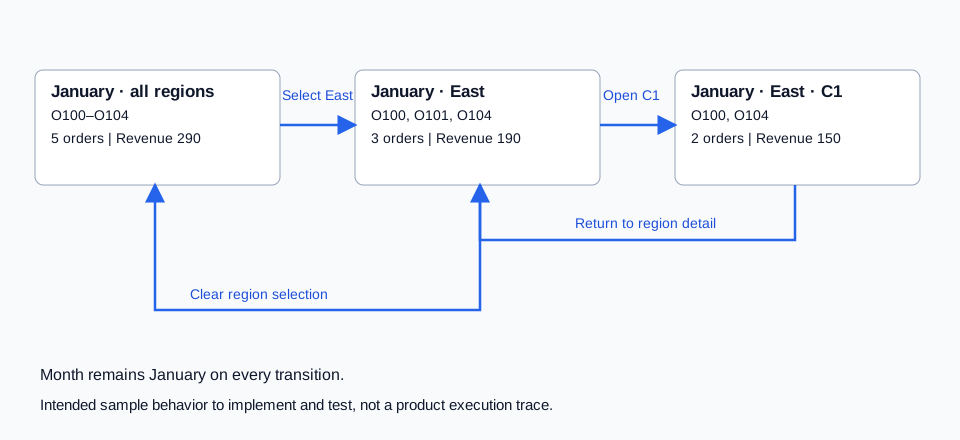
Include a selection that changes another view and a reset that returns to a defined state.
For January East, require Order Detail to show O100, O101, and O104. Clear the region and require all five January orders. Keep the month unchanged. Then open customer C1 and verify the two relevant orders.
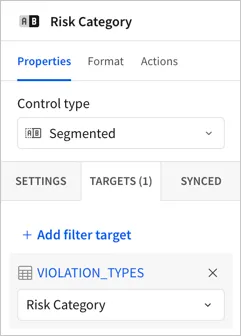
The Sigma screenshot shows the target configuration to inspect. It does not demonstrate that this sales test has passed. The pilot must collect that evidence from the built workbook.
6. Can access and outputs be tested safely?
If the real estate uses restricted audiences or scheduled delivery, include a representative case with authorized test identities and recipients.
Define the expected restricted subset before configuring it. An East-only reviewer should not see West records in the workbook or exported detail. A manual region selection alone is not a security test.
Review a downloaded file with the intended columns and selected period. If scheduled delivery is in scope, validate a received test attachment. Otherwise, mark that part untested rather than assuming the manual export proves it.
7. Can you finish without unrelated dependencies?
List prerequisites: source access, data platform access, target connection, agreed definitions, and reviewer availability. Give each an owner.
If a missing pipeline is a common migration dependency, including it can be valuable. If it is an unrelated system replacement, it may obscure the pilot's purpose. Separate the two decisions.
Set a bounded exception policy. A calculation that cannot be reproduced should produce an explained gap and a decision, not an undisclosed simplification.
8. Will the output change the next estimate?
Track effort by data preparation, model work, report build, review, fixes, and handover. Include waiting time separately from hands-on time.
A useful outcome says which patterns were reusable, which required redesign, and which remain unknown. It should change the scope or confidence of the next wave.
I would choose this sample-sized workflow over either a single static chart or an entire reporting estate. Use the assessment deliverables to prepare it and the cutover checks to decide when a real replacement is ready.
Related
10 checks before approving a Sigma migration cutover
Review acceptance evidence, permissions, delivery, ownership, recovery, and retirement decisions before switching users from Tableau or Power BI to Sigma.
Calculation acceptance7 DAX measure tests to define before migrating Power BI to Sigma
Define expected behavior for Power BI measures before rebuilding them in Sigma, including totals, filters, distinct counts, dates, blanks, ratios, and relationships.
Tableau workflow review7 Tableau interactions to review before moving to Sigma
Document how people use Tableau before rebuilding their workflows in Sigma, from filter scope and parameters to actions, tooltips, navigation, and exports.