Year-Over-Year Comparison in Sigma: Formulas and Partial Periods
How to build year-over-year and period-over-period comparisons in Sigma with DateLookback and the guided workflow, and how to compare a partial month fairly.

Written by Linus Tse, founder of Greyfield Data
· 7 min read
On this page 9 sections
"How are we doing against last year?" is the most common question a dashboard gets. In Sigma there are three ways to answer it: a guided period-over-period column, a DateLookback formula, or a SumIf with date ranges for partial periods. Each fits a different case.
The formula is rarely the hard part. The mistake is comparing nine days of this month with all of last year's month. If you'd like help building comparison reports your team trusts, that's part of our Sigma Computing consulting work.
Key takeaways
- Sigma's period-over-period workflow adds a comparison column from the column menu: Add column via > Period over period comparison. It can return the difference, the % difference, or the prior value.
- Under the hood it uses DateLookback, which returns a value from an earlier period:
DateLookback([Revenue], [Month of Date], 1, "year"). DateLookbackworks best on a grouping by a truncated date with one value per date. Extra columns in the same grouping, or custom fiscal years, can make it return Null.- For a partial month, compare like with like: this month to date against the same days last year, using
SumIfwithInDateRange,InPriorDateRangeandDateAdd. Lagreturns the previous row, not the previous period. If a month is missing, the comparison shifts.
What is the quickest way to compare year over year in Sigma?
The quickest way is the built-in period-over-period comparison. It builds the formula for you from a few choices, and it works in tables, pivot tables and charts.
- Open the workbook in Explore or Edit mode and select the table.
- Click the caret on the
Revenuecolumn, hover Add column via, and select Period over period comparison. - In Add comparison, set Compare field to
Revenue, Aggregate to Sum, Using date column toOrder Date, and Comparison time frame to Same month last year. - Under Output, pick Value, Difference, % difference, or more than one. Sigma adds a column for each.
In a table, Sigma creates a grouping on the month with the period value and comparison columns. In a pivot table or chart, it adds the columns to the underlying data so you can place them. Sigma suggests a KPI chart for showing the result.
The time frame options depend on the date grain. A monthly comparison offers Last month, Same month last quarter and Same month last year, and not options that wouldn't compare equal periods.
How do you write a year-over-year formula with DateLookback?
Use DateLookback when you want control over the formula, or want to see it. The syntax is DateLookback(value, date, amount, period).
Group a table by month with DateTrunc("month", [Order Date]) and add Monthly Revenue as Sum([Revenue]). Then add two columns in the same grouping:
DateLookback([Monthly Revenue], [Month of Order Date], 1, "year")
Call it Revenue LY. Then the change:
([Monthly Revenue] - [Revenue LY]) / [Revenue LY]
Format it as a percent and call it YoY %. For month over month, change the last two arguments to 1, "month". For quarter over quarter, group by quarter and use "quarter".
Here is the result on synthetic monthly revenue. The numbers are made up.
| Month | Monthly revenue | Revenue LY | YoY % |
|---|---|---|---|
| Sep 2026 | $528,000 | $480,000 | +10.0% |
| Oct 2026 | $540,500 | $505,000 | +7.0% |
| Nov 2026 (to Nov 9) | $151,000 | $520,000 | -71.0% |
The first two rows are right. The third is wrong, and the next section is about it.
When DateLookback returns Null
Sigma's DateLookback page lists the cases:
- No data in the lookback period. The first year of data has nothing to look back to.
- More than one value per date. If the grouping holds
MonthandRegiontogether, there are several values for each month. Group by date only, and moveRegionto a separate grouping. - Period smaller than the grouping. A table grouped by day can't look back one hour.
- Custom fiscal calendars. Sigma suggests Lookup instead when the grouping uses fiscal year logic.
How do you compare a partial month or year fairly?
Compare the same number of days in each period. On November 9, 2026, this month has nine days of sales. Last November has thirty.
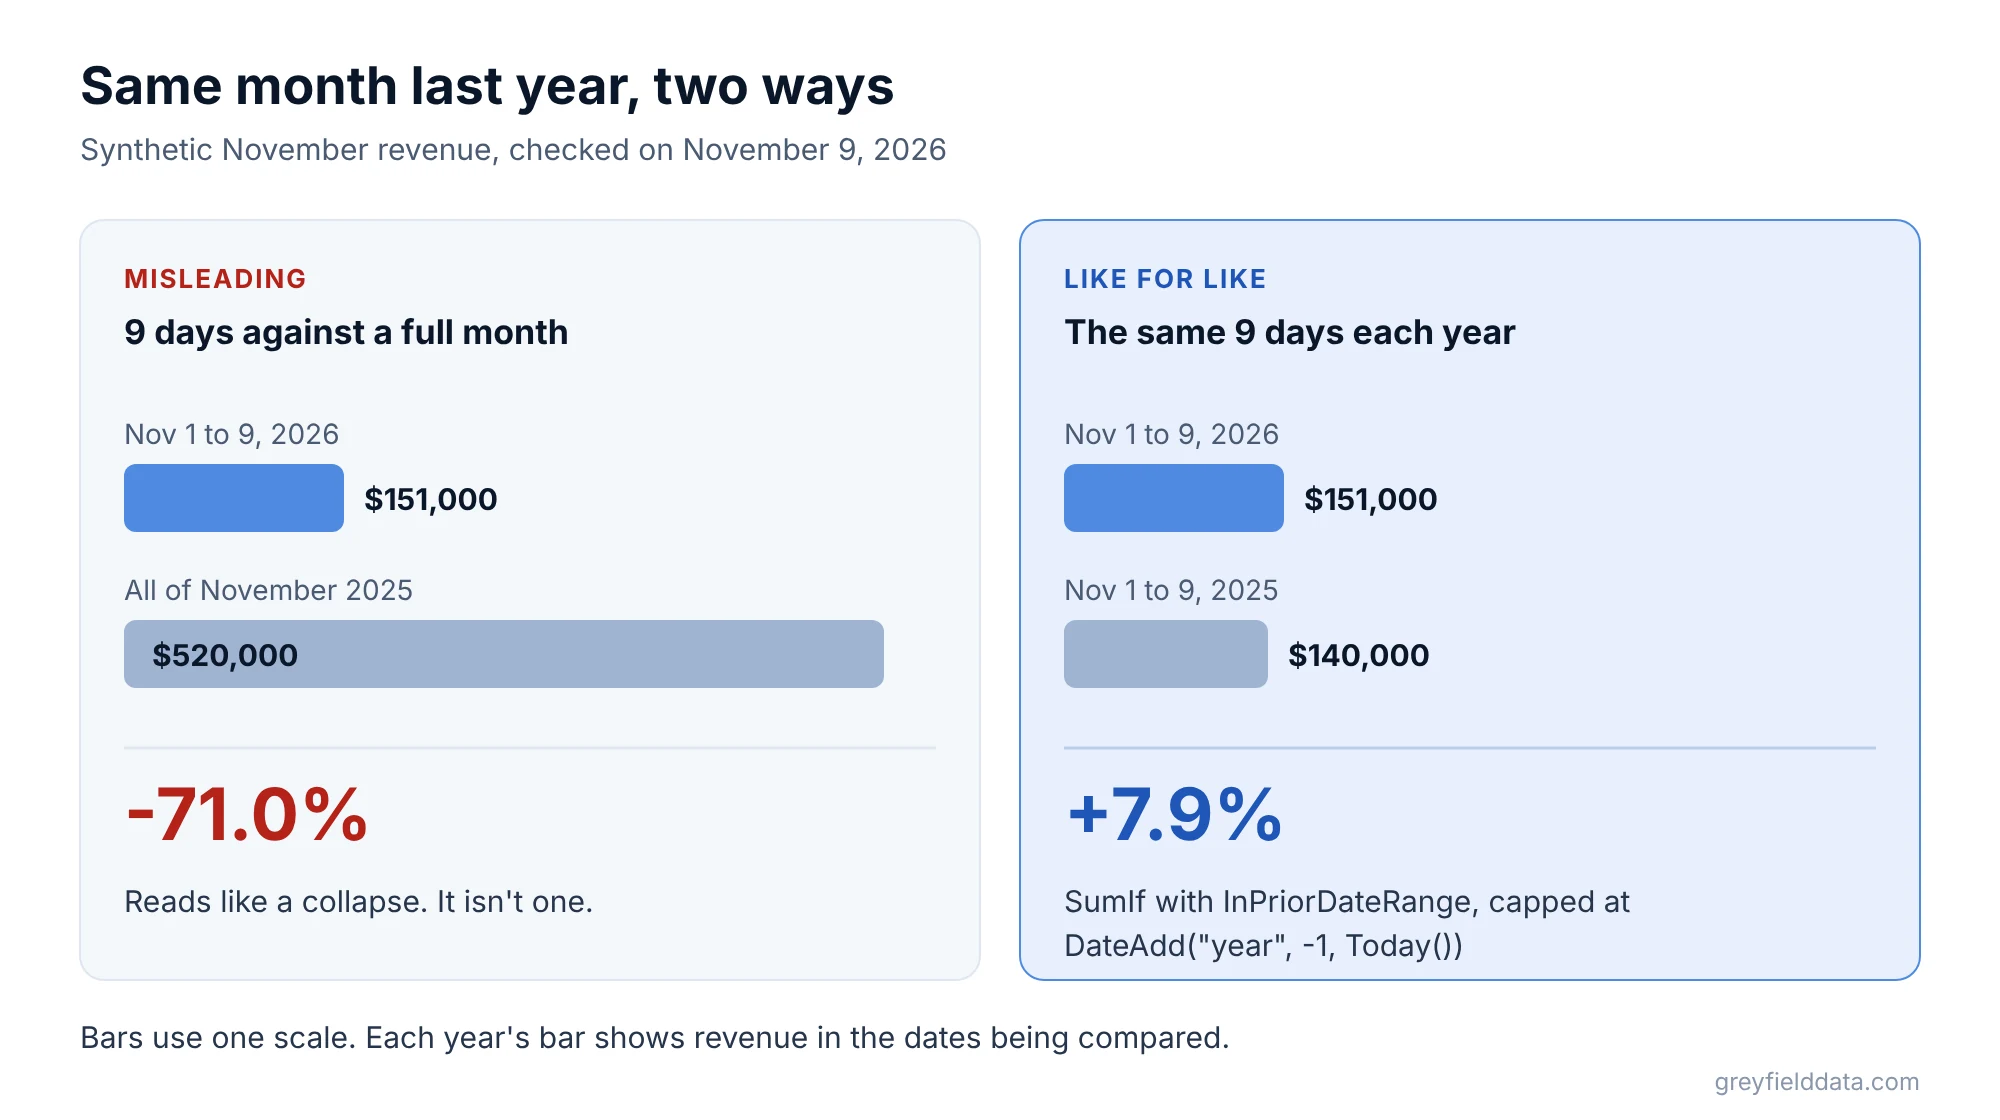
In the synthetic data, November 1 to 9, 2025 brought in $140,000. Against that, this year's $151,000 is up 7.9%, not down 71%.
Build month to date against the same days last year
Use SumIf with date conditions. In a table with no groupings an aggregate is calculated per row, so add these as table summaries with Add summary > New summary, or as grouping calculations. This month to date:
SumIf([Revenue], InDateRange([Order Date], "to_date", "month"))
InDateRange with "to_date" covers the current month up to today. The same days last year:
SumIf([Revenue], InPriorDateRange([Order Date], "month", "year"), DateTrunc("day", [Order Date]) <= DateAdd("year", -1, Today()))
InPriorDateRange with "month", "year" is True for this month last year. The second condition, built with DateAdd and Today, cuts it off at the same date. SumIf joins its conditions with AND.
For year to date against last year to date, change "month" to "year" in both formulas.
Or leave the partial period out
If the dashboard is a monthly trend, the simpler fix is to hide the current month. Our combo chart post shows the relative date filter with Include current month turned off.
Which date comparison method should you use?
Pick by the question you're answering.
| Question | Method | Watch for |
|---|---|---|
| Monthly or quarterly trend vs last year | Period over period workflow or DateLookback |
One value per date in the grouping |
| This month so far vs last year | SumIf with InDateRange and InPriorDateRange |
Cap last year at the same date |
| Year to date vs last year to date | Same SumIf pattern with "year" |
Today() is the date of the last refresh |
| Change from the previous row | Lag | A missing month shifts the comparison |
| Fiscal year comparisons | Lookup on a fiscal period key |
DateLookback can return Null |
| Days between two dates | DateDiff | Sigma rounds to the nearest integer |
Why Lag isn't a period comparison
Lag([Monthly Revenue], 12) returns the value twelve rows up. That equals last year only if every month has a row. If a store had no sales in March, the rows shift and every later month compares against the wrong one. DateLookback matches on the date, so it doesn't have this problem.
Time zones and truncation
DateTrunc presents results in your organization's time zone, and Sigma notes this can make days or months look offset when the data is in another zone. If a month boundary looks a day off, check the account time zone before the formula. DateTrunc("week", ...) starts weeks on Sunday unless you use "week_starting_monday".
Where this helps in real reporting
For a commodity brokerage, comparing today against last Tuesday used to mean digging up an old spreadsheet. We rebuilt its daily report in Sigma on two years of Snowflake history, and report assembly went from about five hours a week to about thirty minutes (case study).
For the full list of date functions, see the Sigma functions list. If you're coming from spreadsheets or DAX, the Excel to Sigma functions cheat sheet and the Power BI DAX to Sigma cheat sheet cover how SumIf and other everyday formulas translate. For running totals and moving averages, see running totals in Sigma.
Frequently asked questions
How do I calculate year over year growth in Sigma?
Group by month, add DateLookback([Monthly Revenue], [Month of Date], 1, "year") as last year's value, and divide the difference by it. Or use Add column via > Period over period comparison and pick Same month last year with % difference.
Why does DateLookback return Null in Sigma?
Usually because the grouping has more than one value per date, the lookback falls outside your data, or the period is smaller than the grouping's date grain. Group by the date only, or use Lookup for fiscal calendars.
How do I compare month to date with the same period last year in Sigma?
Use SumIf with InDateRange([Order Date], "to_date", "month") for this year, and InPriorDateRange([Order Date], "month", "year") plus a condition capping the date at DateAdd("year", -1, Today()) for last year.
Can I do period over period in a Sigma pivot table?
Yes. The period over period workflow works in pivot tables and charts, where it adds the truncated date and comparison value to the underlying data for you to place.
What is the difference between Lag and DateLookback?
Lag returns a value from a fixed number of rows earlier. DateLookback returns the value from an earlier date period, so it stays correct when a period is missing.
What to do next
Add a Revenue LY column with DateLookback to one monthly table, then check the current month against the same days last year before anyone reads the percentage. If you're moving period comparisons from Tableau or Power BI and want them checked against the old numbers, book a call with me.
Part of the Sigma guides, a reading path through related articles.
Linus Tse
Founder of Greyfield Data. Built 400+ dashboards. Certified in Sigma, Snowflake, Tableau, and Power BI.
About Linus