How to build a monthly board reporting pack in Sigma
Replace slides built from Excel with a monthly board pack in Sigma: P&L, cash and KPIs from Snowflake, commentary in input tables, and a scheduled PDF.

Written by Linus Tse, founder of Greyfield Data
· 7 min read
On this page 9 sections
The monthly board pack often takes a finance team several days. Numbers come out of the ledger into Excel, get pasted into charts, the charts get pasted into slides, and the commentary is typed around them. When a number changes late, every copy has to change too.
We build board packs in Sigma on Snowflake so the numbers, charts and commentary live in one place and the PDF goes out on a schedule. That is part of our Sigma Computing consulting work for finance teams, including banks and brokerages and private equity firms and their portfolio companies.
Key takeaways
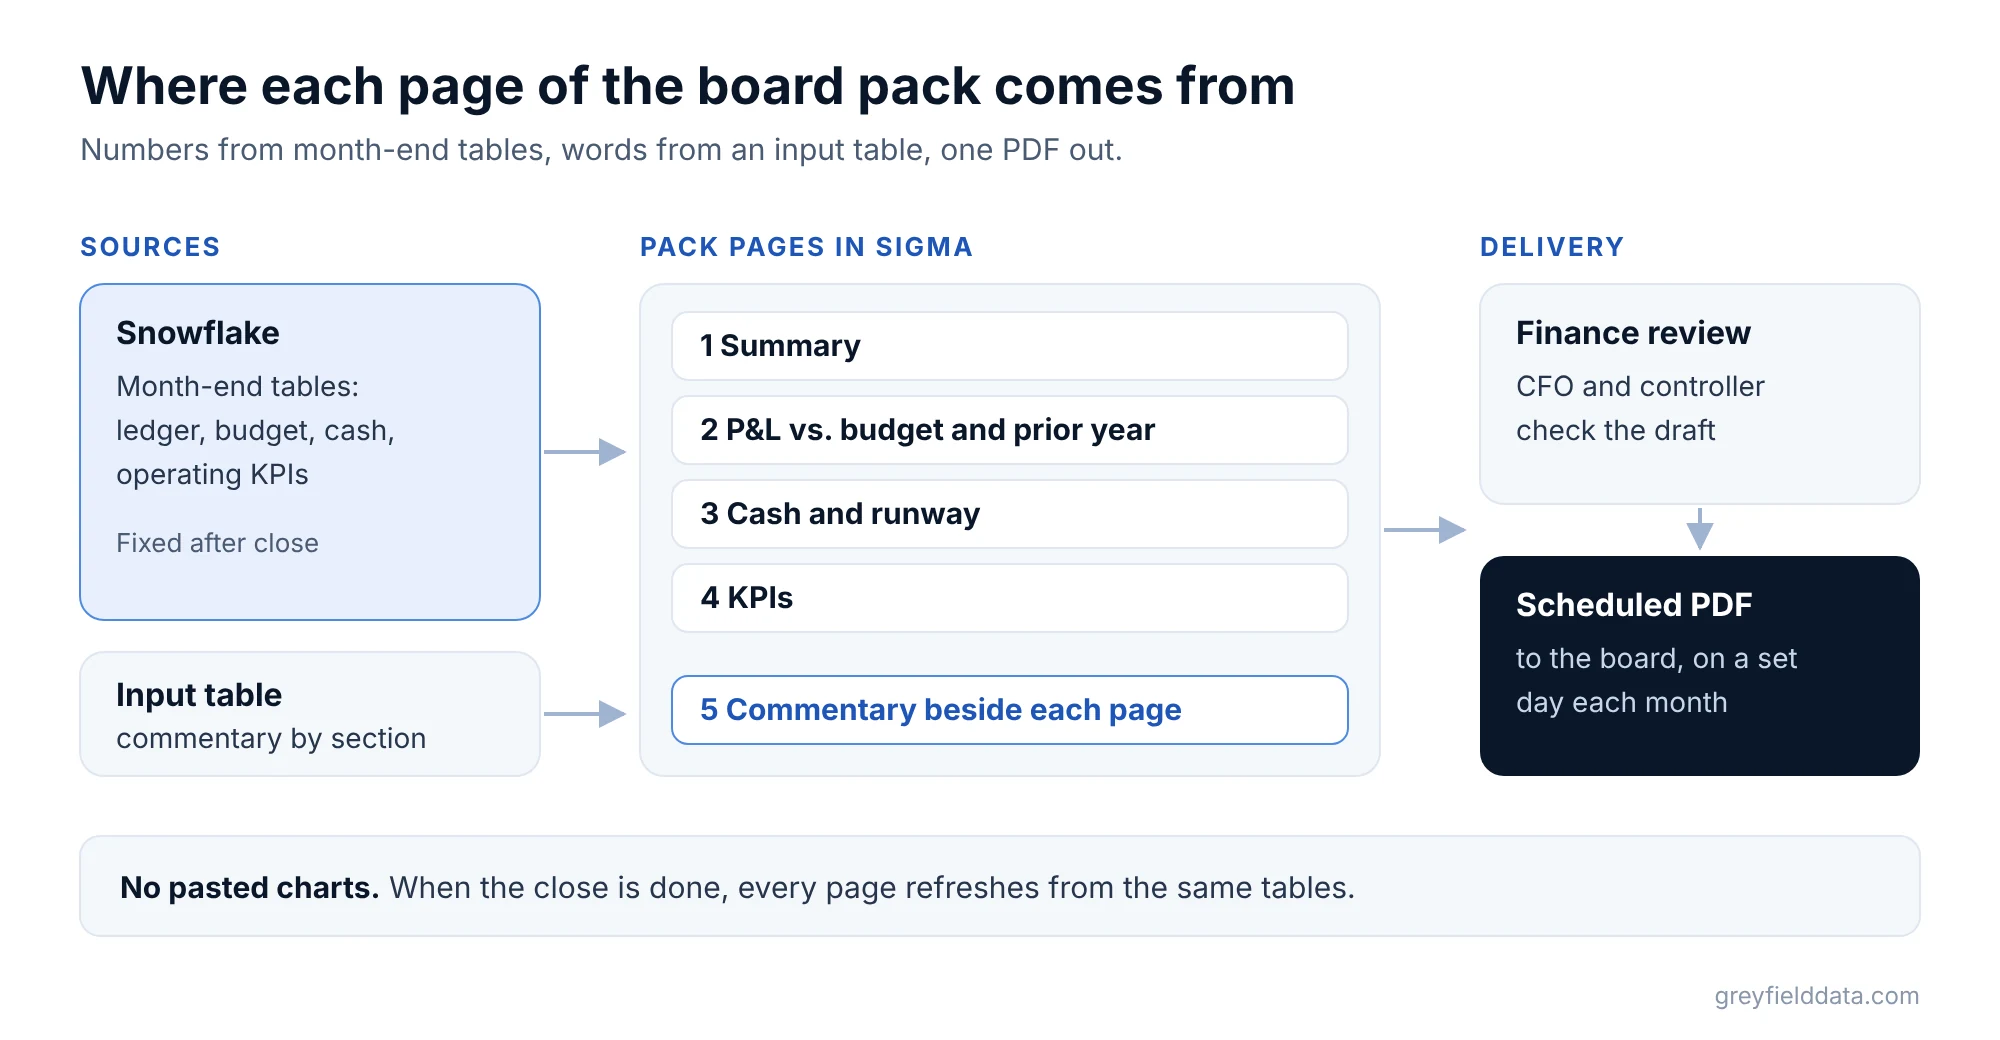
- A monthly board pack usually has five parts: a summary, the P&L against budget and prior year, cash and runway, KPIs, and commentary.
- The numbers come from month-end tables in Snowflake, so the charts refresh when the close is done instead of being rebuilt.
- Commentary goes in a Sigma input table, one row per section per month, with who wrote it and when.
- Sigma's reports document type gives paginated, pixel-perfect PDFs, and a scheduled export sends them.
- Keep month-end data in dated tables so last quarter's pack shows the same numbers it showed then.
What goes in a monthly board reporting pack?
A board pack shows the board how the business did last month, where cash stands, and what management wants them to know. Most packs fit on five to ten pages.
| Section | What it shows | Source |
|---|---|---|
| Summary | Five to ten headline numbers and the main messages | Snowflake, plus commentary |
| P&L | Revenue, gross margin, operating costs, EBITDA, against budget and prior year | General ledger and budget |
| Cash | Cash balance, cash flow, net burn, runway, debt | Ledger and bank data |
| KPIs | The operating measures the board follows | Operating systems |
| Commentary | What happened, why, and what is next | Written by finance |
The diagram shows where each page gets its numbers and words.
Keep the list of headline numbers the same from month to month. The board should be able to compare this pack with the last one without relearning it.
How do you show the P&L against budget?
Show actual, budget, and the variance side by side for the month and year-to-date, with prior year next to them. Variance is actual minus budget.
Here is a synthetic example, with made-up numbers.
| Line | Actual | Budget | Variance | Variance % |
|---|---|---|---|---|
| Revenue | $4,200k | $4,000k | $200k | 5.0% |
| Gross margin | $2,520k | $2,480k | $40k | 1.6% |
| Operating costs | $1,900k | $1,850k | $50k | 2.7% |
| EBITDA | $620k | $630k | -$10k | -1.6% |
Revenue and margin above budget are favorable. Costs above budget are unfavorable, even though the variance is positive. Mark favorable and unfavorable with words or a consistent color, so nobody has to work out the sign.
Check the math: gross margin $2,520k minus operating costs $1,900k is EBITDA of $620k. On budget, $2,480k minus $1,850k is $630k.
In Sigma, a pivot table on the month-end P&L table gives this layout, and a date control picks the month. If your team builds these in Excel today, our Excel to Sigma functions cheat sheet maps the formulas.
How do you show cash and runway?
Show the cash balance, how it moved during the month, and how many months it lasts at the current burn. Runway is cash divided by average monthly net burn.
A synthetic example: $6.0M of cash and an average net burn of $400k a month over the last three months gives 15 months of runway ($6,000k ÷ $400k).
State which months the average uses, and keep it the same each month. If the company is cash-generative, show cash flow and debt headroom instead of runway.
How do you add commentary without slides?
Put commentary in a Sigma input table: one row per pack section per month, with a text column for the comment. The pack page shows the row for the selected month next to the numbers it describes.
Input tables support this setup well, according to Sigma's input table docs:
- Data is written to your warehouse, so commentary sits next to the numbers.
- Row edit history columns show who created and last updated each comment, and when.
- Data entry permissions control who can edit, and data validation can limit the section column to a fixed list.
Key each comment by month and section, and never overwrite last month's rows. Sigma notes that restoring a workbook to an earlier version does not roll back input table contents, so the month key is what keeps old commentary attached to old packs.
A simple status column (draft, reviewed, final) gives the CFO one place to see which sections are ready.
How do you export and schedule the board pack as a PDF?
Build the pack as a Sigma report or a workbook page, then schedule an email export. Reports are Sigma's document type for "predictable, pixel-perfect, paginated" output, and they support ad hoc and scheduled exports (reports overview).
For the schedule, Sigma's email export options include a monthly frequency on a chosen day and time, or a custom cron schedule, in your time zone. A custom setting such as 0 8 10 * * sends at 8:00 a.m. on the 10th of each month.
Many finance teams prefer to review before anything goes to the board. Two ways to keep that step:
- Schedule to finance first. The scheduled PDF goes to the CFO and controller. Once approved, someone sends it to the board.
- Freeze the approved version. Sigma version tags create a read-only view of a document version, and depending on the destination and format, exports can use a version tag. Version tags are created and managed by admins.
A version tag freezes the layout, not the data. Month-end tables that never change after close are what keep the numbers fixed.
How much time does a Sigma board pack save?
The saving comes from not rebuilding charts and slides each month. Measure your current hours before you start, so you can compare. The reporting time calculator helps set that baseline.
Our clearest measured example is a daily report: for a commodity brokerage, producing it went from about 5 hours a week to about 30 minutes in Sigma on Snowflake (case study). A monthly pack is a different report, but the same thing changes: assembly moves to a schedule, and finance spends its time on review and commentary.
| Task | Excel and slides | Sigma on Snowflake |
|---|---|---|
| Pull month-end numbers | Export and paste each month | Read from month-end tables |
| Update charts | Re-paste or relink each chart | Refresh when data loads |
| Write commentary | Typed into slides | Entered in an input table, by section |
| Answer "what did last March show?" | Find the old deck | Pick March in the date control |
| Send the pack | Save as PDF and email | Scheduled PDF export |
Frequently asked questions
What is a board reporting pack?
A board reporting pack is the set of pages management sends the board before each meeting. It usually covers the P&L against budget, cash, KPIs, and management commentary.
Can Sigma export a board pack as a PDF?
Yes. Workbooks and pages can be exported as PDF, and Sigma's reports document type is built for paginated, pixel-perfect PDFs. Both can be sent on a schedule.
How do you add commentary to a Sigma dashboard?
Use an input table with one row per section per month. Finance types the comment in Sigma, and the pack page shows the row for the selected month.
Is a CFO board pack dashboard the same as the board pack?
Not quite. The dashboard is the live workbook finance uses all month. The pack is the fixed PDF the board receives. Building both from the same tables means they always agree.
What to do next
Take last month's board deck and list every number in it with where it came from. Numbers with one clear source are ready to move into Sigma first. For a sector example, see our infusion group board pack. If you want us to build the pack with you, see Sigma Computing consulting or book a call.
Part of the Sigma guides, a reading path through related articles.
Linus Tse
Founder of Greyfield Data. Built 400+ dashboards. Certified in Sigma, Snowflake, Tableau, and Power BI.
About Linus