How to build a daily P&L and positions report in Sigma on Snowflake
Build a daily P&L and positions report in Sigma on Snowflake: the data you need, dated tables so any past day reproduces, checks, and scheduled delivery.

Written by Linus Tse, founder of Greyfield Data
· 8 min read
On this page 9 sections
Most daily P&L reports start the same way: someone opens a spreadsheet before the market opens, pastes in the overnight positions and closing prices, fixes whatever broke, and emails a static sheet. It works until that person is out, or until someone asks what the book looked like last Tuesday.
We rebuild these reports in Sigma on Snowflake so the assembly runs on a schedule and any past day opens from a date picker. If you want help with yours, that is part of our Sigma Computing consulting work for hedge funds and banks and brokerages.
Key takeaways
- A daily P&L and positions report needs four inputs: positions, trades, closing prices, and the fund administrator's files. Each one lands in Snowflake with the date it describes.
- Dated tables that never overwrite a prior day are what make any past report reproducible. In Sigma, a date control picks the day.
- Simple checks (missing prices, stale prices, position breaks against the administrator, unusual moves) run before the report goes out, and a conditional export can alert the team when one fails.
- Scheduled exports send the report by email on a daily or weekday schedule, in your time zone.
- Run the old spreadsheet and the new report side by side for a few weeks, and compare at the precision people actually read.
What does a daily P&L and positions report show?
A daily P&L and positions report shows what the fund holds at the close and how much each holding made or lost that day. Most versions have a summary at the top and detail underneath.
- Summary: total daily P&L, month-to-date and year-to-date P&L, gross and net exposure, by fund and by strategy or portfolio manager.
- Positions: quantity, price, market value, and daily P&L per security.
- Movers: the largest gains and losses of the day.
- Exceptions: anything a check flagged, so the reader knows what to trust.
Daily P&L for a position is its ending market value, minus its starting market value, minus what you paid for buys, plus what you received from sells, plus income such as dividends or coupons, minus fees.
Here is a synthetic example, with made-up numbers.
| Item | Value |
|---|---|
| Yesterday: 1,000 shares at $50.00 | $50,000 |
| Bought today: 200 shares at $51.00 | $10,200 paid |
| Today's close: 1,200 shares at $52.00 | $62,400 |
| Daily P&L: $62,400 minus $50,000 minus $10,200 | $2,200 |
Check it another way: the original 1,000 shares gained $2.00 each ($2,000), and the 200 new shares gained $1.00 each ($200). That is $2,200.
What data do you need for a daily P&L report?
You need four sets of data, each stamped with the date it describes, not the date it was loaded.
| Data | What it holds | Usual source | Key fields |
|---|---|---|---|
| Positions | What each fund holds at the close | Order or portfolio management system | As-of date, fund, account, security, quantity |
| Trades | Every buy, sell and corporate action | Order management system or broker files | Trade date, security, quantity, price, fees |
| Prices | Closing price for each security | Market data vendor or pricing service | Price date, security, price, currency, source |
| Fund admin files | The administrator's view of positions and NAV | Daily or monthly files from the fund administrator | As-of date, fund, security, quantity, market value |
You also need a security master (identifiers, asset class, currency, strategy tags) and, for multi-currency funds, daily FX rates.
The fund administrator's files are usually the official record. The report you build is the fast, daily view, and the check against the administrator is what tells you the two agree.
Why do dated tables make any past day reproducible?
Dated tables keep one row per security per day and never overwrite a prior day. To rebuild last Tuesday, you read last Tuesday's rows.
Spreadsheet reports lose history because each morning's paste replaces yesterday's numbers. The only record of a past day is whatever file someone saved and emailed.
The diagram shows the flow from the four sources to a scheduled report.
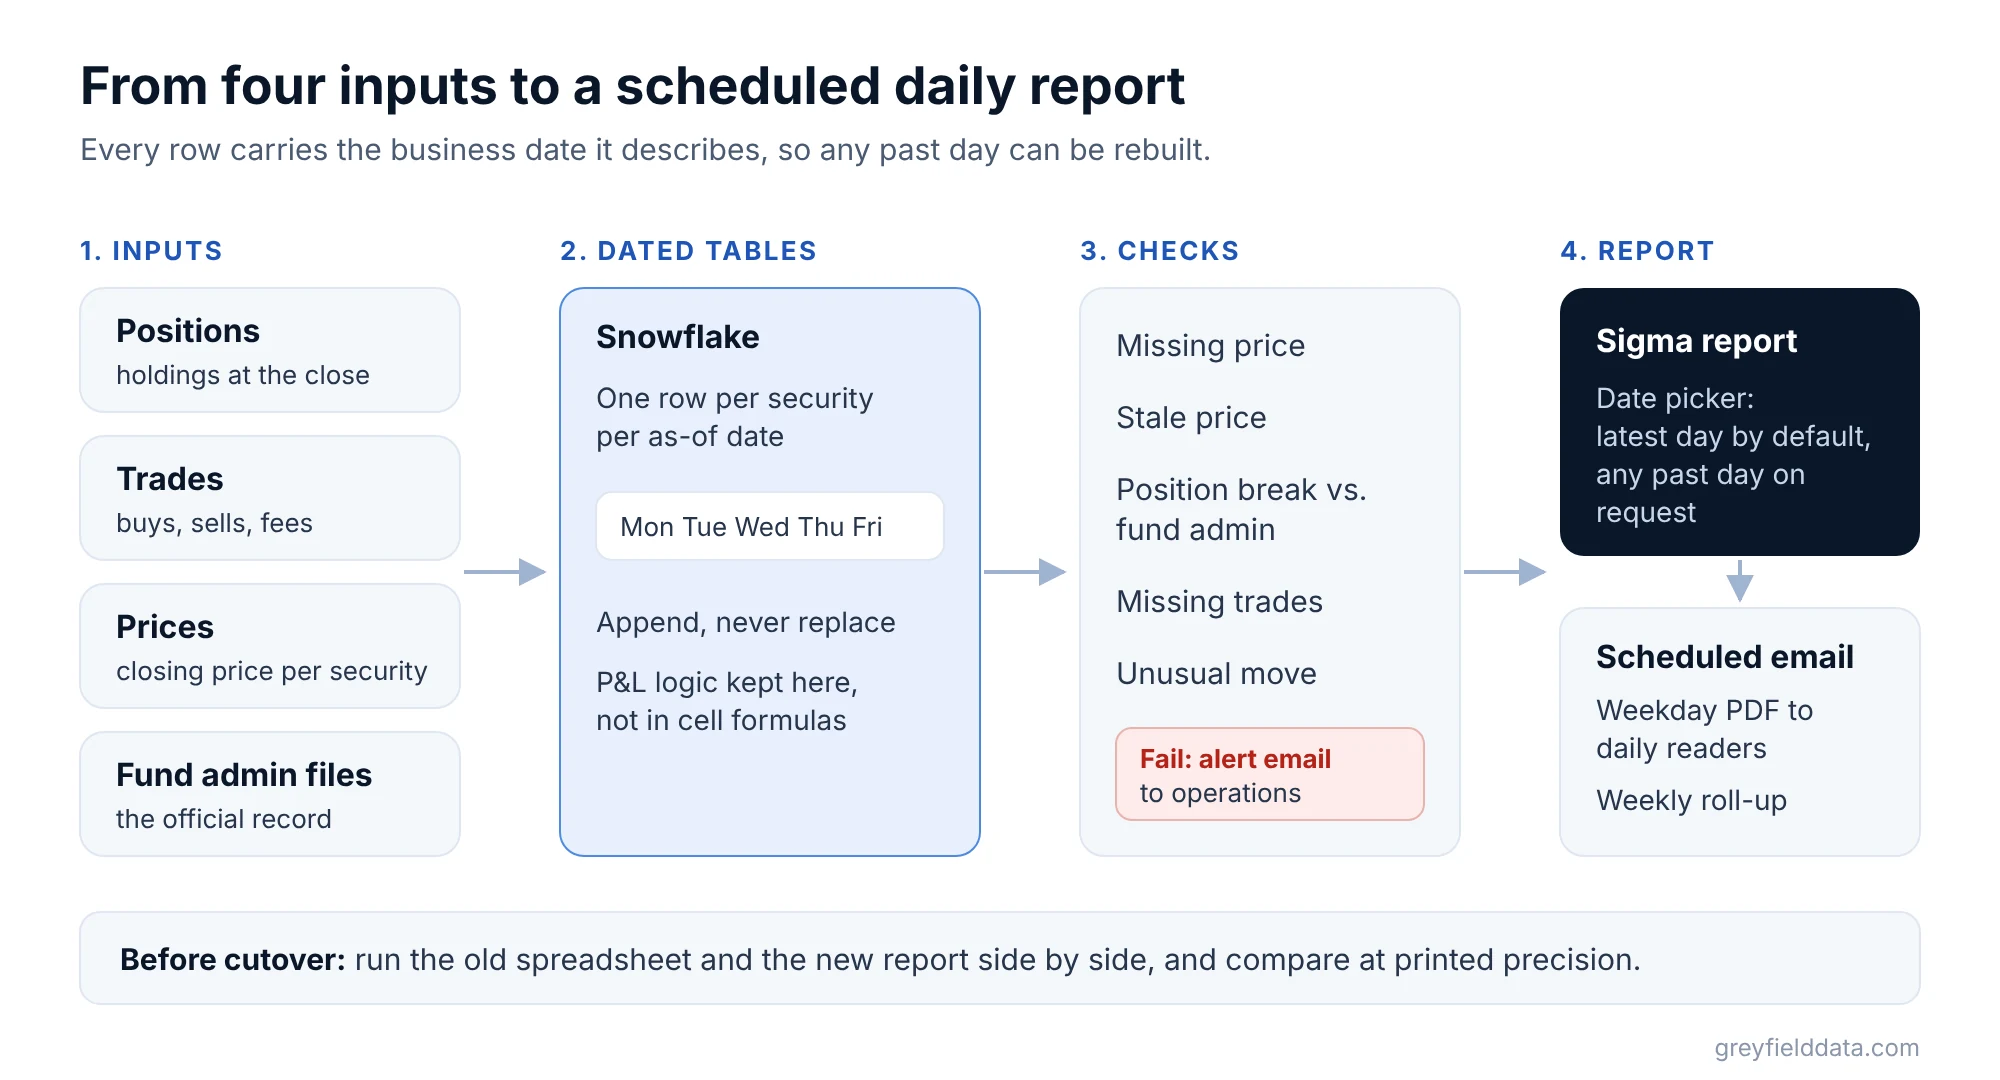
Three rules keep the tables reproducible:
- Every row carries an as-of date. Positions, prices and administrator files all use the business date they describe.
- Append, don't replace. A late price correction becomes a new row with a load time, so you can see both the original and the correction.
- Keep the logic in the warehouse. The P&L calculation lives in a Snowflake view or table, not in cell formulas, so everyone reads the same calculation.
In Sigma, the report reads those tables directly from Snowflake. A date control set to the latest business day is the default, and a reader can change it to any past date.
We did this for a commodity brokerage that built its daily market report in a spreadsheet. The case study has the details: the desk can now open any report date from the last two years, and producing the report went from about 5 hours a week to about 30 minutes.
Which checks should run before the report goes out?
Run a short list of checks every morning, and show any failures at the top of the report. A reader should never have to guess whether a number is stale.
| Check | What it catches | Typical rule |
|---|---|---|
| Missing price | A position with no closing price | Count of held securities with no price for the as-of date |
| Stale price | A price that did not update | Price equals the prior day's price for a liquid security |
| Position break | Your positions differ from the administrator's | Quantity difference by fund and security |
| Trade completeness | Trades missing from the load | Trade count compared with the source system |
| Unusual move | A data error that looks like P&L | Daily P&L above a threshold you set, per position or fund |
Set thresholds with your operations and risk teams. There is no standard number that fits every fund.
Sigma can send an export only when a condition is met. Its conditional exports check whether an element has data or whether a column passes a threshold. A table of failed checks works well here: if it has rows, the operations team gets an email.
How do you schedule distribution of the daily report?
Schedule it in Sigma as an email export. The export options offer Daily, Weekly, Monthly or a custom cron schedule, several times a day if needed, with a time zone you choose.
A common setup:
- Weekday morning email: the summary page as a PDF to the daily readers, once the morning loads have landed.
- Weekly roll-up: a wider summary to the broader team on Friday or Monday.
- Exceptions alert: a conditional export to operations when a check fails.
The whole workbook, a single page, or one element can go out as a PDF or Excel file, according to Sigma's export formats. If you use a custom cron schedule, 45 7 * * 1-5 sends at 7:45 a.m. on weekdays.
If each portfolio manager should see only their own book, Sigma's row-level security with user attributes filters the rows by who is viewing. For a separate PDF per manager, see Export Bursting.
How do you validate the new report against the spreadsheet?
Run both reports side by side for several weeks and compare them at the precision people read. If the spreadsheet shows P&L to the dollar, compare to the dollar.
- Pick a set of past dates, including month-end and a day with a corporate action.
- Compare totals first: fund P&L, exposure, position count.
- Then compare row by row for any total that differs.
- Label each difference as a fix (the new report is wrong) or a known data question (the spreadsheet was wrong, or a price source differs).
- Retire the spreadsheet only when the remaining differences are understood.
In the brokerage engagement, we compared the rebuilt report against the original spreadsheet cell by cell at the printed precision. That turned arguments into a list of items to triage. Our validation checklist covers the method in more detail.
Frequently asked questions
What is a daily P&L report?
A daily P&L report shows how much each position, strategy and fund gained or lost in one business day. It usually sits alongside a positions report showing what is held at the close.
Can Sigma show a positions report for any past date?
Yes, if the Snowflake tables keep one dated row per position per day. A date control in Sigma then filters the report to the chosen day.
Does a Sigma P&L report replace the fund administrator?
No. The administrator's files remain the official record for NAV and investor reporting. The Sigma report is the faster daily view, and checks against the administrator files show where the two differ.
How often can Sigma send the daily report?
Sigma's scheduled email exports run daily, weekly, monthly, several times a day, or on a custom cron schedule, in the time zone you choose.
How long does it take to build a daily report in Sigma?
It depends on how clean the sources are. In our brokerage case study, both daily reports were live about a month into the engagement.
What to do next
Write down the four inputs your current spreadsheet uses and where each one comes from. That list is most of the scoping work. To estimate what the morning assembly costs you now, try the reporting time calculator. If you want us to build it with you, see Sigma Computing consulting or book a call.
Part of the Sigma guides, a reading path through related articles.
Linus Tse
Founder of Greyfield Data. Built 400+ dashboards. Certified in Sigma, Snowflake, Tableau, and Power BI.
About Linus